
Abstract
An index (Fs) for sediment transfer function is introduced, based on the sediment budget at the channel scale. The purpose of this study is two-fold: to gain a deeper insight into how Fs is influenced by natural and human factors, and to provide some new knowledge for decision making in the management of the Upper Yellow River, China. Since 1960, the Fs of the Lanzhou to Toudaoguai reach of the Upper Yellow River shows a decreasing trend. At the drainage basin level, the decreased Fs can be explained by changes in precipitation and air temperature, as well as by a number of variables describing human activity, such as reservoir regulation, water diversion, and soil and water conservation. The higher temperature reduces the transfer function, while the larger runoff coefficient increases it. At the channel level, the decreased Fs can be explained by a number of variables of flow and sediment input. Three countermeasures for restoration of the Fs are suggested.
Editor Z.W. Kundzewicz
Résumé
Un indice Fs du transfert de sédiments a été défini, basé sur le bilan des sédiments à l’échelle du chenal d’écoulement. L’objectif de cette étude recouvre deux aspects : développer une connaissance plus approfondie de la façon dont l’indice Fs est influencé par des facteurs naturels et humains, et fournir de nouvelles connaissances pour la prise de décision dans la gestion de la partie supérieure du fleuve Jaune, en Chine. Depuis 1960, l’indice Fs du tronçon du fleuve Jaune amont compris entre Lanzhou et Toudaoguai, indique une tendance à la décroissance. A l’échelle du bassin versant, la diminution de l’indice Fs peut être expliquée par les modifications des précipitations et la température de l’air, ainsi que par un certain nombre de variables décrivant l’activité humaine, telles que la régularisation par des réservoirs, la dérivation de l’eau, et la préservation des sols et de l’eau. La température plus élevée réduit le transfert alors que le coefficient d’écoulement plus élevé l’augmente. Au niveau du chenal, la diminution de l’indice Fs peut s’expliquer par un certain nombre de variables d’entrée de débit et de sédiments. Nous proposons trois contre-mesures destinées à la restauration de l’indice Fs.
1 INTRODUCTION
The river system is an open system and has multiple functions including ecological, water resources, flood release, sediment transfer, navigation and environmental functions (Xu Citation2008). For a heavily sediment-laden river like the Yellow River, the study of sediment transfer function (STF) is particularly important. The STF of a river depends on its sediment carrying capacity and is closely related to the water and sediment combinations of the river controlled by natural and human factors in the drainage basin, and also on the processes at reach scales. When these factors change, the STF will also change.
Source-to-sink relationships that characterize catchment sediment cascades have been effectively measured using the sediment budget approach (Walling Citation1983). This approach has been widely used throughout the world (e.g. Trimble Citation1983, Olive et al. Citation1994, Fryirs and Brierley Citation2001). Although most of the studies established this approach at basin scale, it may also be used at reach scales (e.g. Kesel et al. Citation1992, McLean and Church Citation1999). Based on the sediment budget at reach scales, the sediment delivery ratio (SDR) for a river reach can be calculated (Jiongxin Citation2003). In our earlier study (Xu 2008), the SDR at reach scales is used as an index for STF referred to as Fs (Xu Citation2008). Sediment delivery varies with time when the river basin is influenced by climate change or human activity. Reservoir construction is a major factor that changes sediment storage in a river system. Lima Neto et al. (Citation2011) studied the sediment redistribution at basin scale due to a dense reservoir network in a large river basin and Tena et al. (Citation2012) studied the suspended sediment balance at reach scale downstream from dams in a large Mediterranean river.
In Xu (2008), we dealt with the STF in the Lower Yellow River, using the Fs index. In this paper, the Fs of the Upper Yellow River is studied with the following objectives: to improve the method by introducing more quantitative indices of the influencing factors that better reflect the physical reality; and, to reveal the cause of the decreasing trend of Fs in the Upper Yellow River and to propose some countermeasures for better drainage basin management aimed at the restoration of Fs. As the upper part of the river basin is the ‘water tower’ of the Yellow River contributing most runoff to the river, it is greatly different from the middle part, which is the major sediment source area producing much less runoff. The human activity is also different. The Upper Yellow River is an important base for hydro-electric generation in northwest China. Although the reservoirs trap a large quantity of sediment, the sedimentation in the Upper Yellow River has shown an increasing trend since the 1980s, greatly increasing the risk of flood disaster, especially during ice-induced floods. This implies that the STF becomes weakened after dam construction. Much research has been devoted to the variations in sediment load and river flow and channel sedimentation in response to the impact of the Liujiaxia and Longyangxia Reservoirs, the two largest on the Upper Yellow River (Hou et al. Citation2007, Shen et al. Citation2007, Ta et al. Citation2008, Liu et al. Citation2009, Ran et al. Citation2010, Wang et al. Citation2010, Xu Citation2013). The purpose of this study is to answer the question of why the STF becomes weakened when the dams trap large quantities of upstream sediment, and thereby to provide some new knowledge for decision making in sediment management. The Ningxia-Inner Mongolia reach of the Upper Yellow River and the Lower Yellow River are two major alluvial reaches. A comparative study of the Fs between the two reaches is not only important for river management, but also interesting for river science.
2 STUDY AREA
The dividing point between the upper and middle reaches of the Yellow River is located at Hekouzhen. The most downstream hydrometric station is Toudaoguai, located 10 km above Hekouzhen () and draining an area of 367 898 km2. According to the hydrometric data from 1950 to 2008, the mean annual runoff (river flow) at Toudaoguai is 214.6 × 10⁸ m3, and the mean annual suspended sediment load (SSL) is 1.06 × 10⁸ t. The major sediment source areas in the Yellow River basin do not coincide with the major water source areas. The majority of runoff comes from the upper basin above Hekouzhen, and the majority of suspended sediment comes from the middle drainage basin between Hekouzhen and Longmen. The drainage area of the Upper Yellow River accounts for 51.3% of the total area of the Yellow River, the annual water yield for 55.0%, but the annual sediment yield accounts for only 8.7%. In contrast, the annual water yield from the Middle Yellow River basin from Hekouzhen to Sanmenxia accounts for only 40.2% of the total of the Yellow River, but the annual sediment yield accounts for 89.7% of the total (Ye Citation1994).
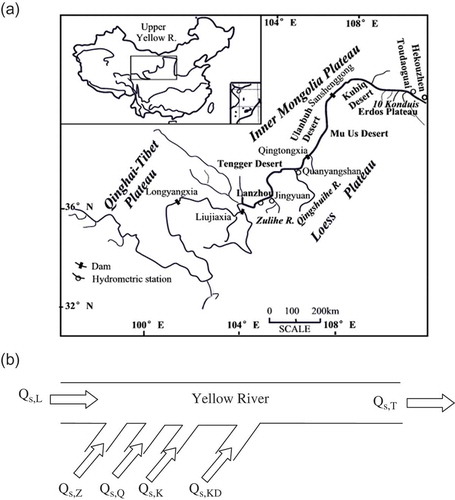
Fig. 1 (a) Location of study area showing Jingyuan and Quanyanshan stations. (b) Schematic relationship between sediment input and output. Qs,L, Qs,T, Qs,Z, Qs,Q, Qs.K and Qs,KD are annual suspended sediment load (SSL) at Lanzhou, Toudaoguai, Jingyuan (on Zulihe River), Quanyanshan (on Qingshuihe River) and from Kushuihe and 10 kondui, respectively. The sediment division (Qs,div) with irrigation water is not shown.
The Upper Yellow River basin can be separated into two parts. The drainage area above Lanzhou is located in high mountain areas in the northeast part of the Qinghai-Tibet Plateau with a cold sub-humid climate. Annual precipitation ranges from 200 to 400 mm and evapotranspiration is low due to low air temperatures. River runoff is relatively abundant and this is the major source area of runoff for the Yellow River. As the surface material on the Qinghai-Tibet Plateau is bedrock with little loess (Ye Citation1994), the specific sediment yield is low compared with other parts of the Yellow River basin.
The area from Lanzhou to Hekouzhen is located in an area of temperate semi-arid or arid climate. Water erosion is relatively weak compared to that on the Loess Plateau, while wind erosion is intensive. Although, on average, erosion intensity is low, some tributaries have high specific sediment yields, such as the Zulihe and Qingshuihe River basins where a considerable part of the land surface is mantled by loess. There are 10 small creeks located in the southern bank of the Yellow River, originating from the northern edge of the Erdos Plateau, crossing the desert and flowing into the Yellow River. The total drainage area of these is 7385 km2 and the specific sediment yield is in excess of 2680 t km-2 year-1. In Mongolian language, the 10 creeks are called ‘10 konduis’, so hereafter we refer to these rivers as 10 konduis (Zhao et al. Citation2008).
Since the 1960s, soil and water conservation measures have been undertaken in some tributary basins where soil erosion is strong, and erosion has been controlled to some degree. Since 1960, 13 reservoirs have been built on the trunk stream of the Upper Yellow River, among which Longyangxia, Liujiaxia, Qingtongxia and Sanshenggong exert a considerable influence on the water and sediment regime. The Longyangxia Reservoir, with total capacity of 247 × 108 m3, regulates river flow on a multi-annual basis, while the Liujiaxia Reservoir, with a total capacity of 57.1 × 10⁸ m3, is used for seasonal regulation of river flow. The main objective of these two reservoirs is hydro-electric generation resulting in great changes to the hydrological regime of the river. Other reservoirs are much smaller in storage capacity, aimed at raising water level to divert water for irrigation, and therefore have a smaller influence on the hydrological regime (Zhao et al. Citation2008).
Due to the differing physiography and geographical settings between the two sub-drainage areas, i.e. the area above Lanzhou and the area between Lanzhou and Toudaoguai, the major source areas for water and for sediment do not coincide in the Upper Yellow River basin. According to data from 1955 to 1967, before the completion of the Liujiaxia Reservoir, the mean annual SSL at Lanzhou station was 1.10 × 10⁸ t, and the mean annual river flow was 322 × 108 m3. Below Lanzhou, the main tributaries are Zulihe and Qingshuihe rivers. The mean annual SSL and river flow for Zulihe was 0.773 × 10⁸ t and 1.63 × 10⁸ m3, respectively, and the mean annual SSL and river flow for Qingshuihe was 0.206 × 10⁸ t and 4.67 × 10⁸ m3, respectively. The increase in river flow due to the two tributaries was 3.1 × 10⁸ m3, accounting for only 0.96% of the annual river flow at Lanzhou station; however, the increase in SSL by the two tributaries was 1.07 × 10⁸ t, accounting for 97.3% of the annual SSL at Lanzhou station (Xu Citation2013). The total SSL of 10 konduis was estimated as 0.22 × 10⁸ t (Zhao et al. Citation2008). The sediment supply from the tributaries between Lanzhou and Toudaoguai was 1.29 × 10⁸ t. It is thus clear that the drainage area between Lanzhou and Toudaoguai supplies little runoff but a large amount of sediment to the Yellow River. Of the total runoff, more than 95% comes from the drainage area above Lanzhou, and less than 5% from the tributaries between Lanzhou and Tougaoguai; however, of the total sediment, 46.0% comes from the drainage area above Lanzhou, and 54.0% from the tributaries between Lanzhou and Tougaoguai (Xu Citation2013).
The present study involves the river reach from Lanzhou to Toudaoguai, 1342 km in length. This river reach is basically located in the Ningxia-Inner Mongolia alluvial plain, and about 1000 km of it crosses deserts, such as the Tengger, Ulanbuh and Kubiq deserts. Thus, most of the river reach is alluvial channel. The channel slope decreases downstream; it is 0.79‰ from Lanzhou to Qingtongxia, 0.25‰ from Qingtongxia to Bayangaole and 0.12‰ from Bayangaole to Toudaoguai.
3 METHOD AND DATA
3.1 Index of sediment transfer function
Different from the concept of sediment carrying capacity, the sediment transfer function for a natural river is at a larger scale, relating to a long river reach over a certain period of time (say, a year or longer). The condition of sediment transport equilibrium is not necessarily needed because a natural river reach always has a sediment transfer function, whether it is in equilibrium or not. The hydraulic behaviour of rivers is highly dynamic, not only in different seasons, but also during a flood event. Hence, it is difficult to describe the sediment transfer function of rivers using hydraulic variables. In geomorphology, a force or a process itself may be described by the effect that the force or process has caused. Thus, the sediment transfer function of rivers is defined using the concept of sediment budget at river reach scales (Xu Citation2008). Assuming that there is a river system that consists of a trunk stream and a few tributaries, the annual sediment input at the inlet of the trunk stream is Qs,i, the annual sediment output at the outlet is Qs,o, and the inflow of sediment from the tributaries are Qs, t1, Qs, t2, …, totalled as ΣQs,t. The Fs is defined as the sediment output from a certain reach divided by the total sediment input to this reach:
The inlet control of the Lanzhou-Toudaoguai river reach is Lanzhou station; the outlet control is Toudaiguai station; the tributaries in between are the Zulihe, Qingshuihe, Kushuihe rivers and the 10 konduis; sediment supply from other tributaries is negligible. Some sediment is diverted with irrigation water from the trunk stream, which may be regarded as a reduction in sediment input. Thus, according to equation (1), the following can be written:
To calculate Fs using equation (1), the sediment input and output should include all sediment loads, namely, both suspended load and bed load. However, just like most large rivers of the world, systematic bed load measurement is not carried out in the Upper Yellow River. However, bed load measurements were taken at Toudaoguai station in 1964,1965 and 1966, with annual bed load transports of 0.376, 0.291 and 0.317 × 10⁶ t (cf. Hydrological Bureau et al. Citation1967), respectively, representing only 1.27‰, 3.55‰ and 1.69‰, respectively, of the annual SSL in each year. Therefore, bed load is not significant in terms of total sediment transport. Due to the lack of bed load data for most of the relevant stations, it was impossible to include the bed load element and only suspended sediment is considered in this study, so the established sediment budget is a suspended sediment budget. Since most of the river bed from Lanzhou to Toudaoguai is made up of fine sand—e.g. the median size of bed material at Baotou station 38 km upstream from Tougaoguai is 0.104 mm (Zhao Citation1996)—it is implicit that sediment transport is dominated by suspended sediment, and the percentage of bed load is rather low.
3.2 Indices of influencing factors at channel and drainage basin levels
3.2.1 Influencing factors at drainage basin level
Both natural and human factors influence variations in runoff and sediment yield. Annual precipitation and temperature are taken as climate variables. Due to the marked difference in runoff generation between the drainage area above Lanzhou and that between Lanzhou and Toudaoguai, the area-weighted annual precipitation over the drainage area above Lanzhou (PL), between Lanzhou and Toudaoguai (PLT) and that above Toudaoguai (PT) are used as precipitation indices. The area-weighted annual air temperature (TL) over the drainage area above Lanzhou and that (TT) above Toudaoguai are used as temperature indices.
There are three categories of human activity in the study area, namely reservoir construction, water diversion, and soil and water conservation. So far 13 dams have been built on the trunk stream of the Upper Yellow River, greatly regulating the time distribution of runoff and sediment transport and thereby changing the sediment degradation and aggradation processes of the river channel. Reservoir regulation on annual water and sediment regimes depends not only on the storage capacity of the reservoir, but also on the annual flow of the river. Thus, the ratio (Rra) of total storage capacity (ΣCre) of all reservoirs on the trunk stream to the annual runoff (river flow) (Qw) measured at Toudaoguai station is used as an index: Rra = ΣCre/Qw, where Rra may be called the regulation coefficient of reservoirs on annual flow (Xu and Yan Citation2010). The ratio (Rhr) of the high-flow-season flow (Qw,H) to the annual flow (Qw) downstream of the reservoir is also used: Rhr = Qw,H/Qw, to quantify the flow regulation by the reservoir. The Ningxia-Inner Mongolia Irrigation District, the most well-known irrigation district in China, is located in the study area, and the amount of water diversion is large. The index of net water diversion (Qw,div) is used, defined as the annual amount of actual water diversion minus the amount of water returning to the river after use. To assess the relative amount of net water diversion, the ratio (Rdiv) of net water diversion (Qw,div) to natural runoff (Qw,n) is used: Rdiv = Qw,div/Qw,n. The Qw,n is calculated as Qw,n = Qw,m + Qw,div, where Qw,m is the measured runoff. Soil and water conservation measures including land terracing, tree planting and grass planting, may be indexed by the area (Atfg) covered by such measures. Another measure is check-dam building for trapping sediment from gullies, the effect of which is usually indexed by the area (Ac) of the land created by the trapped sediment above the check-dam (Wang and Fan Citation2002). In essence, the effect of sediment reduction of soil and water conservation measures results from runoff regulation on hillslopes and gullies, which reduces the runoff to precipitation coefficient during rainstorms. Thus, the natural runoff coefficient (Cnr) is also used as an index for soil and water conservation measures: Cnr = Qw,n/P, where Qw,n is annual natural runoff and P is annual precipitation, both above Toudaoguai.
3.2.2 Influencing factors at channel level
Due to a lack of data on channel shape and its variation, river flow and suspended sediment load are considered. The scour and fill behaviour of the river is controlled by the combination of river flow and sediment load. If sediment supply is large relative to river flow, the relative ‘load’ of the river is heavy, then it is incapable of carrying all the sediment downstream, and sediment deposition occurs. On the other hand, if sediment supply is not sufficient relative to river flow, the relative ‘load’ of the river is light, and then apart from carrying all the sediment downstream, the river has some surplus capability to scour the riverbed. The relative ‘load’ of a river can be expressed by the ratio of sediment load to its sediment carrying capability. As an approximation, we use the following two indices to reflect the river’s relative ‘load’ (Xu Citation2013):
Based on data for all variables, time series analyses and statistical analyses are performed, with the Mann-Kendall method (Kendall Citation1975) being used to detect the trend and jump change points.
4 RESULTS AND DISCUSSION
4.1 Temporal variation in Fs and the influencing variables
The temporal variation in Fs is shown in , where a linear regression equation is given with the squared correlation coefficient (also called determination coefficient) R2 at a level of p < 0.01, where p is probability of significance. This indicates that the decreasing trend in Fs is significant. The decreased Fs may result in channel sedimentation and reduces the flood releasing capacity of the river, increasing the risk of flood hazard. Thus, it is necessary to discover the causes for the decreased Fs, which will help in enhancing Fs by drainage basin management measures including reasonable river flow regulation by reservoir operation. From 1960 to 1986 the inter-annual fluctuation around the average (Fs = 0.556) is large. After 1986 a step-like decrease occurs and the averaged Fs declines to 0.168. An analysis using Mann-Kendall’s U is performed to further detect the trend in Fs, and the result is shown in . The Mann-Kendall U was calculated for the forward statistic sequence and the reversed statistic sequence of Fs, referred to as UFk and UBk, respectively. The curve showing temporal variations in UFk can be used to reflect the trend of variation. The UFk has an overall decreasing trend, with two turning points at 1974 and 1986: UFk decreased from 1960 to 1974, and then increased; after 1986, it decreased again. If the intersection point of the curves of UFk and UBk occurs within the confidence interval of −0.05 < α < 0.05, then it indicates a jump-change point (Demaree and Nicolis Citation1990; Moraes et al. Citation1998). shows that the curves of UFk and UBk intersect at 1986 and the intersection point is located within the confidence interval; therefore, the year 1986 is a jump-change point. The year 1974 was when the Liujiaxia Reservoir was completed and all five groups of hydro-electric generators started electricity generation; 1986 was the year when the Longyangxia Reservoir was completed and used for water storage. Hence, the change in Fs is closely related to reservoir construction and operation, which is discussed in more detail later.
Fig. 2 Temporal variation in Fs: (a) variation in Fs and (b) variations in UFk and UBk of Fs. Confidence interval between −0.05 < α < 0.05.
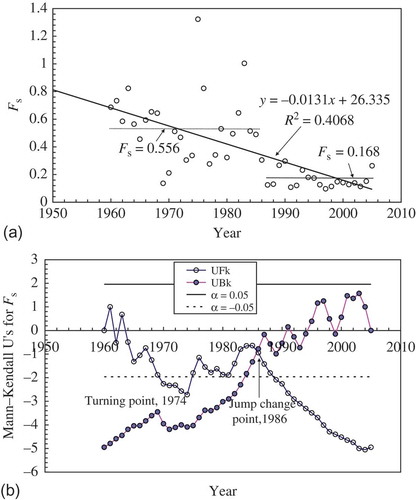
Fig. 3 Temporal variation in influencing variables at (a) and (b) basin and (c) channel-reach levels.
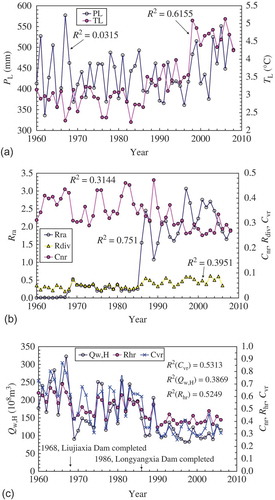
The temporal variations in influencing variables at basin level are shown in and and those at channel-reach level in . There is a significant increasing trend in TL, especially since the early 1980s, but no increasing or decreasing trend in PL. The linear correlation coefficient between annual precipitation and annual temperature is only 0.168, with p = 0.225. Therefore, there is no significant correlation between the two climate variables. The Rra and Rdiv increase and the Cnr decreases; the trends of all the three variables are significant at level of p < 0.01. The three variables related to dam regulation on streamflow show significant decreasing trends, with abrupt declines in 1968 and 1986. The former corresponds to the closure of the Liujiaxia Dam and the latter to the completion of the Longyangxia Dam, which has much greater impact on the river.
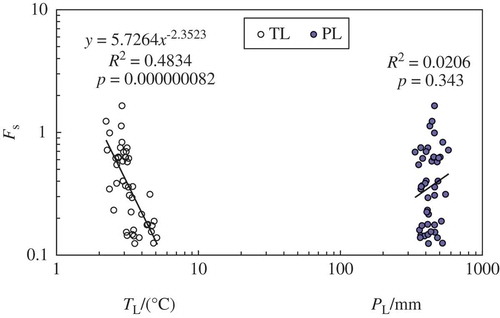
Fig. 4 Plots of Fs against annual precipitation (PL) and air temperature (TL) for the drainage area above Lanzhou.
4.2 Relationship between Fs and drainage basin factors
As previously mentioned, the drainage basin factors influencing Fs include climate variables such as PL, PLT, PT, TL and TT, and variables of human activity such as Rra, Atfg, Ac, Qw,div and Cnr. shows the plots of Fs against annual precipitation (PL) and air temperature (TL) over the drainage area above Lanzhou; regression equations, R2 and p are also shown. The correlation between Fs and PL is very low (p = 0.343). However, the negative correlation between Fs and TL is high (p < 0.001). This is because a higher temperature may enhance evapotranspiration that reduces runoff and therefore the sediment carrying ability of the river. The very low correlation between Fs and precipitation may be explained by the two-fold effects of the changed precipitation. If precipitation increases, both runoff and sediment supply may increase. The increased runoff means an increased ‘force’ for sediment transfer, but an increased sediment supply means an increased ‘load’ of the river. Because Fs reflects the ratio of ‘load’ to ‘force’, when both the ‘load’ and ‘force’ are increased, the ratio may show little variation, and the correlation between the variations in Fs and precipitation might be low. Furthermore, the time series analysis shows a very low correlation between annual lnPL and time (R2 = 0.010). Thus, it is obvious that the decreasing trend of Fs with time cannot be caused by the variation in precipitation.
shows plots of Fs against Rra, Cnr and Rdiv, with regression equations and R2 and p also given. It may be seen that Fs is negatively correlated with Rra and Rdiv, but positively correlated with Cnr, all significant at a confidence level of p < 0.001. The negative correlation of Fs with Rra means that, after reservoir regulation, Fs decreased (). The effects of reservoir regulation on Fs are two-fold. Sediment trapping by dams may reduce the ‘load’ in the downstream channel, an effect that increases Fs. Flow regulation by dams may reduce water discharge during high-flow seasons and thereby the force to carry sediment, an effect that reduces Fs. If the former effect exceeds the latter, the Fs may increase; if the latter exceeds the former, Fs may decrease. The drainage area below Lanzhou supplies a large quantity of sediment but a small quantity of water to the trunk stream. As noted earlier, more than 95% of the total runoff of the Upper Yellow River comes from the drainage area above Lanzhou, while 54% of the total sediment supply to the Upper Yellow River is from the tributaries below Lanzhou. The Liujiaxia and Longyangxia Reservoirs above Lanzhou can control 46% of the total sediment to the Lanzhou-Toudaoguai river reach at most, but cannot control the remaining 56% that comes in below Lanzhou. Thus, the effect of the two reservoirs to reduce sediment input to this river reach is limited (Xu Citation2013). However, the reservoirs, especially the Longyangxia Reservoir, have a strong ability to regulate the flow above Lanzhou, which accounts for more than 95% of the total flow input to the Lanzhou-Tougaoguai reach. Capable of performing multi-annual regulation on flow for hydro-electric generation, the Longyangxia Reservoir stores huge quantities of water during high-flow seasons, greatly reducing the July–October water discharges of the Langzhou-Toudaoguai river reach and therefore reducing its sediment carrying ability. The runoff from below Lanzhou, which is only 5% of the total, cannot increase the sediment carrying ability. Hence, after the construction of the Liujiaxia and Longyangxia reservoirs, especially the latter, the relative ‘load’ of the Langzhou-Toudaoguai reach does not decrease, but increases, and this can be regarded as the major cause for the decreased Fs. In an overall declining trend (), the points are distributed in three sub-groups: the left contains the points from the period before the Liujiaxia Reservoir was completed, the middle contains the points from the period after Liujiaxia Reservoir was completed but before completion of Longyangxia Reservoir, and the right contains points from the period after the Longyangxia Reservoir was completed. The points in the middle and right sub-groups show a declining trend with the increased Rra, reflecting the influence of varying annual water discharge on Fs. Therefore, for a given reservoir capacity, the higher the annual water discharge, the lower the Rra, and then the higher the Fs.
Fig. 5 Plots of Fs against variables of human activity. (a) Fs versus Rra; (b) Fs versus Rdiv; and (c) Fs versus Cnr.
With an irrigated area of 985 000 ha, the Ningxia-Inner Mongolia Irrigation District is the most important in China. The annual mean net water diversion above Toudaoguai is 114.6 × 10⁸ m3, and the annual ratio Rdiv of net water diversion to natural runoff ranges from 18.2 to 62.1%. Diversion of large amounts of water will reduce river flow and the sediment carrying ability and, thus, Fs decreases. indicates a negative correlation of Fs with Rdiv, with R2 = 0.6679 and p < 0.001. As mentioned previously, Cnr can be used to index the effect of soil and water conservation measures. shows a positive correlation of Fs with Cnr, with R2 = 0.6035 and p < 0.001. Soil and water conservation measures reduce Fs in two ways: firstly, July–October runoff is reduced due to enhanced infiltration and thus the ‘force’ of the river to carry sediment is reduced, and secondly, sediment yield declines due to the reduced soil erosion, which lowers the ‘load’ of the river. The negative correlation of Fs with Cnr means that the former exceeds the latter, and then a decreasing trend in Fs occurs.
Based on data from the period 1960–2005, the correlation matrix between Fs and a number of drainage basin influencing variables is shown in . The result of a t test shows that the correlation of lnFs with lnPL is low (p = 0.34), and the correlations of lnFs with other variables are all significant (p < 0.001). To assess the relative contribution of these influencing variables to the variation in lnFs, we compared, as shown in . A comparison of the correlation coefficients of lnFs with all influencing variables, shows that the three variables related to human activity, i.e. lnRdiv, lnCr,n and lnRre rank first, second and third, respectively, and the two climate variables, i.e. lnTL and lnPL rank fourth and fifth. Therefore, the variation in human activity plays a major role in the decreasing trend of Fs, with the role of the precipitation and temperature variations secondary.
Table 1 Correlation matrix between Fs and a number of drainage basin influencing variables, all converted to logarithmic values. The last row shows the rank of the correlation coefficients of lnFs with each influencing variable.
4.3 Relationship between Fs and water and sediment inputs to the river channel
Drainage basin factors on the river channel influence the amount and time distribution of flow and sediment inputs, and thereby control sediment transfer and shape-forming processes at channel level. Hence, we need to discuss the relationship between Fs and water and sediment inputs to the river channel. A number of variables influencing the Fs of the Lanzhou-Toudaoguai river reach have been introduced: (i) July–October flow (Qwh), (ii) ratio (Rrh) of July–October flow to annual flow, (iii) ratio (Cvr) of standard deviation of monthly flow to monthly mean, (iv) annual amount of water diversion (Qw,div), (v) the average (Cmean,H) of suspended concentration and (vi) the ratio (ξH) of Cmean,H to average water discharge. Variables (i), (ii) and (iii) are at Lanzhou station, (iv) is at Toudaoguai station, and (v) and (vi) are for the Lanzhou-Toudaoguai river reach. shows the correlation matrix of Fs with these influencing variables; all correlation coefficients are significant (p < 0.01). To assess the relative contribution of these influencing variables to the variation in lnFs, we compared the ranking of the correlation coefficients of lnFs with all influencing variables. lnQwh, lnRrh and lnCv,r are ranked first, second and third. They are all related to reservoir regulation, especially from Longyangxia Reservoir. lnξH and lnCmean,H are ranked fourth and fifth, and are influenced by reservoir regulation and soil and water conservation measures. lnQw,div reflects the influence of human water diversion. Hence, all six variables reflect the influences of human activity, which plays a major role in the decreasing trend of Fs.
Table 2 Correlation matrix between Fs and a number of influencing variables at channel level, all converted to logarithmic values. The last row shows the rank of the correlation coefficients of lnFs with each influencing variable.
shows the plots of Fs against Qw,H, Rhr and Cvr at Lanzhou station. All the three correlations are highly significant (p < 0.001). Since the flow at Lanzhou station accounts for 95% of the total flow to the Lanzhou-Toudaoguai river reach, Qw,H at Lanzhou is the major factor controlling the sediment carrying ability of the reach. The variation in Rhr may reflect the effects of reservoir regulation and soil and water conservation on flow regime. and (b) show significant positive correlations, indicating that increases in Qw,H and Rhr are reflected in higher Fs values. Cvr reflects seasonal variations in flows, with a high Cvr indicating a relatively uneven distribution of monthly flows. Hence, this index can reflect the regulation of reservoirs on flow regime. When Cvr is high, the frequency of occurrence of large water discharges is high, and then the sediment-carrying capability is strong, because the latter is in direct proportion to the square of water discharge (Q2) in the Yellow River (Chien and Zhou Citation1965). Thus, a positive correlation occurs between Fs and Cvr ().
Fig. 6 Plots of Fs against flow variables. (a) Fs versus Qw,H; (b) Fs versus Rhr; and (c) Fs versus Cvr.
shows the plots of Fs against two water-sediment variables, ξH and Cmean,H, indicating negative significant correlation (p < 0.001). As mentioned earlier, ξH and Cmean,H reflect the ‘load’ (sediment transport rate, Qs) of the river relative to its ‘force’ (water discharge, Q) to carry the ‘load’. Since Qs is roughly in proportion to Q2 in the Yellow River (Chien and Zhou Citation1965), the ξH, which is defined as Qs/Q2, may better reflect the ‘load’ of the river relative to its ‘force’. If ξH and Cmean,H are high, then Fs would be low. The correlation coefficient for ξH is much higher than that for Cmean,H, indicating that ξH can better explain the variation in Fs.
Fig. 7 Plots of Fs against (a) ξH and (b) Cmean.
4.4 Causes for the decreasing trend of Fs
To determine the trends of the influencing variables, their correlation coefficients with time (the year) have been calculated as shown in and , at drainage basin and channel scales, respectively. It can be seen that, apart from annual precipitation whose correlation coefficient with time is not significant, all other influencing variables have trending variations, decreasing or increasing, significant at a confidence level of p < 0.01. The correlation coefficients of lnFs with the logarithmic value of each influencing variable are also shown, and according to the sign (positive or negative) of the correlation coefficients, the direction in which lnFs is influenced by each variable can be determined. Taking lnRre for example, because the correlation coefficient of lnRre with time is positive, it has an increasing trend of variation; because its correlation coefficient with lnFs is negative, the increase in lnRre may make lnFs decrease, and this is shown in the fourth row of the table. From we can see the increased air temperature might be the cause of the decreased Fs. Other causes for the decreased Fs may include the increase in the regulation coefficient (Rra) of reservoirs on annual flow, the increase in the ratio (Rdiv) of net water diversion to natural runoff, and the increase in the natural runoff coefficient (Cnr) resulting from soil and water conservation. shows the decrease in July−October flow (Qw,h), the increases in Cmean,H and ξH, all due to the reservoir regulation, might be the cause for the decreased Fs, as well as the increase in net water diversion (Qw,div). In drainage basin management, we cannot change precipitation and air temperature, but by changing the variables related to human activity, the unfavourable decreasing trend in Fs can be eased to some extent.
Table 3 Influence of drainage basin variables on the trend of Fs.
Table 4 Influence of flow and sediment variables on the trend of Fs.
4.5 Effect of reservoirs on Fs
In the foregoing sections, the effect of the reservoirs on Fs has been discussed, using Rra index. However, this index is rough and cannot differentiate between the influences of different reservoirs. Of the 13 reservoirs that have been built on the trunk stream of the Upper Yellow River, the Longyangxia and Liujiaxia Reservoirs have the largest storage capacities and exert the greatest effect on sediment transport. The Liujiaxia Dam is located 99 km upstream of Lanzhou, and its total storage capacity at normal level of water storage is 57 × 108 m3, of which the regulation storage capacity is 41 × 108 m3. With the help of the Soviet Union, construction of the reservoir started in 1958, and dam closure occurred in 1960. Later, construction stopped due to deterioration in the Sino–Soviet relationship. In 1964, construction re-started, and in 1968, the reservoir was completed and used for water storage. In 1974, all hydro-electric generating units were put into operation. The primary objective of Liujia Reservoir is hydro-electric generation, as well as flood protection, irrigation and ice flood protection (Xu Citation2013). Longyangxia dam is located 333 km above Liujiaxia Dam, 432 km upstream of Lanzhou. The project was started in 1977, dam closure occurred in 1979, and the reservoir was completed and used for water storage in 1986. The total storage capacity at normal level of water storage is 247 × 108 m3, of which the regulation capacity is 193.5 × 10⁸ m3. Capable of performing multi-annual regulation on river flow, the primary objective of the reservoir is hydro-electric generation, and other objectives include flood protection and irrigation etc. (Xu Citation2013). The regulation of the two reservoirs on flow and sediment regime is different. For the purpose of electricity generation, the Longyangxia Reservoir stores a large quantity of flow during high-flow seasons to raise the water level, while the Liujiaxia Reservoir has much less effect on flow, but a larger effect on sediment load. The major water source area is located above the Longyangxia Dam, but the major sediment source area is located below the Longyangxia Dam and above the Liujiaxia Dam. Data from 1956 to 1967, before the construction of the two dams, show that Longyangxia Dam controls only 1.1 × 10⁷ t of sediment, but the sediment supply from the drainage area between the two dams is 1.03 ×10⁸ t which can only be controlled by the Liujiaxia Dam. The Longyangxia Dam controls 200.02 × 10⁸ m3 of water, and the inflow water between the two dams is 133.15 ×10⁸ m3. Hence, Longyangxia Dam controls most of the runoff above Lanzhou, and Liujiaxia Dam controls most of the sediment above Lanzhou. With a much larger storage capacity, Longyangxia Reservoir is capable of performing multi-annual regulation, while the Liujiaxia Reservoir is capable of performing seasonal regulation only. The regulation of the former is mainly on the flow regime, while the regulation of the latter is on the sediment regime. Moreover, the completion dates of the two dams were different. Controlled by the above factors, the response of the sediment transfer function of the downstream channel to the regulations of the two reservoirs is different.
The regulation of flow and sediment regimes has affected the Fs of the downstream channel in two ways. Sediment trapping by a reservoir may reduce the ‘load’ of the downstream channel, and intercepting a large quantity of flow during high flow seasons may reduce the sediment carrying ability. Whether the Fs increases or decreases depends on which of the two aspects is dominant. After 1974, all electric generators of the Liujiaxia Reservoir were operational, and a large quantity of sediment was trapped, causing serious sedimentation within the reservoir. From 1973 to 1988, 7.92 × 10⁸ t of sediment was deposited, and annual sedimentation was 5.28 × 10⁷ t (Zhang et al. Citation2008). As a result, annual SSL at Lanzhou decreased markedly. In the meantime, the reservoir also intercepted flow during high-flow seasons, but the proportion of the intercepted flow of the total is relatively small because the storage capacity of the reservoir is small (Xu Citation2013). Hence, after 1974, Fs increases and the curve of UFk rises (see ). However, after 1986 when the Longyangxia Reservoir was completed and used for water storage, the situation became quite different. Although this reservoir trapped most of the input sediment, the absolute amount is small because the sediment input to the reservoir is small. From 1986 to 2005, the sediment deposited within the reservoir was 4.0 × 10⁸ t, and the annual sedimentation was 2.0 × 10⁶ t. Hence, the resultant decrease in annual SSL at Lanzhou is small. As the sedimentation in the Liujiaxia Reservoir increased, its storage capacity decreased, and the sediment trapping effect attenuated. From 1988 to 2003, the trapped sediment was 5.10 × 10⁸ t, and the annual sedimentation was 3.4 × 10⁷ t (Zhang et al. Citation2008), indicating a decreased effect of SSL reduction at Lanzhou station. Furthermore, the Longyangxia Reservoir intercepted larger quantities of July−October flow after 1986, and thus July−October flow at Lanzhou significantly decreased. Therefore, an abrupt decrease in Fs occurred in 1986 (see ).
The above discussion implies that the variation in Fs is nonlinear, although the linear correlation coefficient of Fs with time is significant (see ). The variation in Fs can also be fitted by a quartic parabolic regression equation (see ). Due to reservoir regulation, the variation of flow and SSL combination indexed by ξH at Lanzhou station was complicated and can also be fitted by a quartic parabolic regression equation (see ). The curves of Fs and ξH show a ‘mirror image’ relationship. When the ξH curve goes up, the Fs curve goes down, and vice versa. This indicates that the nonlinear variation in ξH due to reservoir regulation resulted in nonlinear variation in Fs.
Fig. 8 Temporal variations in ξH and Fs: (a) scatter plots, and (b) curves fitted by quartic parabolic regression equations.
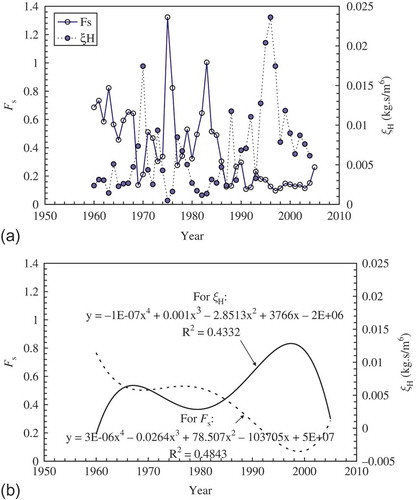
Both the variations shown in and can be used for sediment management purposes. is simpler and shows that a step-like change occurred in 1986, after which the average Fs decreased from 0.556 to 0.168. In the mechanism for Fs change is shown by a comparison between the temporal variation in Fs and in ξH that reflects the sediment-carrying capability of the river. The variation of the two variables is in reverse, indicating that the variation in Fs is dependent on the variation in ξH. Therefore, both and can provide some useful reference tools for sediment management.
5 DISCUSSION and CONCLUSION
5.1 Comparison of results with those in the lower reaches of the Yellow River
The main difference between the results from the lower reaches of the Yellow River reported by Xu (Citation2008) and the results of the present study on the upper reaches is outlined as follows. First, in the present study, it is made clear that the factors and processes that control the variation in Fs are at two levels: the drainage basin level and the channel reach level. At the two levels, the correlation matrix between Fs and the influencing variables is established, and the correlation coefficients of Fs with all the influencing variables are calculated. On this basis, the ranking in terms of the importance of the influencing factors is made, and the influence of these trends on the the trend in Fs is discussed. The results of the latter are more quantitative than the former. Secondly, the treatment of the impact of the dam on Fs is more quantitative in the present study. In Xu’s 2008 study, the impact of the dams was indirectly reflected by dividing the temporal variation of Fs into different sub-periods based on reservoir construction and the changes in its operation mode. In the present study, a number of quantitative indices, such as Rar and Cvr, are adopted to express the impact of dams directly, and the differing effects of different dams are discussed in detail. Under the consideration that the Fs is controlled by the ratio of the river ‘load’ to its ‘carrying force’, Cmean,H and ξH are adopted for this ratio and then related to Fs. In this way the physical meaning behind the phenomenon that Fs decreases may be better reflected. The effects of soil and water conservation are usually quantified by the area (Asw) under these conservation measures (e.g. Wang and Fan Citation2002). In the present study, the natural runoff coefficient (Cnr) is used, considering that the main physical process of soil and water conservation measures is to reduce surface runoff by increasing infiltration. Thirdly, the consideration of climate change in the present study is better. As a very large drainage basin, climate change in the upper and middle parts of the Yellow River basin is different. In Xu (Citation2008), only the changing precipitation was considered, but in the present study, both precipitation (PL) and temperature (TL) are considered. The result shows that the Fs is more closely correlated with TL than with PL in the upper part of the Yellow River basin. As demonstrated by the upper and lower reaches of the Yellow River, the Fs-based method may be used in other rivers in similar geographical settings to provide useful information for river management.
5.2 Suggested countermeasures for restoring the Fs
The enhanced sedimentation in the Lanzhou-Toudaoguai reach due to the decreased Fs has significantly reduced its flood-releasing capacity, especially for ice floods and the question of how to restore Fs becomes an important objective in drainage basin management. Three countermeasures are suggested.
The first is to increase the July−October flow at Lanzhou station. This may be realized by changing the operation mode of the Longyangxia Reservoir by reducing the water storage during the high-flow seasons. In so doing, the flow at Lanzhou station may be increased, and ξH decreased. Therefore, Fs can be increased.
The second is to reduce the amount of water diversion, thereby increasing the sediment carrying ability of the river. To avoid resulting unfavourable effects on agricultural production, water-saving techniques should be enhanced, including techniques for reducing irrigation canal seepage and for increasing the utilizing efficiency of irrigation water.
The third is to introduce some water-saving soil and water conservation measures, namely, when reducing soil erosion the water consumption measures themselves may be reduced, compared with traditional measures. Therefore, the reduction in Cnr may be eased, and the Fs can be increased.
5.3 Conclusions and discussion on countermeasures
An index (Fs) for the sediment transfer function has been introduced, based on the sediment budget at channel scales. Since 1960, the Fs of the Lanzhou-Toudaoguai reach of the Upper Yellow River shows a decreasing trend. The causes have been dealt with at drainage basin and channel levels for the purpose of providing some knowledge for river drainage management. At drainage basin level, the Fs is correlated with precipitation and air temperature and a number of variables describing human activity such as reservoir regulation, water diversion and soil and water conservation. The higher temperature, taken as a natural factor, reduces the transfer function, while the larger runoff coefficient, taken as a human factor, increases the transfer function. At the channel level, the Fs is correlated with a number of variables of flow and sediment inputs. An analysis based on a correlation matrix shows that at the drainage basin level, the three variables related to human activity rank first, second and third respectively, and the two climate variables rank fourth and fifth respectively. At the channel level, reservoir regulation and water diversion greatly changed flow and sediment inputs to the channel and the flow–sediment combination, thereby reducing Fs. Three countermeasures for restoration of Fs are suggested: increasing the July to October flow released from the Longyangxia Reservoir; reducing the amount of water diversion and enhancing water saving irrigation techniques; and introducing some water-saving soil and water conservation measures.
Acknowledgements
All hydrometric data, including precipitation data for 300 raingauges in the study area, were provided by the Yellow River Water Conservancy Commission. The SSL data for relevant hydrometric stations was provided by the Yellow River Commission of Water Conservancy. The water storage capacity of reservoirs, soil and water conservation measures and annual amount of net water diversion data were provided by the Yellow Water Conservancy, and used in the present study with their permission. Data on flows and sediment concentrations in water diversions were provided by the Yellow River Institute of Hydraulic Engineering and Water Resources. Temperature data, from 52 county meteorological stations, were provided by the Chinese State Meteorological Bureau. I am also grateful to two anonymous reviewers, whose comments and suggestions were invaluable in improving the manuscript.
Additional information
Funding
Related Research Data
REFERENCES
- Chien, N. and Zhou, W.H., 1965. Channel processes in the lower Yellow River. Beijing: Science Press. (in Chinese).
- Demaree, G.R. and Nicolis, C., 1990. Onset of sahelian drought viewed as a fluctuation-induced transition. Quarterly Journal of the Royal Meteorological Society, 116, 221–238. doi:10.1002/qj.49711649110.
- Fryirs, K. and Brierley, G.J., 2001. Variability in sediment delivery and storage along river courses in Bega catchment, NSW, Australia: implications for geomorphic river recovery. Geomorphology, 38, 237–265. doi:10.1016/S0169-555X(00)00093-3.
- Hou, S.Z., Wang, P., and Chang, W.H., 2007. Evaluation on the volume of scour and fill of Inner Mongolia section of the Yellow River. Yellow River, 29 (4), 21–22. (in Chinese).
- Hydrological Bureau, Chinese State Ministry of Water Resources, 1965, 1966, 1967. Annual Hydrological Report, P.R. China, Hydrometric Data of the Yellow River (1965, 1966, 1967), Vol. 4. (in Chinese and issued for internal use).
- Jiongxin, X.U., 2003. A study of sediment delivery by floods in the lower Yellow River, China. Hydrological Sciences Journal, 48 (4), 553–566. doi:10.1623/hysj.48.4.553.51416.
- Kendall, M.G., 1975. Rank-correlation measures. London: Charles Griffin.
- Kesel, R., Yodis, E., and McCraw, D., 1992. An approximation of the sediment budget of the lower Mississippi River prior to major human modification. Earth Surface Processes and Landforms, 17, 711–722. doi:10.1002/esp.3290170707.
- Lima Neto, I.E., Wiegand, M.C., and de Araújo, J.C., 2011. Sediment redistribution due to a dense reservoir network in a large semi-arid Brazilian basin. Hydrological Sciences Journal, 56 (2), 319–333. doi:10.1080/02626667.2011.553616.
- Liu, X.Y., Hou, S.Z., and Chang, W.H., 2009. Cause of main channel shrinkage occurred to the Inner-Mongolia reaches of Yellow River. Journal of Hydraulic Engineering, 40 (9), 1048–1054. (in Chinese).
- McLean, D.G. and Church, M., 1999. Sediment transport along lower Fraser River: 2. Estimates based on the long term gravel budget. Water Resources Research, 35 (8), 2549–2559. doi:10.1029/1999WR900102.
- Moraes, J.M., et al., 1998. Trends in hydrological parameters of a southern Brazilian watershed and its relation to human induced changes. Water Resources Management, 12, 295–311. doi:10.1023/A:1008048212420.
- Olive, L.J., et al., 1994. Spatial variation in suspended transport in the Murrumbidgee River, New South Wales, Australia. In: L.J. Olive, R.J. Loughran and J.A. Kesby, eds. Variability in stream erosion and sediment transport. Wallingford: International Association of Hydrological Sciences, IAHS Publ. 224, 241–249.
- Ran, L.S., Wang, S.J., and Fan, X.L., 2010. Channel change at Toudaoguai Station and its responses to the operation of upstream reservoirs in the upper Yellow River. Journal of Geographical Sciences, 20 (2), 231–247. (in Chinese). doi:10.1007/s11442-010-0231-9.
- Shen, G.Q., et al., 2007. Impact of water and sediment regulation by reservoirs in the upper Yellow River on Inner-Mongolia reaches. Journal of Sediment Research, 1, 67–75. (in Chinese).
- Ta, W.Q., Xiao, H.L., and Dong, Z.B., 2008. Long term morphodynamic changes of a desert reach of the Yellow River following upstream large reservoirs’ operation. Geomorphology, 97, 249–259. doi:10.1016/j.geomorph.2007.08.008.
- Tena, A., Batalla, R.J., and Vericat, D., 2012. Reach-scale suspended sediment balance downstream from dams in a large Mediterranean river. Hydrological Sciences Journal, 57 (5), 831–849. doi:10.1080/02626667.2012.681784.
- Trimble, S.W., 1983. A sediment budget for Coon Creek basin in the Driftless Area, Wisconsin, 1853–1977. American Journal of Science, 283, 454–474. doi:10.2475/ajs.283.5.454.
- Walling, D.E., 1983. The sediment delivery problem. Journal of Hydrology, 65, 209–237. doi:10.1016/0022-1694(83)90217-2.
- Wang, G. and Fan, Z. eds., 2002. A study of water and sediment changes in the Yellow River. Vol. 1. Zhengzhou: Publishing House of Yellow River Water Conservancy. (in Chinese).
- Wang, S.J., Fan, X.L., and Zhao, X.K., 2010. Spatial and temporal variations of suspended sediment capacity by erosion or deposition in the Ningmeng Reach of the Yellow River and its influencing factors. Geographical Research, 29 (10), 1880–1887. (in Chinese).
- Xu, J.X., 2008. Temporal variation in downstream sediment transfer in the Lower Yellow River. Zeitschrift für Geomorphologie, 52 (1), 31–45. doi:10.1127/0372-8854/2008/0052-0031.
- Xu, J.X., 2013. Complex response of channel fill–scour behavior to reservoir construction: an example of the upper Yellow River, China. River Research and Applications, 29, 593–607. doi:10.1002/rra.2558.
- Xu, J.X. and Yan, Y.X., 2010. Effect of reservoir construction on suspended sediment load in a large river system: thresholds and complex response. Earth Surface Processes and Landforms, 35, 1666–1673. doi:10.1002/esp.2006.
- Ye, Q.C., 1994. Environmental evolution and laws of water and sediment movement. Jinan: Shandong Publishing House for Science and Technology. (in Chinese).
- Zhang, X.H., et al., 2008. Channel reshaping process induced by reservoir construction on the Yellow River. Zhengzhou: Publishing House for Yellow River Water Conservancy. (in Chinese).
- Zhao, W.L., 1996. The Yellow River’s sediment. Zhengzhou: Publishing House for Yellow River Water Conservancy. (in Chinese).
- Zhao, Y.A., et al., 2008. A study on key techniques for flow and sediment regulation by reservoirs on the upper Yellow River and on the possible adjustment of operational mode of the Longyangxia and Liujiaxia Reservoirs. Research Report of the Yellow River Institute for Water Resources and Hydraulic Engineering, 33685, 1–101. (in Chinese).