
Abstract
Effective policies to protect groundwater-dependent ecosystems require robust methods to determine the environmental flows and levels required to support species and processes. Frameworks to support groundwater management must incorporate the relationships between hydrology and species and ecological processes. These hydro-ecological relationships can be used to develop quantitative, measurable thresholds that are sensitive to changes in groundwater quantity. Here we provide a case study from a group of fens in central Oregon, USA, that are used for cattle watering, but also support numerous sensitive species. We developed quantitative relationships between the position of the water table and wetland indicator plant species and the process of peat development, to propose groundwater withdrawal thresholds. A maximum depth to water table of –0.9 to –34.8 cm for fen plants and –16.6 to –32.2 cm for peat accretion can be tolerated in these wetlands. Defining hydro-ecological relationships as thresholds can support management decisions.
Editor D. Koutsoyiannis; Guest editor M. Acreman
Citation Aldous, A.R. and Bach, L.B., 2014. Hydro-ecology of groundwater-dependent ecosystems: applying basic science to groundwater management. Hydrological Sciences Journal, 59 (3–4), 530–544.
Résumé
Les politiques efficaces de protection des écosystèmes tributaires des eaux souterraines ont besoin de méthodes robustes pour déterminer les flux et niveaux environnementaux nécessaires au maintien des espèces et des processus. Les règles de gestion des eaux souterraines doivent inclure les relations entre l’hydrologie, les espèces et les processus écologiques. Ces relations hydro-écologiques peuvent être utilisées pour établir des seuils quantitatifs, mesurables, et sensibles aux changements des masses d’eau souterraine. Nous présentons ici l’étude d’un ensemble de marais du centre de l’Orégon (USA) servant à l’abreuvement du bétail et abritant également de nombreuses espèces sensibles. Nous avons développé des relations quantitatives entre niveau de la nappe, plantes marqueurs des zones humides et développement de la tourbe, afin de définir des seuils d’exploitation des eaux souterraines. La profondeur maximale de la nappe phréatique acceptable dans ces zones humides se situe entre 0,9 et 34,8 cm pour les plantes des marais et entre 16,6 et 32,2 cm pour le développement de la tourbe. La définition de seuils à partir des relations hydro-écologiques peut contribuer aux décisions d’aménagement.
1 INTRODUCTION
Groundwater is a vital source of water that sustains ecosystems, aquatic species and human communities worldwide. However, rapidly growing demand for groundwater, coupled with declining availability and quality, has pushed groundwater management to a crossroads. The supply and quality of groundwater and the connection of groundwater to ecosystems are increasingly at risk around the world (Millennium Ecosystem Assessment Citation2005). Ensuring a sustainable future for this resource requires that decisions about its allocation and protection fully integrate the needs of both human and ecological communities.
Groundwater-dependent ecosystems (GDEs) include wetlands, lakes, rivers, springs, estuaries and off-shore marine environments, subterranean ecosystems and some terrestrial vegetation such as phreatophytes, as well as the many species that rely on groundwater to meet part or all of their water requirements (Eamus and Froend Citation2006, Brown et al. Citation2011, Sinclair Knight Merz Citation2011). In these ecosystems, groundwater may provide water with physical and chemical characteristics that differ from surface water supplies, and this has important consequences for their structure and function. Owing to their unique water and chemical characteristics, GDEs often harbour many rare and endemic species (Stevens and Meretsky Citation2008, Blevins and Aldous Citation2011), as well as provide critical ecosystem services including water storage, supply and purification. Impacts to the quantity, timing and quality of groundwater discharge to these ecosystems have significant consequences to their persistence and viability. To protect GDEs and the goods and services they provide, the water needs of GDEs must be integrated into groundwater management policies.
Over the last two decades, provisioning of groundwater for aquatic ecosystems, including GDEs, has been expressly included in the laws and policies of a number of countries including South Africa, New Zealand, Australia and countries of the European Union, as well as in the water laws of some US states (Aldous and Bach Citation2011). Accompanying these policies are a number of proposed frameworks for protecting the groundwater supply and quality to dependent ecosystems (Colvin et al. Citation2004, Eamus et al. Citation2006, Howe and Pritchard Citation2007, Sinclair Knight Merz Citation2011), and some countries are making progress towards populating those frameworks (Schutten et al. Citation2011, UK TAG Citation2012). However, in most instances, groundwater allocations for environmental purposes have focused on supporting in-stream and riparian conditions in river ecosystems rather than lentic GDEs (Wood et al. Citation2001, Murray et al. Citation2003, MGCAC Citation2007, Danielpol et al. Citation2008).
The emphasis on rivers is due in part to the technical advances made in the science of environmental flows for rivers. It is now widely recognized that the health of river ecosystems depends on providing key components of the natural flow regime (e.g. Poff et al. Citation1997), and protection of environmental flows has received worldwide attention (Postel and Richter Citation2003). Numerous methods have been developed to define environmental flows and flow standards for rivers (Acreman and King Citation2003, Tharme Citation2003, Acreman and Dunbar Citation2004, Poff et al. Citation2010). Despite this work, limited attention has been given to the broader range of environmental water needs, in particular the environmental flows and levels required to sustain the structure and function of non-riverine GDEs.
To support policy implementation that will protect the full suite of GDEs, more work is needed in two key areas. First, there is a need for a robust, scientifically defensible methodology for setting environmental flows and levels for GDEs that is straightforward to implement, monitor and adapt to a variety of scales and hydrogeologic settings. Second, that methodology must be populated with technical information on the water requirements of GDEs, termed hydro-ecological relationships, and their responses to changing groundwater flows and levels (Sophocleous Citation2007). In particular, there is a need for quantitative thresholds to be defined for these hydro-ecological relationships, which can be used in management and policy contexts for setting environmental flows and levels.
Here we focus on the need to describe how hydro-ecological relationships can be developed and used to populate environmental flows and levels methodologies. Specifically, we identify examples of some key hydro-ecological relationships for groundwater-dependent wetlands (fens) and then we present a case study of setting thresholds for two of those relationships.
2 HYDRO-ECOLOGICAL RELATIONSHIPS
The science of hydro-ecological relationships is inherently the basic science of the interactions between species and ecosystem processes critical for those species and their hydrologic environment. To date, much hydro-ecological research has focused on the relationship of river species and ecosystems to streamflow or flow alteration (Dunbar and Acreman Citation2001, Poff and Zimmerman Citation2010). Considerable research also has focused on the relationships between wetland plants, particularly phreatophytes, and shallow groundwater hydrogeology (e.g. Loheide and Gorelick Citation2007, Gasca and Ross Citation2009, Chui et al. Citation2011). However, for other types of GDEs and other hydro-ecological relationships, research is more limited, and there are critical data gaps (Tomlinson Citation2011). This difference in data availability is important from a management context; the most robust and well-studied relationships are easiest to use to populate environmental flows and levels methods.
The nature of groundwater hydro-ecological relationships is related to key characteristics of the groundwater flow system. Groundwater interacts with freshwater and estuarine species and ecosystems in ways that differ from surface runoff-dominated flows. The rate of groundwater discharge to an ecosystem is often lower than that of surface runoff and therefore contributes a smaller portion of the annual water budget. However, the distinct timing and chemistry of the groundwater contribution may lead to ecosystem effects that are disproportionate to its total volume. Water levels in GDEs are relatively static, particularly where ecosystems are fed by longer flow paths, which results in more muted seasonal water level fluctuations as expressed in wetland hydroperiods or stream hydrographs. There is a longer lag time between precipitation events or snowmelt and discharge to the ecosystem, which may buffer GDEs from extreme climatic events compared to surface runoff-dominated ecosystems. Groundwater temperature and chemistry often differ from surface water sources, reflecting recharge elevation and geological characteristics of the aquifer. These aspects of groundwater hydrology have important implications for the biodiversity of GDEs and are integral to the development of hydro-ecological relationships.
For hydro-ecological relationships to be useful in developing, implementing and monitoring groundwater allocations to ecosystems, they need to meet a variety of criteria. They must be easily measured using established, defensible methods and appropriately sensitive to groundwater alteration; and the ecological response threshold to the groundwater flow system must be relatively well understood (Murray et al. Citation2003). Here we focus on the specific hydro-ecological relationships for fens that could be used in a management context to set thresholds to groundwater alteration.
2.1 Hydro-ecological relationships of fens
Fens are peatlands with a continuously high water table, more than 40 cm of peat soil and water chemistry reflecting the minerology of the source groundwater or surface water (National Wetlands Working Group Citation1988, Bridgham et al. Citation1996). Plant species distributions in fens are a function of various physical gradients in groundwater depths and fluxes and chemistry (Bridgham et al. Citation1996, Hajkova et al. Citation2004, Wheeler et al. Citation2004), and these gradients can be used to set thresholds to groundwater alteration based on hydro-ecological relationships. Numerous studies report that fen species respond to the maximum depth of the water table below the ground surface over the course of the growing season, generally reported in the ecological literature as positive if the water table is aboveground and negative if it is belowground. To support representative fen plants, a maximum summertime depth of the water table between –20 and –30 cm has been reported for calcareous fens in the United Kingdom (Wheeler et al. Citation2004), marl fens in Estonia (Ilomets et al. Citation2010), Rocky Mountain fens in California, USA (Weixelman and Cooper Citation2009), midwestern fens in Iowa, Wisconsin, Illinois, and Ohio, USA (Amon et al. Citation2002), calcareous mires in Colorado, USA (Johnson and Steingraeber Citation2003), spring fens in the Czech Republic (Hajkova et al. Citation2004), peatlands in central Alberta, Canada (Karlin and Bliss Citation1984) and kettle hole fens in New York (Drexler et al. Citation1999, Godwin et al. Citation2002).
The metric of maximum depth of the water table is most commonly seen in the literature, because it can be reported with a limited number of measurements. However, fen plants may respond to gradients or variation defined at a greater level of detail, which are evident only from a more extensive data set. Examples include the duration of initial growing season saturation (Duval and Waddington Citation2011, Duval et al. Citation2012), seasonal water table fluctuations (Drexler et al. Citation1999, Ilomets et al. Citation2010) and gradients in hydraulic head (Schutten et al. Citation2011). What is common to all of these cases is that the plants are responding to cues associated with saturation in the rooting zone.
An appropriate choice of metric depends on natural variation in saturation and the type of management action that might affect that variation. The extent of variation in fen hydroperiod is a function of its hydrogeologic setting. A fen whose water balance is dominated by a constant source of deeper groundwater is likely to have a highly stable hydroperiod (e.g. Johnson and Steingraeber Citation2003) compared to a fen receiving a combination of ground- and surface water and growing season precipitation (e.g. Duval and Waddington Citation2011, Duval et al. Citation2012). This subtle variation in fen hydrology indicates that drawdown thresholds may differ depending on the fen’s hydrogeologic setting.
3 CASE STUDY: USING HYDRO-ECOLOGICAL RELATIONSHIPS TO DETERMINE GROUNDWATER THRESHOLDS FOR ARID MONTANE FENS
In the following case study, we describe how hydro-ecological relationships can be used to make a management decision related to groundwater use that affects groundwater-dependent wetlands. We used multiple hydro-ecological relationships (both species and ecosystem process) to set quantitative thresholds to groundwater alteration.
3.1 Methods
3.1.1 Site overview and management context
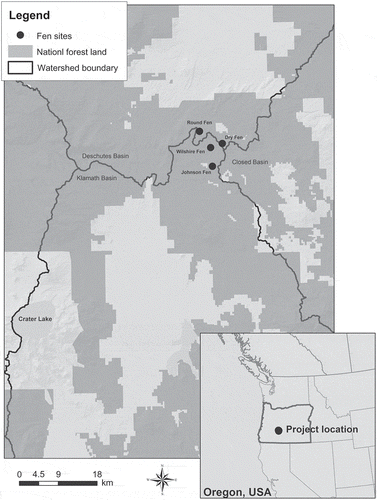
The study was conducted in the Fremont-Winema National Forest, Oregon, USA, where there are numerous small fens spanning the watershed divide of the Klamath, Deschutes and Closed basins (). The area contains a 31 500-ha cattle grazing allotment, for which the US Forest Service is currently revising the allotment management plan (US Forest Service 2012). This plan addresses all aspects of grazing management, including the locations, amounts and timing of groundwater withdrawal.
Fig. 1 Map showing the four study sites at the boundary of the Klamath and Deschutes surface water basins. Crater Lake, the original source of pumice underlying the fens, is seen in the southwest corner of the map.
Some of the fens are used as water sources and contain shallow wells used to pump groundwater to supply cattle watering troughs located outside the fen boundaries. Livestock grazing is the main stress on the fens, as the grazing allotment is in a remote area. A groundwater pump test performed in one of the fens in 2010 demonstrated that current pumping rates did not result in measurable water table drawdown in adjacent piezometers (Aldous et al. 2014). As part of the management plan revision, the Forest Service sought to understand how much additional groundwater could be pumped from these wetlands without altering the overall ecological condition of the fens, as well as the viability of a number of species of special concern.
To answer this question, four fen study sites, ranging in size from 0.2 to 0.4 ha, were selected at elevations ranging from 1644 to 1712 m a.s.l. The fens have developed at points of groundwater discharge from flowpaths that were estimated to recharge approximately 10 km away, based on CFC (chlorofluorocarbon) age dating that indicates the discharging groundwater is 30–35 years old (Aldous et al. 2014). The sites are in good ecological condition with a relatively intact native plant community, and they are fenced from direct cattle impacts, even though they do include wells used for cattle water supply. Data that compare the shallow groundwater chemistry in these fens with another, similar fen with no grazing in the watershed showed that nutrient concentrations in shallow groundwater are not elevated as a result of grazing. No forms of nitrogen (TN, NO3–, NH4+) or phosphorus (TP, PO43–) were significantly different among the sites (Aldous et al. 2014).
The site climate is semi-arid (), with cool wet winters and hot dry summers, and little precipitation falling during the growing season. The area is underlain by late Miocene and Pliocene basalt to rhyolite lava flows, rhyolite domes and silicic ash-flow tuff (McLeod and Sherrod Citation1992). Pumice deposits from the eruption of Mount Mazama 7700 years ago overlie the area to a depth of 2–3 m (McLeod and Sherrod Citation1992). Hydric organic soils developed on the pumice deposits and are described as part of this study.
Table 1 Precipitation data from two nearby weather stations with different periods of record (POR). Data are reported for the entire POR for the two climate stations, as well as individually for the years of this study. Chemult (elevation 1478 m; Natural Resources Conservation Service Citation2012) is 14 km to the west and Timothy (elevation 1835 m; Western Regional Climate Center Citation2012) is 20 km to the east of the fen study sites ().
The first step to answering the management question identified above is to quantify the key groundwater hydro-ecological relationships for the fens and identify thresholds of changes in species and ecological processes. This information can then be used to identify environmental flows and levels for the site and set limits to water withdrawal.
3.1.2 Hydro-ecological relationships
We identified and quantified two groundwater hydro-ecological relationships in these sites: the groundwater depth requirements of vascular herbaceous and bryophyte plant species and the relationship between groundwater depth and the process of peat accretion. For the former, there is a large and robust literature quantifying the water depth adaptations of many different peatland plant species (e.g. Amon et al. Citation2002, Duval and Waddington Citation2011), and the response time of wetland plants to water depth change is relatively rapid (i.e. one to several years). Several studies have taken advantage of the close relationships between wetland plants and depth to groundwater in setting groundwater management objectives (e.g. Loheide and Gorelick Citation2007, Colvin et al. Citation2009, Gasca and Ross Citation2009, Chui et al. Citation2011, Zhang et al. Citation2011). In general, these studies quantify or model the relationships between wetland hydroperiod and plant community composition or plant physiological response and ultimately show a seasonal range in water table depths over which individual species grow. In the majority of cases where the management issue is groundwater abstraction, the key driver is the maximum depth to water table that the species in question can tolerate. Therefore, we used the hydro-ecological relationship of maximum depth to water table (hereafter maximum depth) for a suite of indicator species to identify water table drawdown thresholds that will inform environmental flows and levels.
In comparison to the relatively rapid response time of wetland plants to water levels, peat development is slow and its relationship to water levels may be measured on timescales of centuries to millennia. Nevertheless, the maintenance of organic soils is critical to the character, species diversity and ecosystem services in these wetlands. Models of peat development in the Holocene explicitly incorporate peat accretion in relation to hydrologic factors (Childs and Youngs Citation1961, Ingram Citation1982, Clymo Citation1984, Belyea and Baird Citation2006, Frolking et al. Citation2010). Central to these models is the assumption that a peatland has two main strata: an upper oxic acrotelm where the majority of biological activity takes place and a lower, anoxic catotelm where lower rates of biological activity make this the zone of peat storage (Clymo Citation1984). The boundary between acrotelm and catotelm is hard to measure, and so it is functionally defined as the maximum depth to the water table (Childs and Youngs Citation1961, Ingram Citation1982, Belyea and Baird Citation2006). This implies that biological activity, including differential rates of production and decomposition among plant species, is tightly coupled with hydrologic parameters, particularly the position of the water table. Based on this, we assume that lowering the water table below the summer maximum depth will lead to changes in biological activity in the acrotelm that are significant enough to increase decomposition in the catotelm (Belyea and Clymo Citation2001).
Measuring the relationship between groundwater depths and peat development for management purposes is complicated. Thus, we took two approaches. First, we quantified the relationships between the current position of the water table and the peat deposits. Second, we used the summer maximum depth as a surrogate for the boundary between the acrotelm and catotelm, assuming that the maintenance of the water table above this level is a threshold for sustaining the process of peat accumulation. Moreover, because the water balance for these sites during the growing season is dominated by groundwater discharge, we assumed the water table over the timescale of decades is relatively stable, and therefore, this relationship can be measured accurately with three seasons of field data. These approaches are not entirely independent because they use overlapping data sets.
Fen hydrology also leads to the development of chemical gradients to which plants commonly respond (Bridgham et al. Citation1996). These gradients arise from the chemistry of the inflowing groundwater, reflecting the aquifer’s mineral content, with notable examples including calcareous or serpentine wetlands. They can also result from hydroperiod variation causing cycles of anoxia, production of organic acids and other redoximorphic features. The relationships between plant species and these chemical gradients can be disrupted by groundwater contamination or alteration and so could be used to develop management thresholds. However, in this case, the major potential stress to the fens is from groundwater abstraction; therefore, our study focused on the hydro-ecological relationships related to groundwater withdrawal.
3.1.3 Instrumentation
To quantify the hydro-ecological relationships, we related fine-scaled measurements of the depth of the water table (with respect to the ground surface) to plant species composition and peat depths. To measure the depth of the water table, we installed two types of piezometers, each described below. We then monitored vegetation plots associated with one type of piezometer and peat depths associated with the other. It was not possible to measure both for each piezometer because measuring peat depths would disrupt local vegetation.
To relate depth of the water table to plant species composition, in 2010, we installed parallel transects of piezometers spaced roughly 10 m apart, running perpendicular to the slope of the water table, which followed the topographic gradient. Most of each transect was within the fen boundary, with a portion of each extending into the surrounding upland to capture the wetland/upland transition. Vegetation plots (50 cm × 50 cm) were installed along each transect, approximately 5 m apart, and each transect contained a slightly different number of plots (). Solinst™ schedule 40 PVC piezometers, 2-cm internal diameter and factory screened over their below-ground length, were installed in one of the corners, to a depth of 60 cm. These are referred to as “small piezometers” and were installed entirely within the peat soil, with the exception of upland plots where surface soils were mineral, not organic.
Table 2 Numbers of transects, plots and piezometers at each site.
To relate water table depth to peat depth, in 2009, we installed 5-cm-diameter piezometers (here called “large piezometers”) in the peat in a grid across three of the fens (). Round Fen was included as a study site only in 2010 and therefore did not have any large piezometers. These piezometers were schedule 40 PVC water table wells that were factory screened over the entire below-ground length (90 cm) and pushed or pounded into the peat layer (Sprecher Citation2008). The large piezometers were adjacent to piezometers screened at different depths to measure hydrogeologic characteristics of the fens (not discussed here). All piezometers (large and small) were monitored manually using a Solinst™ 102M mini water-level meter (1 mm accuracy) from June 2009 to October 2011 (large piezometers) and May 2010–October 2011 (small piezometers). No data were collected over the winter (December–April) because snow limited access in this remote area. To minimize the potential effect of peat compression and associated changes in water levels in the wells, we stood on long (~2 m) wooden boards placed adjacent to the piezometers when measuring water levels. We surveyed the elevations of all piezometers and plots at each site using a transit level and used survey data to calculate water levels in the fens. We also measured the height aboveground of all piezometers each time the water levels were measured to ensure the piezometers had not moved vertically in the peat between sampling. Movement occurred only over the winter and only for the small piezometers that were not installed in the mineral substrate underlying the peat. Piezometers that moved were re-installed in the peat and re-surveyed.
In July 2010, we recorded all plant species by percent cover in each of the plots (vascular plants and bryophytes). We characterized the soil, including horizons and their depths, with a hand-augered soil core (AMS 8-cm-diameter mud auger) adjacent to each of the large piezometers. We also collected three cores at Round Fen even though this site did not have any large piezometers. Special attention was paid to the occurrence and maximum depth of organic peat soils. Cores extended to the palaeosol and/or assumed bedrock (a depth of 2–3 m) except in situations where soil properties (stoniness or loose consistency) prevented soil extraction with an auger. Although we originally intended to collect peat depth information at each plot in the series of transects, we were not able to identify an accurate, non-destructive method to do this; therefore, we relied on the smaller sample size of 7–8 cores per site associated with the large piezometers.
In addition, we installed one piezometer per fen in the upland area 10 m upgradient from each fen (US Forest Service unpublished data). These piezometers ranged in depth from 3 to 5 m and were screened in the underlying pumice. We used data from these piezometers to compare the soils and groundwater depth data within the fen to upland areas outside the fens with no peat soils. Piezometric head data for the uplands were available for four dates between 2 July and 4 November 2011.
3.1.4 Vegetation-hydrology data analysis
For each plot and date, we calculated the depth of the water table with respect to the ground surface in the small piezometers. Outliers were identified and removed by examining residuals in a 1-way analysis of variance (SAS 9.2 Citation2012). We then calculated the mean, minimum and maximum depth to water for each plot over the course of the growing season.
Seventy-five species were identified in the plots, consisting of 11 mosses, one liverwort and 63 vascular plants. For this study, indicator species were defined as widely distributed (i.e. occurring in at least three of the four sites), common within a site (i.e. occurring in at least 10 plots in each site), with federal wetland indicator status (US Army Corps of Engineers Citation2012). A total of 17 species met all of these criteria ().
Table 3 Indicator species mean, maximum and the 75th percentile of maximum depth to water table. N refers to the number of plots in the study sites in which that species occurred, or the number of papers where we found published data. The first five species are bryophytes and the remaining species are vascular plants. A negative value indicates the depth to water table is below ground; a positive value indicates it is above ground. Species in bold ultimately were deleted from the final indicator list because they grow across a range of wetland types with different hydrologic regimes and thus are poor indicators for fen hydrology.
Once the indicator species were identified, they were assigned water depth metrics using data from the plots in which they occurred. For each of the indicator species, its “mean depth metric” value was an average of the mean depth to water table for the plots in which it occurred. Its “min depth metric” and “max depth metric” values were the highest of the minimum values (most shallow) and lowest of the maximum (deepest) values for the plots in which it occurred, respectively (). The result is a mean water table depth and range for each species that reflects the full range of “micro-hydrologies” where it grows in these sites. Based on the concepts described above, the maximum depth metric is used as the basis for defining thresholds. By extending transects from the fen into the upland, we captured the full range of micro-hydrology for each species.
We supplemented our site-based data with data from the published and grey literature of depth to water table for these same species in other wetlands. Sub-species were lumped to obtain one value for each species. We used literature values to create a more robust data set that can help inform the range of tolerances in depth to water table, as well as help extend the relevance of the results to a broader area. To identify papers and reports, we conducted web searches (both Google and Google Scholar), searched our own literature database, used data sets we have collected in the past and contacted individual scientists for unpublished data. We identified 31 additional data sets.
To identify thresholds in depth to water table, we adapted an approach currently under development in the European Union in the implementation of the Water Framework Directive (Schutten et al. Citation2011, UK TAG Citation2012). We define the threshold value as the 75th percentile of the maximum depth to the water table, implying a management goal of maintaining the water table above that value. The European approach involves setting thresholds using logistic regression of poor quality vs high quality sites; however, since we sampled only high quality sites, we were not able to use the complete approach. This method takes a precautionary approach by setting the threshold higher than the maximum water table depth over which the species are found.
3.1.5 Peat-hydrology data analysis
We developed peat-hydrology thresholds in two ways. First, for each of the large piezometers, we calculated the mean, minimum and maximum depth to the water table for the 3-year period of data, after removing outliers as described for the small piezometers. We performed regression analysis of peat depth on mean, minimum, maximum and range in depth to water table after log transforming all variables to meet regression assumptions. Second, we estimated the boundary between acrotelm and catotelm using the summer maximum depth to the water table. The years for which we have field data (2009–2011) represent average conditions compared to the last 50 years recorded at two nearby weather stations (). Therefore, we combined the water table data sets from both small and large piezometers for all sites and all years to identify the summer maximum depth, which forms the basis for a threshold for sustaining peat accumulation processes. Similar to the vegetation data, we calculated the 75th percentile of the maximum depth for all piezometers with peat, with the goal of maintaining the water table above that value.
3.2 Results
3.2.1 Water table variation
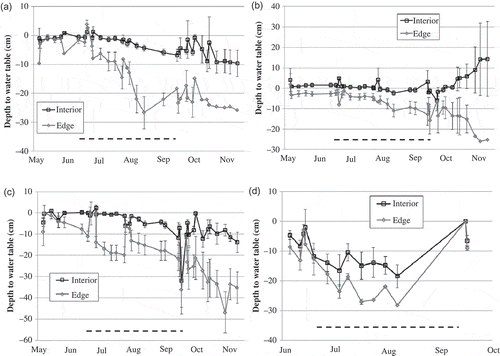
Water levels in the small and large piezometers were high in the spring and fell through the summer, with piezometers less than 2 m from the edge of the fen/upland boundary having a much greater decline than those in the interior (). Even among piezometers within the interior or along the edge, spatial variation in water table drawdown increased in the late summer and fall, reflecting microtopography within each fen. The water tables at the interior piezometers rarely dropped below –20 cm. Those same interior piezometers were also the only ones to have measured discharge (upward head gradient), based on head comparisons with adjacent piezometers screened at greater depth in the peat (data not shown). These data indicate that groundwater discharge into the interior of the fens leads to high sustained water tables throughout the season.
Fig. 2 Wetland hydroperiods for the four study sites. Data are means of small and large piezometers at each site, grouped according to distance from the edge of the fen (<2 m = “edge”; >2 m = “interior”), with error bars showing one standard error, for the years 2009–2011. The dark hashed line at the bottom of each plot shows the livestock watering season (July–September). Note that each y-axis has a slightly different range. (a) Wilshire Fen; (b) Johnson Fen; (c) Dry Fen; (d) Round Fen.
3.2.2 Vegetation-hydrology thresholds
Micro-hydrology data for the 17 indicator species are shown in . The majority of indicator plants are found in plots where the maximum depth to water table is –20 cm. However, there is a skewed distribution towards lower water tables, as well as a small number of outlier occurrences, which indicate that some of these species can tolerate water table depths down to –70 cm (e.g. Carex aquatilis).
In many cases, data from the literature show a relationship between vegetation and the water table that is similar to the one we measured in the study fens. However, in all cases, literature values showed a greater range in lower water tables than our field data indicated. This is expected from a one-time sampling effort. Some of these species are also found in seasonal meadows and other wetlands with a greater hydroperiod range, including Philonotis fontana var americana, Sphenosciadium capitellatum and Vaccinium uliginosum. These species were eliminated from the final list of indicator species because they are not adequately sensitive to changes in the position of the water table. Interestingly, none of the data from the literature showed species having greater tolerance to flooding (higher water tables) than our field data. The final range in 75th percentile maximum depth to water table (excluding the three species listed above) is –0.9 to –34.8 cm.
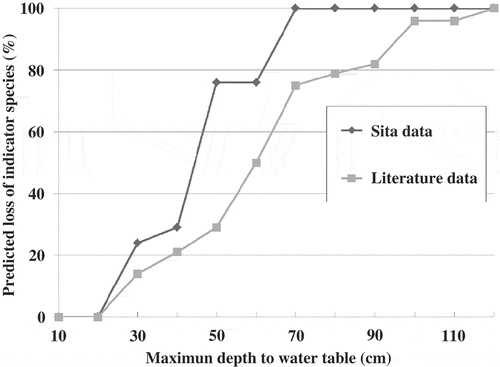
We estimated cumulative species loss at increasing maximum depth to water table, assuming that if a particular species was not found at those lower water tables, it cannot tolerate those conditions (). From our data, species losses began at maximum depths greater than –20 cm, and all indicator species are lost at depths greater than –70 cm. That threshold is somewhat lower (–115 cm) once data from the published literature are incorporated.
Fig. 3 Predicted cumulative loss of indicator species at increasing maximum depth to water table. Data from the current study are plotted separately from data summarized from the literature.
3.2.3 Hydro-ecology–peat accretion
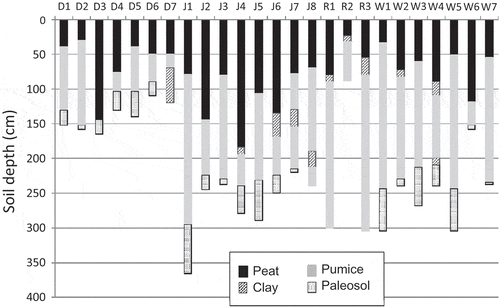
Auger holes in the fens show a consistent stratigraphy across the study area (). The surficial layer is peat in varying states of decomposition from fibric peat at the surface to more hemic and occasionally sapric peat at depths ranging from –30 to –185 cm. Below that is pyroclastic ash and pumice from 20 to 210 cm in thickness. A narrow black, mucky layer at the top of the pumice deposit was sometimes observed, creating a leaky confining layer and sometimes artesian conditions. This was interpreted as a palaeosol, under which is fractured basalt. The four sites followed this same general pattern; however, there was significant variation within and among sites. In particular, soil depth to bedrock at the Dry site (mean = –140 cm) was much less than that at the other three sites (mean = –231 to –266 cm) (). Overall, the peat depths are relatively shallow; however, these fens likely started to accumulate peat only after the most recent pyroclastic eruption 7700 years ago, whereas many studies of peatland development on post-glaciation indicate surfaces are 10 000–12 000 years old. Immediately outside the boundary of each fen, the auger boring data show a small organic horizon (<5 cm), but no peat.
Fig. 4 Stratigraphy of augered cores at each site. Letters across the top indicate the site from which the cores were taken: D: Dry, J: Johnson, R: Round, and W: Wilshire. Total core length represents depth to bedrock, which varied within and among sites.
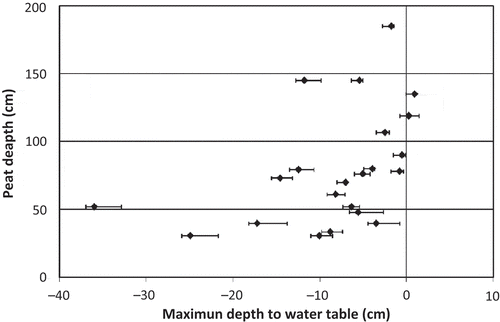
Peat has developed where the maximum depth to water table is less than –40 cm throughout the growing season (). For the upland piezometers, where there was no peat, depth to water ranged from –80 to –160 cm. Peat depths showed statistically significant, positive relationships with the mean depth to water table (, r2 = 0.27, p = 0.01, N = 23), as well as the maximum (r2 = 0.29, p = 0.01, N = 23; data not shown) and minimum (r2 = 0.20, p = 0.03, N = 23; data not shown) depths to water table, indicating that more peat accumulates where the water table is higher. Peat depth also showed a statistically significant negative relationship with the range in depths to water table, with more stable water tables having deeper peat deposits (r2 = 0.16, p = 0.06, N = 23). This result can be seen in , where lower peat values are associated with greater ranges in depth to water table. The depth to the water table has low explanatory power, possibly due to the low sample size in comparison to spatial variation in microtopography.
Fig. 5 Peat depths plotted against maximum depth to the water table. The x-axis error bars are 1 standard error of the maximum depth to the water table at each large piezometer.
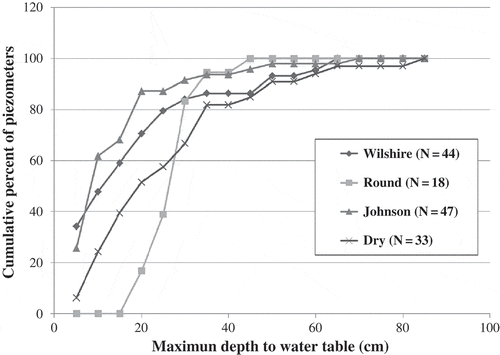
In a second approach, we summarized all annual maximum depth to water table data for the four fens as a surrogate for a peat accretion or maintenance threshold. shows the cumulative percent of piezometers with maximum depth to water table at increasing drawdown. These data show the summer maximum water table ranges from –5 to –85 cm, but the majority fall within the range of –10 to –40 cm. The 75th percentile values for maximum depth to water were –16.6 cm (Johnson Fen), –22.0 cm (Wilshire Fen), –32.2 cm (Dry Fen) and –29.6 cm (Round Fen).
Fig. 6 Cumulative percent of piezometers with measured maximum depth to water table.
4 DISCUSSION
Any programme with the overall goal of protecting GDEs must include methods and procedures for identifying and mapping GDEs, identifying and quantifying their threats and allocating adequate high quality groundwater to support species and ecological processes. The last decade has seen significant progress in many of these tasks. There are various methods for identifying and mapping GDEs and understanding their threats (Brown et al. Citation2011, Australian Bureau of Meteorology Citation2012), and current groundwater assessment frameworks provide broad guidance on identifying GDEs and describing their groundwater requirements (Schutten et al. Citation2011, Sinclair Knight Merz Citation2011, UK TAG Citation2012).
In addition to these overarching frameworks, there is a growing understanding among scientists and managers of the importance of the groundwater regime to ecological systems, including discharge rates and directions, water levels, groundwater chemistry and associated changes over space and time. However, quantification of specific hydro-ecological relationships lags behind the surface water field, particularly in non-riverine GDEs. In many cases, there is a core of basic science that can be used to monitor change in groundwater flows, levels and quality. The challenge, therefore, is to take that basic science and translate it into thresholds that are scientifically robust, measurable and responsive to change and that can be used to make management decisions.
Here we provide an example of identifying a groundwater drawdown threshold based on the hydro-ecological relationships of fen indicator species and the process of peat accretion. The most tolerant plant species appear to be able to withstand maximum water table depths of –70 to –100 cm, but species losses are expected to begin at maximum depths of –20 cm. The peat data indicate that deposits are only present where the maximum depth to water table is shallower than –40 cm, but most of the piezometers with peat deposits have water tables that remain above –20 cm. This corresponds to the summer maximum water table depth as a measure of the acrotelm–catotelm boundary. Using the 75th percentile approach, thresholds are –0.9 to –34.8 cm for fen indicator plants, depending on the species, with bryophytes being somewhat more sensitive than vascular plants. For the process of peat accretion, thresholds were –16.6 to –32.2 cm, depending on the site.
This range in thresholds is similar to what has been reported for peatlands in many parts of the world. Vegetation shifts from sedges to shrubs and trees were reported for Minnesota peatlands when the depth to water table increased from –5 cm to –25 cm by drainage (Verry et al. Citation2011). The proper functioning condition framework of Weixelman and Cooper (Citation2009) stipulates that the water table for fens in the mountains of California be ±20 cm of the soil surface for most of the summer. A maximum water table depth of –40 cm was proposed for managing carbon emissions from palm oil plantations cultivated on peatlands in Indonesia (Sabiham et al. Citation2012). A 30-cm decline in the water table from the ground surface in Dutch fens was shown to promote nutrient mobilization, a process known as internal eutrophication (Verhoeven et al. Citation1993).
In this study, we present the water table depth tolerances and potential thresholds as ranges rather than one absolute number because the water level drawdown that ultimately will be managed is a societal, management and legal question rather than a technical one (Tomlinson Citation2011). It is likely that if pumping from the pumice underlying the peat lowers the water table in the peat, any amount of water table decline will lead to changes in species’ physiological responses and ecosystem processes (e.g. Drepanocladus aduncus has a 75th percentile threshold of –0.9 cm). For example, carbon cycling is tightly linked to the position of the water table (Limpens et al. Citation2008) and carbon fluxes, which control peat accretion and decomposition, start to change at any amount of drawdown (Moore and Knowles Citation1989, Kim and Verma Citation1992). The challenge is to recognize the difference between subtle changes in physiological and biogeochemical responses and thresholds of major shifts in ecosystem structure and function. In the examples above, the lower (more negative) thresholds describe the depth below which potentially irreversible changes in ecosystem processes and functions occur. Above this depth, but below the upper threshold, there may be loss of some species and ecosystem processes, and it will be up to managers and the public to decide the amount of acceptable change. In this case, if the water table remains above –20 cm, ecosystem processes and functions will mostly be protected, but the most sensitive species may be lost.
In this case study, the species used to develop water table depth thresholds had slightly different responses, from bryophytes that grow over relatively narrow ranges to some of the Carex species that are more tolerant of desiccation. This inherent variability suggests the need for, and value of, using multiple hydro-ecological relationships in the development of environmental flows and levels requirements, as opposed to single species management that often occurs in regulatory contexts, and for promoting the requirements of the most sensitive species in groundwater management.
This approach to setting limits to groundwater abstraction based on hydro-ecological relationships has its limitations in applications to other systems that might include other stresses. Here we assume that the hydrologic regime is the primary driver of ecological processes and that it is the main process that will be stressed with livestock water abstraction. This ignores other potentially limiting variables such as nutrients or temperature, which may be important and stressed in other basins. Because of the time scale of our study, we were not able to include a longer temporal factor in our analysis, although time lags may be common, either in the development of the cone of depression after the start of pumping or else in the ecosystems’ responses to drawdown (Sophocleous Citation2007). GDEs also may tolerate lower water table depths at some times of the year more than others, but in this case, the timing of water withdrawal corresponds to approximately the midpoint of the recorded hydroperiod (). Thus, managing for growing season water table requirements was appropriate. In most cases, both societal and ecological groundwater needs will correspond to drier times of the year, thus assuming that the water table drawdown from pumping should not extend below the lowest point of the hydroperiod is a safe assumption.
We show here how the basic science of fen peatlands can be used in a management context, following the criteria outlined in the introduction. The hydro-ecological relationships we used in setting the range in water depth thresholds were measured easily: sensitive to groundwater alteration and grounded in peatland science. We were able to take advantage of two fields of research for which there is a large body of literature: the relationships between the depth of the water table and (1) wetland plants and (2) peat development. For most GDEs, including fens, we are just beginning to study and understand these hydro-ecological relationships, and site-specific data sets are limited. By supplementing these data with information from the literature, we are able to provide the best available information to decision-makers, who are often working at scales that go well beyond the site level. Even less information is available for other types of GDEs that might be affected by groundwater management; thus, there is a need to improve our understanding of the hydro-ecological relationships between groundwater and GDEs in a variety of settings. If we are to realize increased protection of GDEs, these relationships must be defined and communicated in a way that will be useful to water managers and decision makers in setting environmental flows and levels and ultimately determining environmental water provisions for GDEs.
Acknowledgements
Many individuals contributed to this project. We especially thank staff from the US Forest Service, including Trish Carroll, Joe Gurrieri, Chris Carlson, Mike Neville, Daryl Gusey, Roger Congdon, Amber Lidell and Rick Dewey. Many others also contributed to field data collection and analysis, including John Christy, Tom Josephson, Emilie Blevins, Nathan Rudd and Xavier Comas. Emilie Blevins provided tremendous support in researching some of the details of this article. The comments of two anonymous reviewers significantly improved this article.
Funding
This work was supported by the Northwest Conservation Fund of the Priscilla Bullitt Collins Trust.
Related Research Data
REFERENCES
- Acreman, M.C. and Dunbar, M.J., 2004. Defining environmental river flow requirements—a review. Hydrology and Earth System Sciences, 8 (5), 861–876. doi:10.5194/hess-8-861-2004
- Acreman, M.C. and King, J., 2003. Defining water requirements. In: M. Dyson, G. Berkamp, and J. Scanlon, eds. Flow: the essentials of environmental flows. Gland: IUCN.
- Aldous, A. and Bach, L., 2011. Protecting groundwater-dependent ecosystems: gaps and opportunities. National Wetlands Newsletter, May–June, 19–22.
- Aldous, A. R., et al., 2014. Environmental flows and levels for groundwater-dependent fens of the Antelope Grazing Allotment, Fremont-Winema National Forest, Oregon. Portland, OR: The Nature Conservancy and the USDA Forest Service.
- Amon, J.P., et al., 2002. Temperate zone fens of the glaciated midwestern USA. Wetlands, 22 (2), 301–317. doi:10.1672/0277-5212(2002)022[0301:TZFOTG]2.0.CO;2
- Anderson, M.D., 2008. Carex rostrata, C. utriculata. In: Fire effects information system [online]. Fire Sciences Laboratory, Rocky Mountain Research Station, US Department of Agriculture, Forest Service. Available from: http://www.fs.fed.us/database/feis/ [Accessed 17 October 2011].
- Andrus, R., Wagner, D., and Titus, J., 1983. Vertical zonation of Sphagnum mosses along hummock–hollow gradients. Canadian Journal of Botany, 61 (12), 3128–3139. doi:10.1139/b83-352
- Australian Bureau of Meteorology, 2012. Atlas of groundwater-dependent ecosystems [online]. Available from: http://www.bom.gov.au/water/groundwater/gde/index.shtml [Accessed 17 October 2012].
- Belyea, L.R. and Baird, A.J., 2006. Beyond “The limits to peat bog growth”: cross-scale feedback in peatland development. Ecological Monographs, 76 (3), 299–322. doi:10.1890/0012-9615(2006)076[0299:BTLTPB]2.0.CO;2
- Belyea, L.R. and Clymo, R.S., 2001. Feedback control of the rate of peat formation. Proceedings of the Royal Society B: Biological Sciences, 268 (1473), 1315–1321. doi:10.1098/rspb.2001.1665
- Blevins, E. and Aldous, A.R., 2011. The biodiversity value of groundwater-dependent ecosystems: a cataloguing of United States federally listed species that depend on groundwater. Wetland Science and Practice, 28, 18–24.
- Bragazza, L. and Gerdol, R., 1996. Response surfaces of plant species along water-table depth and water pH gradients in a poor mire on the Southern Alps. Annales Botanici Fennici, 33, 11–20.
- Bragazza, L. and Gerdol, R., 1999. Ecological gradients in some sphagnum mires in the south-eastern Alps (Italy). Applied Vegetation Science, 2 (1), 55–60. doi:10.2307/1478881
- Bridgham, S.D., et al., 1996. Multiple limiting gradients in peatlands: a call for a new paradigm. Wetlands, 16 (1), 45–65. doi:10.1007/BF03160645
- Brophy, L., 2005. Restoring freshwater wetlands in the South Slough National Estuarine Research Reserve: links between water table elevation, soils, and plant communities in restored, altered, and undisturbed wetlands. Charleston, OR: South Slough National Estuarine Research Reserve.
- Brown, J.B., et al., 2011. Groundwater-dependent ecosystems in Oregon: an assessment of their distribution and associated threats. Frontiers in Ecology and the Environment, 9 (2), 97–102. doi:10.1890/090108
- Bubier, J.L., Moore, T.R., and Juggins, S., 1995. Predicting methane emission from bryophyte distribution in northern Canadian peatlands. Ecology, 76 (3), 677–693. doi:10.2307/1939336
- Bubier, J.L., Moore, T.R., and Roulet, N., 1993. Methane emissions from wetlands in the midboreal region of northern Ontario, Canada. Ecology, 74 (8), 2240–2254. doi:10.2307/1939577
- Castelli, R.M., Chambers, J.C., and Tausch, R.J., 2000. Soil–plant relations along a soil–water gradient in Great Basin riparian meadows. Wetlands, 20 (2), 251–266. doi:10.1672/0277-5212(2000)020[0251:SPRAAS]2.0.CO;2
- Chapin, C.T., Bridgham, S.D., and Pastor, J., 2004. pH and nutrient effects on above-ground net primary production in a Minnesota, USA bog and fen. Wetlands, 24 (1), 186–201. doi:10.1672/0277-5212(2004)024[0186:PANEOA]2.0.CO;2
- Childs, E.C. and Youngs, E.G., 1961. A study of some three dimensional field-drainage problems. Soil Science, 92 (1), 15–24. doi:10.1097/00010694-196107000-00003
- Chimner, R.A., et al., 2008. Final report: regional assessment of fen distribution, condition, and restoration needs. San Juan Mountains, CO: US Environmental Protection Agency.
- Chui, T.F.M., Low, S.Y., and Liong, S., 2011. An ecohydrological model for studying groundwater–vegetation interactions in wetlands. Journal of Hydrology, 409 (1–2), 291–304.
- Clymo, R.S., 1984. The limits to peat bog growth. Philosophical Transactions of the Royal Society B: Biological Sciences, 303 (1117), 605–654. doi:10.1098/rstb.1984.0002
- Colvin, C., Cavé, L., and Saayman, I., 2004. A functional approach to setting resource quality objectives for groundwater. Stellenbosch: Council for Scientific and Industrial Research, Water Resources Commission Report no. 1235/1/04.
- Colvin, C., et al., 2009. Ecological and environmental impacts of large-scale groundwater development in the Table Mountain Group (TMG) aquifer system. Stellenbosch, South Africa: Council for Scientific and Industrial Research, Water Resources Commision Report no. 1327/1/08.
- Danielpol, D.L., et al., 2008. Incorporation of groundwater ecology in environmental policy. In: P. Quevauviller, ed. Groundwater science and policy. London: Royal Society of Chemistry, 671–689.
- Dewey, R., 2011. Supplemental antelope fen study. Chemult, OR: Chemult Ranger District, Fremont-Winema National Forest, US Department of Agriculture, Forest Service.
- Drexler, J.Z., et al., 1999. Fine-scale characteristics of groundwater flow in a peatland. Hydrological Processes, 13 (9), 1341–1359. doi:10.1002/(SICI)1099-1085(19990630)13:9<1341::AID-HYP810>3.0.CO;2-5
- Dunbar, M.J. and Acreman, M.C., 2001. Applied hydro-ecological science for the 21st century. In: M.C. Acreman, ed. Hydro-ecology: linking hydrology and aquatic ecology. Wallingford, IAHS Press: IAHS Publication 266, 1–18.
- Duval, T.P. and Waddington, J.M., 2011. Extreme variability of water table dynamics in temperate calcareous fens: implications for biodiversity. Hydrological Processes, 25 (24), 3790–3802. doi:10.1002/hyp.8109
- Duval, T.P., Waddington, J.M., and Branfireun, B.A., 2012. Hydrological and biogeochemical controls on plant species distribution within calcareous fens. Ecohydrology, 5 (1), 73–89. doi:10.1002/eco.202
- Dwire, K.A., Kauffman, J.B., and Baham, J.E., 2006. Plant species distribution in relation to water table depth and soil redox potential in montane riparian meadows. Wetlands, 26 (1), 131–146. doi:10.1672/0277-5212(2006)26[131:PSDIRT]2.0.CO;2
- Eamus, D. and Froend, R., 2006. Groundwater-dependent ecosystems: the where, what, and why of GDEs. Australian Journal of Botany, 54 (2), 91–96. doi:10.1071/BT06029
- Eamus, D., et al., 2006. A functional methodology for determining the groundwater regime needed to maintain the health of groundwater-dependent vegetation. Australian Journal of Botany, 54 (2), 97–114. doi:10.1071/BT05031
- Frolking, S., et al., 2010. A new model of Holocene peatland net primary production, decomposition, water balance, and peat accumulation. Earth System Dynamics Discussions, 1, 115–167. doi:10.5194/esdd-1-115-2010
- Gasca, D. and Ross, D., 2009. The use of wetland water balances to link hydrogeological processes to ecological effects. Hydrogeology Journal, 17 (1), 115–133. doi:10.1007/s10040-008-0407-x
- Gignac, L.D., et al., 2004. Distribution and habitat niches of 37 peatland Cyperaceae species across a broad geographic range in Canada. Canadian Journal of Botany-Revue Canadienne De Botanique, 82, 1292–1313.
- Gignac, L.D., Vitt, D.H., and Bayley, S.E., 1991. Bryophyte response surfaces in ecological and climatic space. Vegetatio, 93 (1), 29–45.
- Godwin, K.S., et al., 2002. Linking landscape properties to local hydrogeologic gradients and plant species occurrence in minerotrophic fens of New York State, USA: a hydrogeologic setting (HGS) framework. Wetlands, 22 (4), 722–737. doi:10.1672/0277-5212(2002)022[0722:LLPTLH]2.0.CO;2
- Hajkova, P., Wolf, P., and Hajek, M., 2004. Environmental factors and Carpathian spring fen vegetation: the importance of scale and temporal variation. Annals Botanica Fennici, 41, 249–262.
- Howe, P. and Pritchard, J., 2007. A framework for assessing the environmental water requirements of groundwater dependent ecosystems, Report 3, Implementation. Braddon: Land and Water Australia.
- Huotari, N., et al., 2007. Fertilization ensures rapid formation of ground vegetation on cut-away peatlands. Canadian Journal of Forest Research, 37 (5), 874–883. doi:10.1139/X06-292
- Ilomets, M., et al., 2010. Species composition and structure of vascular plants and bryophytes on the water level gradient within a calcareous fen in North Estonia. Estonian Journal of Ecology, 59 (1), 19–38. doi:10.3176/eco.2010.1.02
- Ingram, H.A.P., 1982. Size and shape in raised mire ecosystems: a geophysical model. Nature, 297, 300–303. doi:10.1038/297300a0
- Johnson, J.B., 1996. Phytosociology and gradient analysis of a subalpine treed fen in Rocky Mountain National Park, Colorado. Canadian Journal of Botany, 74, 1203–1213. doi:10.1139/b96-145
- Johnson, J.B. and Steingraeber, D.A., 2003. The vegetation and ecological gradients of calcareous mires in the South Park valley, Colorado. Canadian Journal of Botany, 81 (3), 201–219. doi:10.1139/b03-017
- Karlin, E.F. and Bliss, L.C., 1984. Variation in substrate chemistry along microtopographical and water-chemistry gradients in peatlands. Canadian Journal of Botany, 62, 142–153. doi:10.1139/b84-023
- Kim, J. and Verma, S.B., 1992. Soil surface CO2 flux in a Minnesota peatland. Biogeochemistry, 18 (1), 37–51. doi:10.1007/BF00000425
- Lamentowicz, M. and Mitchell, E.A., 2005. The ecology of testate amoebae (Protists) in Sphagnum in north-western Poland in relation to peatland ecology. Microbial Ecology, 50, 48–63. doi:10.1007/s00248-004-0105-8
- Limpens, J., et al., 2008. Peatlands and the carbon cycle: from local processes to global implications—a synthesis. Biogeosciences Discussions, 5, 1379–1419. doi:10.5194/bgd-5-1379-2008
- Locky, D.A., Bayley, S.E., and Vitt, D.H., 2005. The vegetational ecology of black spruce swamps, fens, and bogs in southern boreal Manitoba, Canada. Wetlands, 25 (3), 564–582. doi:10.1672/0277-5212(2005)025[0564:TVEOBS]2.0.CO;2
- Loheide, S.P. and Gorelick, S.M., 2007. Riparian hydroecology: a coupled model of the observed interactions between groundwater flow and meadow vegetation patterning. Water Resources Research, 43, 1–16.
- Manning, M.E. and Padgett, W.G., 1995. Riparian community type classification for Humboldt and Toiyabe National Forests, Nevada and Eastern California. Ogden, UT: US Department of Agriculture, Forest Service, Intermountain Region. R4-Ecol-95-01.
- McLeod, N.S. and Sherrod, D.R., 1992. Reconnaissance geologic map of the west half of the Crescent 1° by 2° Quadrangle, central Oregon: US Geological Survey Miscellaneous Investigations Series Map I-2215, Scale: 1:250,000. Portland, OR: US Department of the Interior.
- MGCAC (Michigan Groundwater Conservation Advisory Council), 2007. Report to the Michigan Legislature in Response to Public Act 34 [online]. Groundwater Conservation Advisory Council, Department of Environmental Quality, MI. Available from: http://www.michigan.gov/documents/deq/Groundwater_report_206809_7.pdf [Accessed 17 October 2012].
- Millennium Ecosystem Assessment, 2005. Millennium ecosystem assessment synthesis report. Washington, DC: Island Press.
- Miserere, L., Montacchini, F., and Buffa, G., 2003. Ecology of some mire and bog plant communities in the Western Italian Alps. Journal of Limnology, 62 (1), 88–96. doi:10.4081/jlimnol.2003.88
- Moore, T.R. and Knowles, R., 1989. The influence of water table levels on methane and carbon dioxide emissions from peatland soils. Canadian Journal of Soil Science, 69 (1), 33–38. doi:10.4141/cjss89-004
- Murray, B.R., et al., 2003. Groundwater-dependent ecosystems in Australia: it’s more than just water for rivers. Ecological Management and Restoration, 4 (2), 110–113. doi:10.1046/j.1442-8903.2003.00144.x
- National Wetlands Working Group, 1988. Wetlands of Canada. Ottawa: Polyscience Publications.
- Natural Resources Conservation Service, 2012. Chemult alternate Snotel total annual precipitation [online]. Available from: http://www.or.nrcs.usda.gov/snow/maps/sitepages/21f22s.html [Accessed 16 October 2012].
- Nicholson, B. and Gignac, L., 1995. Ecotope dimensions of peatland bryophyte indicator species along gradients in the Mackenzie River Basin, Canada. The Bryologist, 98 (4), 437–451. doi:10.2307/3243583
- Padgett, W.G., Youngblood, A.P., and Winward, A.H., 1989. Riparian community type classification of Utah and southeastern Idaho. Ogden, UT: US Department of Agriculture, Forest Service, Intermountain Region, R4-Ecol-89-01.
- Poff, N.L. and Zimmerman, J.K.H., 2010. Ecological responses to altered flow regimes: a literature review to inform the science and management of environmental flows. Freshwater Biology, 55, 194–205. doi:10.1111/j.1365-2427.2009.02272.x
- Poff, N.L., et al., 1997. The natural flow regime: a paradigm for river conservation and restoration. Bioscience, 47, 769–784. doi:10.2307/1313099
- Poff, N.L., et al., 2010. The ecological limits of hydrologic alteration (ELOHA): a new framework for developing regional environmental flow standards. Freshwater Biology, 55, 147–170. doi:10.1111/j.1365-2427.2009.02204.x
- Postel, S. and Richter, B., 2003. Rivers for life: managing water for people and nature. Washington, DC: Island Press.
- Sabiham, S., et al., 2012. Organic carbon storage and management strategies for reducing carbon emission from peatlands: a case study in oil palm plantations in West and Central Kalimantan, Indonesia. Pedologist, SI, 55 (3), 426–434.
- SAS Institute Inc., 2012. SAS/STAT® 9.2 User’s Guide. Cary, NC: SAS Institute.
- Schutten, J., et al., 2011. Technical report on groundwater dependent terrestrial ecosystems. Brussels: European Commission, Technical Report 2011-056. Common Implementation Strategy for the Water Framework Directive (2000/60/EC).
- Sims, R.A., Cowell, D.W., and Wickware, G.M., 1982. Classification of fens near southern James Bay, Ontario, using vegetational physiognomy. Canadian Journal of Botany, 60 (12), 2608–2623. doi:10.1139/b82-317
- Sinclair Knight Merz, 2011. Australian groundwater-dependent ecosystems toolbox part 1: assessment framework. Canberra: National Water Commission, Waterlines Report Series, 69.
- Sophocleous, M., 2007. The science and practice of environmental flows and the role of hydrogeologists. Ground Water, 45, 393–401. doi:10.1111/j.1745-6584.2007.00322.x
- Sprecher, S.W., 2008. Installing monitoring wells in soils (Version 1.0). Lincoln, NE: National Soil Survey Center, Natural Resources Conservation Service, US Department of Agriculture.
- Stechova, T. and Kucera, J., 2007. The requirements of the rare moss, Hamatocaulis vernicosus (Calliergonaceae, Musci), in the Czech Republic in relation to vegetation, water chemistry and management. Biological Conservation, 135 (3), 443–449. doi:10.1016/j.biocon.2006.10.021
- Stevens, L.E. and Meretsky, V.J., 2008. Aridland springs in North America: ecology and conservation. Tucson: University of Arizona Press.
- Szumigalski, A. and Bayley, S., 1997. Net aboveground primary production along a peatland gradient in central Alberta in relation to environmental factors. Ecoscience, 4 (3), 385–393.
- Szumigalski, A. and Bayley, S.E., 1996. Decomposition along a bog to rich fen gradient in central Alberta, Canada. Canadian Journal of Botany, 74 (4), 573–581. doi:10.1139/b96-073
- Tharme, R.E., 2003. A global perspective on environmental flow assessment: emerging trends in the development and application of environmental flow methodologies for rivers. River Research and Applications, 19 (5–6), 397–441.
- Tomlinson, M., 2011. Ecological water requirements of groundwater systems: a knowledge and policy review. Canberra: National Water Commission, Waterlines Report Series 68.
- UK TAG (UK Technical Advisory Group), 2012. Technical report on groundwater-dependent terrestrial ecosystem (GWDTE) threshold values. Working Paper, 8, 23 March 2012. London: UK Technical Advisory Group on the Water Framework Directive.
- U.S. Army Corps of Engineers, 2012. North American digitalflora: national wetland plant list [online]. Available from: http://rsgisias.crrel.usace.army.mil/apex/f?p=703:1 [Accessed 17 October 2012].
- U.S. Forest Service, 2012. Antelope grazing allotments project [online]. Available from: http://www.fs.fed.us/nepa/fs-usda-pop.php/?project=33325 [Accessed 9 October 2012].
- van Diggelen, R., et al., 1991. Hydro-ecological analysis of the fen system Lieper Posse, eastern Germany. Journal of Vegetation Science, 2, 465–476. doi:10.2307/3236028
- Verhoeven, J.T.A., Kemmers, R.H., and Koerselman, W., 1993. Nutrient enrichment of freshwater wetlands. In: C.C. Vos and P. Opdam, eds. Landscape ecology of a stressed environment. London: Chapman and Hall, p. 33–59.
- Verry, E.S., et al., 2011. Physical properties of organic soils. In: R.K. Kolka, et al., eds. Peatland biogeochemistry and watershed hydrology at the Marcell Experimental Forest. Boca Raton, FL: CRC Press, p. 135–176.
- Vitt, D. and Slack, N., 1984. Niche diversification of Sphagnum relative to environmental factors in northern Minnesota peatlands. Canadian Journal of Botany, 62 (7), 1409–1430. doi:10.1139/b84-192
- Wassen, M.J. and Barendregt, A., 1992. Topographic position and water chemistry of fens in a Dutch river plain. Journal of Vegetation Science, 3 (4), 447–456. doi:10.2307/3235801
- Weixelman, D.A. and Cooper, D.J., 2009. Assessing proper functioning condition for fen areas in the Sierra Nevada and Southern Cascade Ranges in California, a user guide. Vallejo, CA: US Department of Agriculture, Forest Service, Pacific Southwest Region, Gen. Tech. Rep. R5-TP–028.
- Western Regional Climate Center, 2012. Annual total precipitation [online]. Available from: http://www.wrcc.dri.edu/cgi-bin/rawMAIN.pl?orOTIM [Accessed 16 October 2012].
- Wheeler, B.D., et al., 2004. Ecohydrological guidelines for lowland wetland plant communities. In: A.W. Brooks, P.V. Jose, and M.I. Whiteman, eds. Protecting and enhancing wetlands. Rotherham: Environment Agency Anglian Region.
- Wood, P.J., Agnew, M.D., and Petts, G.E., 2001. Hydro-ecological variability within a groundwater dominated stream. In: M.C. Acreman, ed. Hydro-ecology: linking hydrology and aquatic ecology. Wallingford, IAHS Press: IAHS Publication 266, 151–160.
- Zhang, Y., et al., 2011. Landscape scale modeling of the potential effect of groundwater-level declines on forested wetlands in the New Jersey Pinelands. Wetlands, 31, 1131–1142. doi:10.1007/s13157-011-0223-2