
Abstract
Travel time and time of concentration Tc are important time parameters in hydrological designs. Although Tc is the time for the runoff to travel to the outlet from the most remote part of the catchment, most researchers have used an indirect method such as hydrograph analysis to estimate Tc. A quasi two-dimensional diffusion wave model with particle tracking for overland flow was developed to determine the travel time, and validated for runoff discharges, velocities, and depths. Travel times for 85%, 95% and 100% of particles arrival at the outlet of impervious surfaces (i.e. Tt85, Tt95, and Tt100) were determined for 530 model runs. The correlations between these travel times and Tc estimated from hydrograph analysis showed a significant agreement between Tc and Tt85. All the travel times showed nonlinear relationships with the input variables (plot length, slope, roughness coefficient, and effective rainfall intensity) but showed linear relationships with each other.
Editor D. Koutsoyiannis; Associate editor S. Grimaldi
Résumé
Le temps de transfert et le temps de concentration Tc sont des paramètres de temps importants pour l’ingénierie hydrologique. Bien que Tc soit défini comme le temps mis par le ruissellement pour aller de la partie la plus éloignée du bassin versant jusqu’à l’exutoire, la plupart des chercheurs ont utilisé une méthode indirecte, telle que l’analyse de l’hydrogramme, pour estimer Tc. Un modèle d’écoulement de surface par onde diffusante en quasi-deux dimensions avec suivi de particules a été développé pour déterminer le temps de transfert, et validé pour les débits, les vitesses et les hauteurs d’écoulement. Les temps de transfert pour 85%, 95% et 100% d’arrivées de particules à l’exutoire de surfaces imperméables (c’est-à-dire Tt85, Tt95, et Tt100) ont été déterminés pour 530 exécutions du modèle. Les corrélations entre ces temps de transfert et les valeurs de Tc estimées par analyse d’hydrogramme ont montré un bon accord entre Tc et Tt85. Tous les temps de transfert ont montré des relations non-linéaires avec les variables d’entrée (longueur de la parcelle, pente, coefficient de rugosité, et intensité de la pluie efficace) mais ont montré des relations linéaires entre eux.
INTRODUCTION
The problem of estimating travel velocities and thus travel time from digital elevation models (DEMs) is still an open topic. Maidment (Citation1993) was one of the first to relate travel velocities to geomorphic properties, such as contributing area and slope. However, to specify travel speed for each particle along the travel path was challenging and Maidment (Citation1993) used a DEM for overland flow routing based on constant velocity. Similarly, Olivera and Maidment (Citation1999) developed a raster-based, spatially distributed routing technique based on a first-passage time response function. Smedt et al. (Citation2000) and Liu et al. (Citation2003) proposed a flow routing method along flow paths determined by the topography depending upon slopes, flow velocities, and dissipation characteristics along the flow paths. Luo and Harlin (Citation2003) derived simplified theoretical travel times based on watershed hypsometry ignoring friction and stated that the theoretical travel time is not equal to the real measured time-to-peak discharge. Admiraal et al. (Citation2004) used a particle tracking routine in their two-dimensional flow model to release particles (water parcels) at the inlet and computed their paths and travel times through the wetland from the velocity field. Noto and La Loggia (Citation2007) computed the travel time of two watersheds implementing a cell-to-cell flow path through the landscape determined from a DEM. Cleveland et al. (Citation2008) used a particle tracking model based on a DEM to derive synthetic unit hydrographs for 126 Texas watersheds. The velocity of each particle was calculated using an equation similar to Manning’s equation with resistance coefficient and mean flow depth as watershed calibration parameters. Grimaldi et al. (Citation2010) improved the width function in an instantaneous unit hydrograph based on travel time function and tested it in 11 case studies. Froehlich (Citation2011) developed an overland flow travel time formula based on rainfall intensity–duration relationships using the kinematic wave approximation. Niri et al. (Citation2012) derived a semi-analytical travel time formula for time-area model applications. Travel time is often closely linked to another time parameter, time of concentration Tc commonly used in hydrological designs and analyses (Kent Citation1972, Pilgrim Citation1976, McCuen et al. Citation1984, Saghafian and Julien Citation1995). Most of the empirical formulas developed for Tc are based on estimation of Tc from observed or simulated hydrographs.
Even though Tc is commonly defined as the time it takes runoff to travel from the most distant point along a hydraulic pathway in the watershed to the outlet, many researchers have used an indirect method, such as hydrograph analysis, to estimate Tc instead of measuring or determining travel time for particles to reach the outlet. Kull and Feldman (Citation1998) assumed the travel time of runoff from each cell in a watershed is proportional to Tc scaled by the ratio of travel length of the cell over the maximum travel length. This method is implemented in HEC-GEOHMS (Doan Citation2000). However, this means that the average runoff velocity travelling from any point to the outlet is assumed uniform and constant (Saghafian et al. Citation2002). This assumption of uniform velocity gives an incorrect estimate of both travel time and Tc. Since overland flow is both unsteady and non-uniform, the spatial variability in flow characteristics both across and down the slope makes it difficult to obtain reliable estimates of all the velocities in the flow (Abrahams et al. Citation1986).
An alternative approach to obtain the travel time is to measure the time required for the passage of dye along a prespecified distance. Emmett (Citation1970), Dunne and Dietrich (Citation1980), Roels (Citation1984), Govers (Citation1992), and Rouhipour et al. (Citation1999) recorded the travel time of the front of the dye. However, they measured the travel time for the fastest fronts of flow while neglecting the slower-moving parts of the flow. Consequently, their measurements of surface velocity were overestimated (Emmett Citation1970, Dunne and Dietrich Citation1980). Moreover, the larger the fraction in a flow that is outside the measured fast flowing front, the more severe will be the overestimation of the velocity (Abrahams et al. Citation1986). Similarly, coarse space and time resolutions of such data have limited their usability (Grimaldi et al. Citation2012). Similarly, while there is an increasing availability of high resolution DEM for river basins, there is often a lack of adequate hydrological data for small and ungauged catchments (Grimaldi et al. Citation2010). As a result, travel time estimation for such small and poorly monitored catchments is a topic of increasing interest.
Hence, a direct approach for determining the travel time of both fast and slow moving particles to reach the outlet of impervious surfaces is presented in this paper. Even so, the travel of particles in a watershed may occur on the surface or below it or in a combination of both; however, only the travel of particles on the surface (impervious) is considered in this study. A quasi two-dimensional diffusion wave model with particle tracking (DWMPT) was developed from the diffusion hydrodynamic model (DHM) (Hromadka II and Yen Citation1986) and validated extensively using observed discharge, flow depth and velocity data from published studies. The travel times of all particles, including both slow moving particles at the upstream and fast moving particles at the downstream, are consolidated into representative time parameters. Based on the percentage of particles reaching the outlet, travel times for 85%, 95% and 100% of particles arrival at the outlet are defined as Tt85, Tt95 and Tt100, respectively. A total of 530 DWMPT runs were performed to determine travel times on impervious surfaces using diverse combinations of the four physically-based input variables: length (L), slope (So), Manning’s surface roughness coefficient (n), and effective rainfall intensity (i). The dataset of travel times was generated using a particle tracking method with simulated velocities from the validated DWMPT for conducting a parametric study. Finally, relationships between these travel times and input variables were developed for impervious overland flow planes, and relationships between these travel times were investigated. Relationships between Tc estimated from hydrograph analysis and these travel times were developed and presented.
DIFFUSION WAVE MODEL WITH PARTICLE TRACKING
Hydrological models are numerical models, which attempt to mimic the physical processes within a watershed. Both kinematic and diffusion wave models have been used to simulate these physical processes of surface water movement (Kazezyilmaz-Alhan and Medina Jr. Citation2007, López-Barrera et al. Citation2012) in hydrological–hydraulic models. This study deals with numerical simulations of overland flows to investigate direct estimation of travel times of particles on impervious surfaces. Overland flow has been simulated using one- and two-dimensional (1D or 2D) kinematic or diffusion wave models (Henderson and Wooding Citation1964, Woolhiser and Liggett Citation1967, Singh Citation1976, Yen and Chow Citation1983, Abbott et al. Citation1986, Chen and Wong Citation1993, Wong Citation1996, Jia et al. Citation2001, Ivanov et al. Citation2004) and dynamic wave models (Morgali and Linsley Citation1965, Yeh et al. Citation1998, Su and Fang Citation2004). The kinematic wave model is frequently used for the development of Tc formulas (Wong Citation2005). McCuen and Spiess (Citation1995) suggested that the kinematic wave assumption should be limited to the kinematic wave number < 100. Hromadka II and Yen (Citation1986) developed the quasi-2D diffusion hydrodynamic model (DHM) to incorporate the pressure effects neglected by the kinematic wave approximation. The diffusion wave approximation is generally accurate for most of the overland flow conditions (Singh and Aravamuthan Citation1995, Moramarco and Singh Citation2002, Singh et al. Citation2005). It is understood that DHM is inaccurate for cases in which the inertial terms play prominent roles such as when the slope of the surface is small (Yeh et al. Citation1998). Studying overland flows on low-sloped planes has been presented elsewhere (KC et al. Citation2014) and is beyond the scope of this study.
In this study, a quasi-2D diffusion wave model (DWM), that includes the particle tracking (PT) capability called DWMPT, was developed by modifying the quasi-2D DHM (Hromadka II and Yen Citation1986) for simulating overland flow on impervious surfaces/planes. The quasi-2D DWMPT solves the momentum and continuity equations (Akan and Yen Citation1984). Details of the governing equations and numerical solution method used in the DHM are described in Hromadka II and Yen (Citation1986). A number of modifications have been made in DWMPT over DHM. DWMPT has efficient numerical stability criteria using the Courant number, checks for mass and momentum conservation errors, and incorporates detailed rainfall loss models (fractional loss model for impervious surface), and a sub-module for determining time of concentration from the outflow hydrograph. These modifications and improvements are described in detail in KC et al. (Citation2014). The 1D particle tracking model (PTM), a new sub-module of DWMPT, is presented below.
Particle tracking model
The fundamental idea of PTM is to introduce discrete particles (or parcels) in the simulation domain that move according to some kinematics. Various approaches of particle tracking are employed in tracking the flow and pollutants in different fields of computational fluid dynamics. A particle-in-cell approach for particle tracking in fluid dynamics was used by Harlow (Citation1963) and Amsden (Citation1966). Since then, a number of different approaches have been used for tracking particles like the random-walk method (Ahlstron et al. Citation1977, Prickett et al. Citation1981), method of characteristics (Konikow and Bredehoeft Citation1978) and marker-and-cell method (Harlow and Welch Citation1966, Taylor Citation1983). Similarly, there are many measurement studies of particle tracking that often involve the use of tracers such as dyes (Emmett Citation1970, Dunne and Dietrich Citation1980, Roels Citation1984, Abrahams et al. Citation1986), electrolytes (Planchon et al. Citation2005, Tingwu et al. Citation2005, Lei et al. Citation2010), magnetic materials (Ventura et al. Citation2001, Hu et al. Citation2011), isotopes (Gardner and Dunn III Citation1964, Berman et al. Citation2009), buoyant and fluorescent objects (Bradley et al. Citation2002, Dunkerley Citation2003, Meselhe et al. Citation2004, Tauro et al. Citation2010, Citation2012a). Among these, particle tracking velocimetry (PTV) and particle image velocimetry (PIV) are well suited for measurements of surface velocity of particles in physical models (Admiraal et al. Citation2004). The credit for initial development of PTV and PIV goes to Chang et al. (Citation1985), Liu et al. (Citation1991), and Landreth et al. (Citation2004) who contributed primarily with their laboratory experimental studies of turbulent flows. In particular, PIV is a powerful technique to perform velocity measurements for a large number of flows (Adrian Citation1991, Raffel et al. Citation1998) and has been used in velocity measurements for shallow flows (Weitbrecht et al. Citation2002, Meselhe et al. Citation2004, Tauro et al. Citation2012b). However, development of physically-based regression equations, to calculate travel times using particle tracking in hydrology for small and ungauged catchments, has not been attempted.
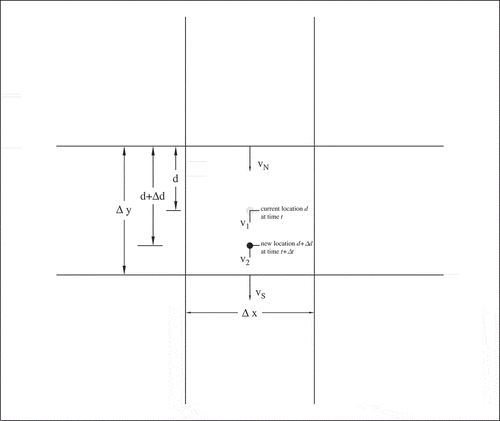
In this study, the travel time of each particle in the experimental watershed is computed using the PTM sub-module that uses flow velocities simulated by DWMPT at each time step (). Over each computational time step, the particle travels over a distance determined by the product of the appropriate velocities and the time interval. The PTM is integrated within the framework of the DWMPT model to simulate the travel time required by the particle at the farthest cell (or designated cells) to arrive at the outlet. Thus, the travel time estimated can be used to define Tc for the watershed because it is the time required by the farthest particle to reach the outlet. The algorithm used to calculate the travel time using PTM is summarized below:
Flow velocities such as vN and vS in at the inter-cell faces are calculated by the DWMPT by solving the flow equations. The PTM sub-module is activated at the desired time (at the beginning of the rainfall event for impervious surfaces). A single particle at each cell of the discretized domain is initialized.
Check the location of the particle; if the particle is at the outlet cell, it is removed from the domain; and PTM counts number of particles arriving at the outlet. Find the direction of steepest gradient to determine the direction of flow. The direction of flow can also be designated in the input file if the travel time at a defined path (e.g. along a stream) has to be determined.
Find the first estimate of the particle velocity v1 () by linear interpolation. Based on the current position of the particle, its velocity is interpolated using modelled velocities of the two opposite inter-cell faces such as vN and vS in in the direction of flow.
Calculate the distance ∆d that is travelled by the particle using the velocity v1 during the time interval ∆t.
Find the second estimate of particle velocity v2 at the new location d + ∆d by linear interpolation. Using an average of the velocities at current (v1) and new location (v2), a new estimate of ∆d is calculated. This process is iterated until the error between the old and new estimate of ∆d is reduced to a pre-specified tolerance. The Courant condition (Cr ≤ 1) is implemented in DWMPT, and the particle does not travel more than a cell length during a computational time interval.
Check whether or not the particle crosses the cell boundary. If the particle travels to the next cell, a new velocity is interpolated using the new particle cell location. The distance travelled for the remaining time interval with the new velocity is calculated similar to the above steps.
The travel path length and travel time of the particle are updated along with the particle position.
The above steps are iterated for the next time step with updated velocities simulated by DWMPT until all the particles in the discretized domain reach the outlet.
Fig. 1 Two-dimensional DWMPT finite difference grids illustrating the movement of particle i from the old location d at time t to new location d + ∆d at time t + ∆t. The grid sizes Δx and Δy are the same for DWMPT.
Before PTM was used to determine the particle travel time, DWMPT was validated using observed velocity, flow depth, and discharge measurements published in the literature.
MODEL VALIDATION
Model validation using discharge hydrographs
The DWMPT was first validated using observed discharge hydrographs published by Chow (Citation1967) and Ben-Zvi (Citation1984), who conducted experiments in the Watershed Experimentation System of the University of Illinois. The experiments were conducted on a 12.2 × 12.2 m (40 × 40 ft) masonite and aluminum-surfaced watershed. The rainfall intensities in the experiments varied from 51 to 305 mm h-1 (2–12 in h-1), and the rainfall durations from 0.5 to 8 min. The longitudinal slope of the watersheds varied from 0.5% to 3% and cross slope was fixed at 1%. Areas exposed to the rainfall had nine different configurations (Ben-Zvi Citation1984); the configuration called Lot 3, which had rainfall in the entire watershed, was modelled using DWMPT in this study. Simulated discharge hydrographs at the outlet for four rainfall events on different slopes, selected from Lot 3 data on an aluminum surface from Ben-Zvi (Citation1984) experiments, were compared with observed ones (). Observed and simulated hydrographs along with rainfall hyetographs for a longitudinal slope of 0.5%, 1.0%, 1.5%, and 2.0% are shown in (a)–(d), respectively. The hyetographs with durations of 8 min of the experiments presented in (a)–(d) are uniform rainfall intensities of 215 mm h-1 (8.45 in h-1), 291 mm h-1 (11.46 in h-1), 220 mm h-1 (8.65 in h-1) and 221 mm h-1 (8.72 in h-1), respectively. DWMPT simulated hydrographs were generated using calibrated Manning’s roughness coefficient of 0.02 for an aluminum surface. The agreement between observed and simulated peak discharges and hydrographs is excellent ( and ).
Fig. 2 Observed effective rainfall hyetographs and observed and simulated hydrographs for an aluminum surface, 12.2 m long and 12.2 m wide, with a cross slope of 1% and longitudinal slope of: (a) 0.5%, (b) 1.0%, (c) 1.5%, and (d) 2.0%. Observed data presented above are from Lot 3 of Ben-Zvi (Citation1984).
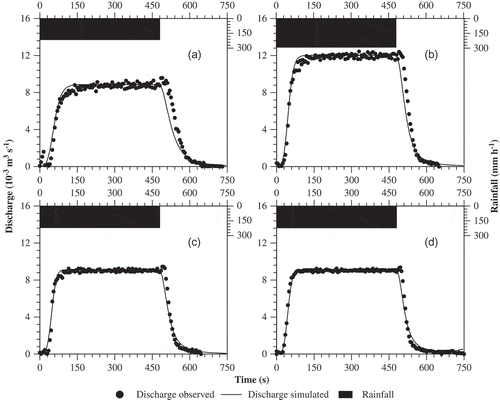
Table 1 Input variables, peak discharges Qp estimated using the Rational method, observed data, and modelled using DWMPT, and corresponding model performance parameters calculated between observed and modelled discharge hydrographs for impervious overland flow planes.
Yu and McNown (Citation1963) measured runoff and depth hydrographs for different combinations of slope, roughness, and rainfall intensity at the airfield drainage system in Santa Monica, California. lists four rainfall events from Yu and McNown (Citation1963), and four events from Ben-Zvi (Citation1984), along with input variables (L in m, So in percent, n, and i in mm h-1), peak discharge, Qp (in m3 s-1) estimated using the Rational method, observed and simulated Qp values, and model performance parameters. The goodness of fit between modelled and observed quantities was measured using the Nash-Sutcliffe coefficient, Ns (Legates and McCabe Citation1999) and root mean square error, RMSE. For a hydrograph simulation, a good agreement between simulated and measured discharges is achieved when Ns exceeds 0.7 (Bennis and Crobeddu Citation2007). The average Ns was 0.97 (range: 0.94–0.99), and average RMSE was 0.04 × 10⁻³ m3 s-1 (range: 0.02–0.09 × 10⁻³ m3 s-1) for eight simulated hydrographs (). The Qp estimates from the Rational method agreed well with measured and simulated Qp values (). The average error between the Rational method Qp and observed Qp was 2.5% (range: 0.2–7.4%), and average error between simulated Qp and observed Qp was also 2.5% (range: 0.1–7.5%). These statistics indicate close agreement between measured and simulated hydrographs.
Model validation using depth hydrographs
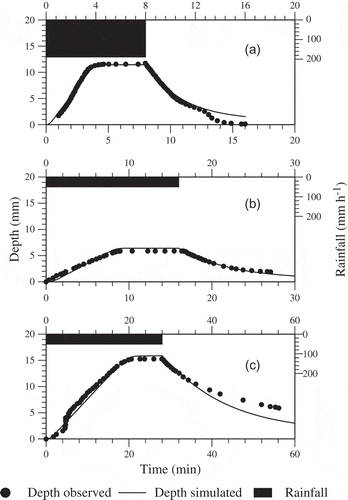
The DWMPT was also validated using observed depth hydrographs from Yu and McNown (Citation1963). They measured observed depth to an accuracy of a few ten-thousandths of a foot. and show simulated and observed depth hydrographs from concrete surfaces of 152.4 m (500 ft) by 0.3 m (1 ft) with a slope of 2% and 0.5%, respectively, and for a turf surface of the same dimension with a slope of 0.5%. Depth hydrographs are reported at 142.3 m (467 ft) from the upstream boundary in and but at 101.5 m (333 ft) for . The hyetographs for the experiments in , and are effective rainfall intensities of 189 mm h-1 (7.44 in h-1) with duration of 8 min, 49 mm h-1 (1.93 in h-1) with duration of 16 min, and 49 mm h-1 (1.93 in h-1) with duration of 28 min, respectively. Depth hydrographs simulated using DWMPT matched well with the observed ones (). The average Ns was 0.96, and average RMSE was 0.63 mm for three simulated depth hydrographs and indicate close agreement with measured depth hydrographs.
Fig. 3 Observed effective rainfall hyetographs and observed and simulated runoff depth hydrographs for a plot, 152.4 m long and 0.3 m wide with a slope of: (a) 2% at 142.3 m from upstream, (b) 0.5% at 101.5 m from upstream, and (c) 0.5% at 142.3 m from upstream. Observed data presented in (a) and (b) are for concrete surfaces, and (c) for a turf surface from Yu and McNown (Citation1963).
Model validation using velocity observations
The DWMPT was also validated using calculated and observed velocity data from Yu and McNown (Citation1963), Izzard and Augustine (Citation1943), and Mügler et al. (Citation2011). Yu and McNown (Citation1963) used an ogee-shaped weir to measure runoff at the outlet. Since the critical flow condition was created for the measurement of the observed discharge hydrograph, the calculated velocity can be obtained from the observed discharge hydrograph using the critical flow equation. Four example comparisons using calculated velocity data from Yu and McNown (Citation1963) are shown in . Calculated and simulated runoff velocity hydrographs at the outlet of a 152.4 m (500 ft) long and 0.3 m (1 ft) wide concrete surface with slopes of 2%, 0.5% and 0.5% are shown in , and , respectively, and for a turf surface with a slope of 0.5% in . The hyetographs for the experiments presented in – were uniform effective rainfall intensities of 189 mm h-1 (7.44 in h-1) with a duration of 8 min, 50 mm h-1 (1.98 in h-1) with duration 16 min, 51 mm h-1 (2.0 in h-1) with duration 28 min, and 22 mm h-1 (0.85 in h-1) with duration 22 min, respectively. Even though the turf surface is a pervious surface, it was simulated by DWMPT as an impervious surface. The rainfall in the experiment was applied for a longer time to make the rainfall loss uniform. The rainfall input to the DWMPT was the effective rainfall intensity. DWMPT simulated velocity hydrographs were generated using calibrated Manning’s roughness coefficients of 0.011–0.013 for concrete and 0.035 for turf surfaces (). The calculated velocities compared well with the simulated velocities at the outlet having the critical flow condition ().
Fig. 4 Observed effective rainfall hyetographs and observed calculated and simulated runoff velocity hydrographs at the outlet for a plot, 152.4 m long and 0.3 m wide, with a slope of: (a) 2%, (b) 0.5%, (c) 0.5%, and (d) 0.5%. Observed and calculated data presented in (a), (b) and (d) are for concrete surfaces, and (c) for turf surface from Yu and McNown (Citation1963) based on the critical flow condition at the outlet.
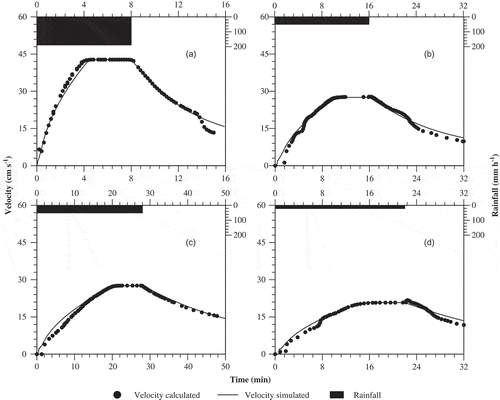
Table 2 Input variables, model performance parameters for simulated velocity hydrographs, time of concentration Tc, travel times (Tt85, Tt95 and Tt100) for impervious overland flow planes.
Izzard and Augustine (Citation1943) collected rainfall and runoff data from paved and turf surfaces for the Public Roads Administration in 1942. Runoff was measured by a 0.4 ft wide HS flume with head measured by a point gauge. The calculated velocity hydrograph was obtained from the observed discharge hydrograph using the critical flow equation. lists four rainfall events from Yu and McNown (Citation1963) and four events from Izzard and Augustine (Citation1943), along with input variables L, So, n and i; and model performance parameters (Ns and RMSE) developed between simulated and calculated velocity hydrographs. The average Ns was 0.89 (range: 0.66–0.98), and average RMSE was 2.0 cm s-1 (range: 1.1–2.5 cm s-1) for eight simulated velocity hydrographs (). These statistics indicate a strong agreement between measured and simulated velocity hydrographs.
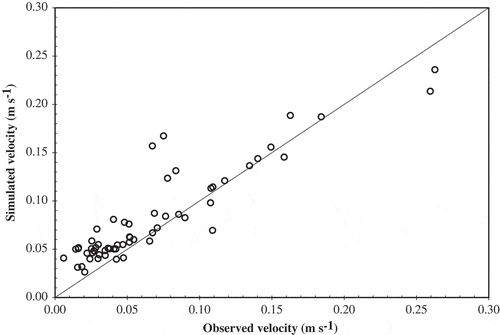
Mügler et al. (Citation2011) collected velocity measurements to compare different roughness models in a 10 m (32.8 ft) long by 4 m (13.1 ft) wide sandy soil surface with a 1% longitudinal slope. The rainfall simulator provided a constant average intensity of 69 mm h-1 (Esteves et al. Citation2000). Rainfall was applied for more than 2 h to maintain steady runoff before the flow velocity measurements were performed. The steady state discharge was 0.5 × 10⁻³ m3 s-1 (0.018 ft3 s-1). The flow velocities were measured at 60 monitoring points on the surface using salt velocity gauge technology, an automated, miniaturized device based on the inverse modelling of the propagation of a salt plume (Tatard et al. Citation2008). The observed flow velocities ranged from 0.006 to 0.27 m s-1 and provided a valuable dataset for comparison with DWMPT simulated velocities. shows observed vs simulated velocities at 60 locations within the plot. The Ns for velocity data pairs is 0.76, and RMSE is 0.03 m s-1. All the above statistics, derived from velocity observations from Yu and McNown (Citation1963), Izzard and Augustine (Citation1943), and Mügler et al. (Citation2011), and simulations by DWMPT, indicate that the flow model can predict runoff velocities with an acceptable accuracy. It can, therefore, be used for particle tracking to determine travel times of the particles.
Fig. 5 Observed and simulated velocities for a plot of sandy soil surface, 10 m long and 4 m wide, with a slope of 1.0% and constant average rainfall intensity of 70 mm h-1. Observed data are from Mügler et al. (Citation2011).
COMPUTATION OF TRAVEL TIMES AND TIME OF CONCENTRATION
Flow velocity of overland flow
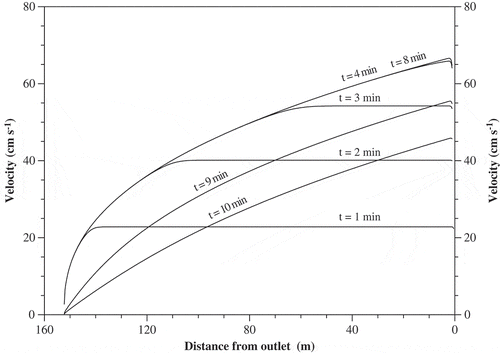
Previous studies (Abrahams et al. Citation1986, Maidment Citation1993, Kull and Feldman Citation1998, Grimaldi et al. Citation2012) have acknowledged the difficulty of measuring the runoff speed of overland flow in the whole study domain with a fine spatial resolution. Hence, some researchers have assumed constant velocity to compute travel time of the overland flow (Maidment Citation1993, Kull and Feldman Citation1998). However, the flow characteristics (such as flow depth in and flow velocity in , and ) of the overland flows are spatially varied (non-uniform) and can be unsteady before reaching equilibrium condition and after the cessation of the rainfall event. shows simulated velocity distributions from the upstream boundary to the downstream outlet at different simulation times for a concrete surface of 152.4 m (500 ft) by 0.3 m (1 ft) with a slope of 2% under a constant effective rainfall intensity of 189 mm h-1 (7.44 in h-1) with duration of 8 min. The length of the plot was discretized into 500 cells, and the x-axis represents the distance of each cell (grid) centre from the outlet (152.2 m for the upstream boundary cell and 0.2 m for the outlet cell). Before surface runoff reaches equilibrium condition (time t = 1, 2 and 3 min), flow velocity increases from the upstream cell (near zero velocity) towards downstream cells up to a certain distance and then becomes uniform. Therefore, before reaching equilibrium, there is a downstream portion with the front of fast moving particles and an upstream portion with slow moving particles trailing behind. At about 4 min, the uniform flow portion disappears, which indicates that the fast moving particles (front) from upstream have arrived at the outlet. From 4 to 8 min, the velocity distribution remains more or less the same and is spatially varied. When the rainfall stops at 8 min (), runoff velocities at all cells begin to decrease with time. The velocity distributions after the cessation of the rainfall event (t > 8 min) are spatially varied over the whole plot length and are different from the distributions prior to equilibrium (t < 4 min). In comparison to the velocity distributions for a steady rainfall event, velocity distributions of overland flow under unsteady rainfall intensities would be highly unsteady and spatially varied and are not graphically illustrated here.
Fig. 6 Simulated runoff velocity at different times (t = 1, 2, 3, 4, 8, 9 and 10 min) at each cell from upstream to downstream for a plot, 152.4 m long and 0.3 m wide, with a slope of 2%. The length of the plot is discretized into 500 cells.
Travel times
Based on spatially varied velocity distributions (for example, ), pollutant particles released at different locations on the plot would have different travel times reaching the outlet. The particles near the upstream boundary of the plot travel slowly until they travel to a certain distance away where they gradually start picking up velocity. Therefore, the travel time of a particle released or washed-off by the runoff near the upstream boundary would be significantly longer than the travel time of other particles released at the other middle locations of the plot. Hence, to correctly estimate the overall travel time of runoff/pollutant particles on a plot under a rainfall event, both the travel times of the slow-moving particles at the upstream boundary area and the fast-moving particles at the moving front should be considered. In this study, one particle is assigned for each computational cell and initiated when the rainfall begins, for example, the simulation domain of the plot for has 500 cells with 500 virtual particles used for PTM, i.e. 500 particles were tracked by DWMPT to determine the percentage of particles exiting the outlet in order to study various characteristic travel times for overland flow.
Including these slower particles near the upstream boundary makes the overall travel time of the plot longer. A similar argument also applies to discharge when it approaches equilibrium under a constant rainfall. It takes much longer time for discharge to reach equilibrium when the rate of change of discharge near equilibrium is very small (KC et al. Citation2014). Hence, to avoid this sensitivity of travel time to computational equilibrium (McCuen Citation2009), Tc is usually computed at the time less than 100% contribution of the watershed to peak discharge (Su and Fang Citation2004, Wong Citation2005, KC et al. Citation2014). Following similar arguments, characteristic travel times for 85%, 95% and 100% of particles arrival at the outlet were computed and were defined as Tt85, Tt95 and Tt100, respectively, based on the time when a specified percentage of particles have arrived at the outlet of the plot. It should be noted that the authors intended to choose some percentages less than 100%; however, the exact selection of Tt85 and Tt95 was arbitrary.
Time of concentration
Another commonly used hydrological time parameter (McCuen Citation2009), closely linked to travel time, is Tc. Despite its frequent use, Tc lacks a universally accepted definition and method to quantify it. Several definitions of Tc can be found in the literature along with several related estimation methods for each definition. Grimaldi et al. (Citation2012), using their case studies, have demonstrated that available approaches for the estimation of Tc may yield numerical predictions that differ from each other by up to 500%.
McCuen (Citation2009) divided multiple definitions of Tc into two broad categories; travel time for runoff particles reaching the watershed outlet and lag time relating to the distribution of rainfall and runoff. McCuen then divided the latter definition into six more computational methods for estimating Tc. However, the estimation of Tc by the latter definition requires knowledge of the distribution of the rainfall hyetograph and runoff hydrograph, which are not available for ungauged watersheds. Hence, Tc defined as the travel time of runoff has often been used in many previous studies and also in this study. Even though researchers as early as Mulvany (Citation1851) and Kuichling (Citation1889) to McCuen (Citation2009) defined Tc similarly, as the time it takes for runoff to travel from the most distant point along a hydraulic pathway in the watershed to the outlet, their computational implementation of estimating Tc differed. An indirect method such as hydrograph analysis is often used to estimate Tc and then develop Tc regression formulas with respect to certain independent variables.
Several researchers (Kuichling Citation1889, Hicks Citation1942, Muzik Citation1974) estimated Tc as the time until discharge from a given drainage area reaches equilibrium. Izzard and Hicks (Citation1946) defined Tc from the beginning of rainfall until runoff reaches 97% of the rainfall input rate. Wong (Citation2005) considered Tc as the time from the beginning of effective rainfall to the time when flow reaches 95% of the equilibrium discharge. Su and Fang (Citation2004) and KC et al. (Citation2014) determined Tc as the time from the beginning of effective rainfall to the time when the flow reaches 98% of the peak discharge. The same method is also used in this study to compute Tc.
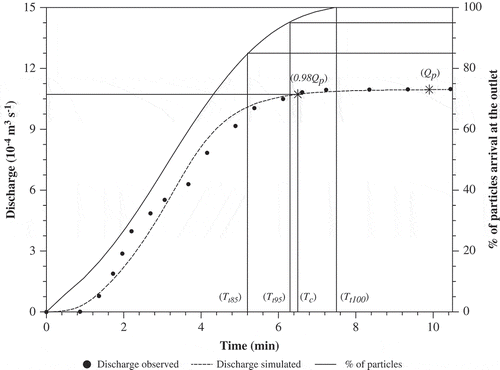
shows an example of how three characteristic travel times (Tt85, Tt95 and Tt100) and Tc were computed from either the percent of particles arrival at the outlet or from the outflow hydrograph. Both observed and simulated hydrographs are shown in for an asphalt pavement, 21.9 m long and 1.83 m wide with a slope of 0.1% and a rainfall of 98.3 mm h-1 for 11 min (Izzard and Augustine Citation1943). The occurrence times of 98% of peak discharges (Qp) and 100% Qp in the discharge hydrograph are shown in with three characteristic travel times (Tt85, Tt95, and Tt100). lists three Tc estimates (in min) using observed and simulated hydrographs and an empirical equation from KC et al. (Citation2014) for non-low slopes, and travel times Tt85, Tt95, and Tt100 (in min) derived from DWMPT for four rainfall events from Yu and McNown (Citation1963) and four events from Izzard and Augustine (Citation1943). Three Tc estimates agree well with each other. The estimates of travel times Tt85, Tt95, and Tt100 are different from Tc because travel times and Tc are computed using two separate methods. shows that Tt100 occurs when the discharge is near the equilibrium discharge and travel times Tt95 and Tt85 occur when the discharge approaches the equilibrium discharge. The rate of change of discharge over time near equilibrium is very small as shown in , however, it also depends on the input parameters. The discharge approaches the equilibrium faster when the plot length is shorter, the slope is steeper, the surface roughness is smaller, and the rainfall intensity is larger. as an example and for eight experiments show that Tc may correlate with Tt85 and Tt95, which will be further explored below.
Fig. 7 Observed and simulated hydrographs, percentage of total number of particles arrival at the outlet, and time of concentration (Tc), and travel times for 85% (Tt85), 95% (Tt95) and 100% (Tt100) particles arrival for an asphalt pavement, 21.9 m long and 1.83 m wide, with a slope of 0.1% and an effective rainfall of 98.3 mm h-1. The location occurrence times of 98% of peak discharge (Qp) and 100% of Qp in the discharge hydrograph are also shown. Observed hydrographs are from Izzard and Augustine (Citation1943).
In this study, the travel times are computed based on the percentage of particles arrival at the outlet using PTM coupled with DWM velocity simulation, which is to directly compute the travel time of particles through the simulation domain. However, Tc is computed from the discharge hydrograph as the time from the beginning of effective rainfall to the time when the flow reaches 98% of the peak discharge. Therefore, Tc directly depends on the flow depth of a single cell at the outlet. However, the travel times Tt85, Tt95 and Tt100 are consolidated time parameters synthesizing the arrival times of most or all particles at the outlet cell and are more representative time parameters to describe the movement of runoff/pollutant particles inside the simulation domain. To develop regression equations for estimating travel times (Tt85, Tt95 and Tt100), based on physically-based input parameters, provides a simple and easy method to determine the overall travel time characteristics of the overland flows. The parametric study to find the relationships between the travel times and the input variables (L, So, n, and i) is provided in the next section.
PARAMETRIC STUDY OF THE TRAVEL TIME OF OVERLAND FLOW
Several authors (Morgali and Linsley Citation1965, Woolhiser and Liggett Citation1967, Su and Fang Citation2004, KC et al. Citation2014) have derived estimation formulas using the four physically-based input variables: L, So, n, and i. Hence, the same input variables are chosen for parametric study computing travel times of overland flows. More than 530 separate values of each time parameter (Tc, Tt85, Tt95, and Tt100) were determined from numerical experiments using DWMPT by varying input variables, L, So, n, and i to extend the dataset available for regression analysis. The input variable L was varied from 5 to 305 m (16–1000 ft), So from 0.1% to 10%, n from 0.01 to 0.80, and i from 2.5 to 254 mm h-1 (0.1–10.0 in h-1). The numerical experiments were simulated holding the three variables constant and varying the fourth one by 10–20%.
A generalized power relation, equation (1) was chosen for developing the regression equations:
Fig. 8 Travel time for 85% of particles arrival at the outlet (Tt85) predicted using regression equation (2) vs Tt85 derived from numerical experiments using DWMPT for impervious overland flow planes.
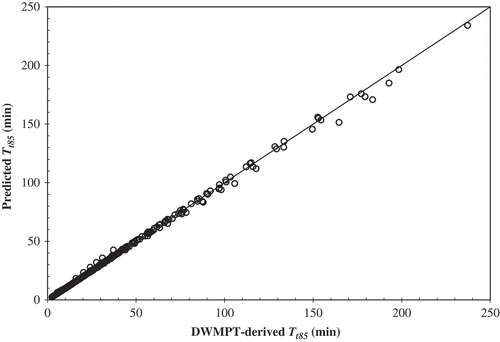
Table 3 Parameter estimates of the regression equation (2) for the independent variables of travel time for 85% of particles arrival at the outlet (Tt85) for impervious overland flow surfaces.
Similar regression analysis resulted following equations for Tt95:
Table 4 Statistical error parameters for regression equations of three time parameters (Tt85, Tt95, and Tt100) developed for impervious overland flow surfaces.
The time parameters Tc, Tt95, and Tt100 show a linear variation with Tt85 (). This is because the regression equation for Tc developed by KC et al. (Citation2014) has similar exponents to four input variables as the equations in . Hence, the time parameters Tc, Tt95, and Tt100 can also be expressed in linear relationships with Tt85 (). The equation for Tc in terms of Tt85 is:
Fig. 9 Time of concentration (Tc), travel times for 95% (Tt95) and 100% (Tt100) of particle arrival at the outlet vs travel time for 85% of particle arrival at the outlet (Tt85) developed from numerical experiments using DWMPT for impervious overland flow planes. Three linear regression lines between three time parameters (Tc, Tt95, and Tt100) and Tt85 are also shown.
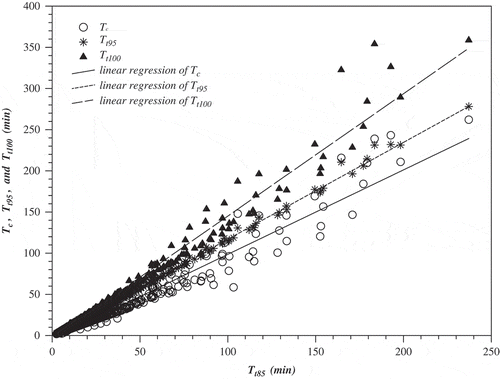
Table 5 Statistical error parameters for linear regression equations between three time parameters (Tc, Tt95, and Tt100) and Tt85 developed for impervious overland flow surfaces.
SUMMARY AND CONCLUSIONS
A quasi two-dimensional diffusion wave model with particle tracking, DWMPT, was developed from the diffusion hydrodynamic model DHM (Hromadka II and Yen Citation1986) for calculating the travel time of all the particles in the discretized domain of the impervious overland surface. A comprehensive validation of the model was performed using discharge, velocity and depth data from four different sources (Izzard and Augustine Citation1943, Yu and McNown Citation1963, Ben-Zvi Citation1984, Mügler et al. Citation2011). The travel times of all particles in the domain consisting of both slow moving particles at the upstream and fast moving particles at the downstream are considered in DWMPT, and consolidated representative time parameters Tt85, Tt95 and Tt100 are extracted. Based on the percentage of particles that have arrived at the outlet, travel times for 85%, 95% and 100% particles arrival at the outlet are defined as Tt85, Tt95 and Tt100, respectively. A total of 530 DWMPT runs were performed to determine travel times on impervious surfaces using diverse combinations of the four physically-based input variables L, So, n and i, and were used to develop estimation equations for Tt85, Tt95 and Tt100. All the travel times (Tt85, Tt95 and Tt100) showed nonlinear relationships with the input variables (L, So, n, and i) in equations (2), (3), and (4); and are directly proportional to L and n (both raised approximately to a power 0.6) and inversely proportional to So (raised approximately to a power 0.3) and i (raised approximately to a power 0.4). Similarly, Tc was estimated from hydrograph analysis as the time when outflow discharge reaches 98% of Qp, and Tt85 showed a close correlation with Tc as shown in equation (5) and can be used to estimate Tc. Even though all the travel times showed nonlinear relationships with the input variables, they showed linear relationships with each other in equations (6) and (7), and Tt95 can be approximately expressed as an average of Tt85 and Tt100.
Acknowledgements
The authors wish to express their thanks to the Texas Department of Transportation (TxDOT) and its members for their guidance and support for the study; and to the Civil Engineering Department at Auburn University for teaching assistantship support. The authors thank Dr A. Ben-Zvi and Dr C. Mugler for providing data; their data were used in and . The authors also thank Dr David B. Thompson and Dr Theodore Cleveland for their inputs to the study. The anonymous reviewers are thanked for their useful comments.
Additional information
Funding
Related Research Data
REFERENCES
- Abbott, M., et al., 1986. An introduction to the European hydrological system—Système hydrologique Européen, ‘SHE’, 2: structure of a physically-based, distributed modelling system. Journal of Hydrology, 87 (1–2), 61–77. doi:10.1016/0022-1694(86)90115-0.
- Abrahams, A.D., Parsons, A.J., and Luk, S.H., 1986. Field measurement of the velocity of overland flow using dye tracing. Earth Surface Processes and Landforms, 11 (6), 653–657. doi:10.1002/esp.3290110608.
- Admiraal, D.M., Stansbury, J.S., and Haberman, C.J., 2004. Case study: particle velocimetry in a model of lake Ogallala. Journal of Hydraulic Engineering, 130 (7), 599–607. doi:10.1061/(ASCE)0733-9429(2004)130:7(599).
- Adrian, R.J., 1991. Particle-imaging techniques for experimental fluid mechanics. Annual Review of Fluid Mechanics, 23 (1), 261–304. doi:10.1146/annurev.fl.23.010191.001401.
- Ahlstron, S.W., et al., 1977. Multicomponent mass transport model: theory and numerical implementation (discrete-parcel-random walk version). Richland, WA: Battelle Pacific Northwest Lab. BNWL 2127.
- Akan, A.O. and Yen, B.C., 1984. Effect of time distribution of rainfall on overland runoff. In proceedings of the third international conference on urban storm drainage, June 4–8 1984. Goteborg, Sweden, 193–202.
- Amsden, A.A., 1966. The particle-in-cell method for calculation of the dynamics of compressible fluids. Los Angeles, CA: Los Alamos Scientific Laboratory, University of California.
- Bennis, S. and Crobeddu, E., 2007. New runoff simulation model for small urban catchments. Journal of Hydrologic Engineering, 12 (5), 540–544. doi:10.1061/(ASCE)1084-0699(2007)12:5(540).
- Ben-Zvi, A., 1984. Runoff peaks from two-dimensional laboratory watersheds. Journal of Hydrology, 68 (1–4), 115–139. doi:10.1016/0022-1694(84)90207-5.
- Berman, E.S., et al., 2009. High-frequency field-deployable isotope analyzer for hydrological applications. Water Resources Research, 45 (10), W10201. doi:10.1029/2009WR008265.
- Bradley, A.A., et al., 2002. Flow measurement in streams using video imagery. Water Resources Research, 38 (12), 51-1–51-8. doi:10.1029/2002WR001317.
- Chang, T.P.K., Watson, A.T., and Tatterson, G.B., 1985. Image processing of tracer particle motions as applied to mixing and turbulent flow – I. The technique. Chemical Engineering Science, 40 (2), 269–275. doi:10.1016/0009-2509(85)80066-X.
- Chen, C.N. and Wong, T.S.W., 1993. Critical rainfall duration for maximum discharge from overland plane. Journal of Hydraulic Engineering, 119 (9), 1040–1045. doi:10.1061/(ASCE)0733-9429(1993)119:9(1040).
- Chow, V.T., 1967. Laboratory study of watershed hydrology. In Proc. Int. Hydrol. Symp. Fort Collins, Colo., 194–202.
- Cleveland, T.G., et al., 2008. Synthesis of unit hydrographs from a digital elevation model. Journal of Irrigation and Drainage Engineering, 134 (2), 212–221. doi:10.1061/(ASCE)0733-9437(2008)134:2(212).
- Doan, J.H., 2000. Geospatial hydrologic modeling extension HEC-GeoHMS – user’s manual – version 1.0. Davis, CA: US Army Corps of Engineers Hydrologic Engineering Center.
- Dunkerley, D.L., 2003. An optical tachometer for short-path measurement of flow speeds in shallow overland flows: improved alternative to dye timing. Earth Surface Processes and Landforms, 28 (7), 777–786. doi:10.1002/esp.468.
- Dunne, T. and Dietrich, W.E., 1980. Experimental investigation of horton overland flow on tropical hillslopes: II. Hydraulic characteristics and hillslope hydrographs. Zeitschrift für Geomorphologie Supplement, 35, 60–80.
- Emmett, W., 1970. The hydraulics of overland flow on hillslopes. US Geological Survey, Professional Paper 662A. Washington, DC: United States Government Printing Office.
- Esteves, M., et al., 2000. The ‘EMIRE’ large rainfall simulator: design and field testing. Earth Surface Processes and Landforms, 25, 681–690. doi:10.1002/1096-9837(200007)25:7<681::AID-ESP124>3.0.CO;2-8.
- Froehlich, D.C., 2011. NRCS overland flow travel time calculation. Journal of Irrigation and Drainage Engineering, 137 (4), 258–262. doi:10.1061/(ASCE)IR.1943-4774.0000287.
- Gardner, R.P. and Dunn, J.W. III, 1964. A single-sample radiotracer technique for determining stream flow rates. The International Journal of Applied Radiation and Isotopes, 15 (6), 339–344. doi:10.1016/0020-708X(64)90123-1.
- Govers, G., 1992. Relationship between discharge, velocity and flow area for rills eroding loose, non-layered materials. Earth Surface Processes and Landforms, 17 (5), 515–528. doi:10.1002/esp.3290170510.
- Grimaldi, S., et al., 2010. Flow time estimation with spatially variable hillslope velocity in ungauged basins. Advances in Water Resources, 33 (10), 1216–1223. doi:10.1016/j.advwatres.2010.06.003.
- Grimaldi, S., et al., 2012. Time of concentration: a paradox in modern hydrology. Hydrological Sciences Journal, 57 (2), 217–228. doi:10.1080/02626667.2011.644244.
- Harlow, F.E., 1963. The particle-in-cell method for numerical solution of problems in fluid dynamics. Proceedings of Symposia in Applied Mathematics, 15, 269.
- Harlow, F.H. and Welch, J.E., 1966. Numerical study of large amplitude free surface motions. Physics of Fluids, 9 (5), 842–851. doi:10.1063/1.1761784.
- Henderson, F.M. and Wooding, R.A., 1964. Overland flow and groundwater flow from a steady rainfall of finite duration. Journal of Geophysical Research, 69 (8), 1531–1540. doi:10.1029/JZ069i008p01531.
- Hicks, W.I., 1942. Discussion of “Surface runoff determination from rainfall without using coefficients. W.W. Horner and S.W. Jens, eds. Transactions of the ASCE, 107, 1097–1102.
- Hromadka, T.V. II and Yen, C.C., 1986. A diffusion hydrodynamic model (DHM). Advances in Water Resources, 9 (3), 118–170. doi:10.1016/0309-1708(86)90031-X.
- Hu, G.-Q., et al., 2011. Laboratory testing of magnetic tracers for soil erosion measurement. Pedosphere, 21 (3), 328–338. doi:10.1016/S1002-0160(11)60133-1.
- Ivanov, V.Y., et al., 2004. Preserving high-resolution surface and rainfall data in operational-scale basin hydrology: a fully-distributed physically-based approach. Journal of Hydrology, 298 (1–4), 80–111. doi:10.1016/j.jhydrol.2004.03.041.
- Izzard, C.F. and Augustine, M.T., 1943. Preliminary report on analyses of runoff resulting from simulated rainfall on a paved plot. Transactions, American Geophysical Union, 24 (2), 500–509. doi:10.1029/TR024i002p00500.
- Izzard, C.F. and Hicks, W.I., 1946. Hydraulics of runoff from developed surfaces. In: 26th annual meetings of the highway research board, 5–8 December, Washington, DC, 129–150.
- Jia, Y., et al., 2001. Development of WEP model and its application to an urban watershed. Hydrological Processes, 15 (11), 2175–2194. doi:10.1002/hyp.275.
- Kazezyılmaz-Alhan, C.M. and Medina Jr, M.A., 2007. Kinematic and diffusion waves: analytical and numerical solutions to overland and channel flow. Journal of Hydraulic Engineering, 133 (2), 217–228. doi:10.1061/(ASCE)0733-9429(2007)133:2(217).
- KC, M., et al., 2014. Improved time of concentration estimation on overland flow surfaces including low-sloped planes. Journal of Hydrologic Engineering, 19 (3), 495–508. doi:10.1061/(ASCE)HE.1943–5584.0000830.
- Kent, K.M., 1972. Travel time, time of concentration and lag. National engineering hand book—Hydrology, Section 4, Chapter 15. Washington, DC: US Department of Agriculture, 1–16.
- Konikow, L.F. and Bredehoeft, J.D., 1978. Computer model of 2-dimensional solute transport and dispersion in groundwater. Washington, DC: US Geological Survey.
- Kuichling, E., 1889. The relation between the rainfall and the discharge of sewers in populous areas. Transactions, American Society of Civil Engineers, 20, 1–56.
- Kull, D.W. and Feldman, A.D., 1998. Evolution of Clark’s unit graph method to spatially distributed runoff. Journal of Hydrologic Engineering, 3 (1), 9–19. doi:10.1061/(ASCE)1084-0699(1998)3:1(9).
- Landreth, C., Adrian, R., and Yao, C., 2004. Double pulsed particle image velocimeter with directional resolution for complex flows. Experiments in Fluids, 6 (2), 119–128. doi:10.1007/BF00196463.
- Legates, D.R. and McCabe, G.J., 1999. Evaluating the use of “goodness-of-fit” measures in hydrologic and hydroclimatic model validation. Water Resources Research, 35 (1), 233–241. doi:10.1029/1998WR900018.
- Lei, T., et al., 2010. An improved method for shallow water flow velocity measurement with practical electrolyte inputs. Journal of Hydrology, 390 (1–2), 45–56. doi:10.1016/j.jhydrol.2010.06.029.
- Liu, Z.C., et al., 1991. High resolution measurement of turbulent structure in a channel with particle image velocimetry. Experiments in Fluids, 10 (6), 301–312. doi:10.1007/BF00190246.
- Liu, Y.B., et al., 2003. A diffusive transport approach for flow routing in GIS-based flood modeling. Journal of Hydrology, 283 (1–4), 91–106. doi:10.1016/S0022-1694(03)00242-7.
- López-Barrera, D., et al., 2012. Diffusive-wave based hydrologic-hydraulic model with sediment transport. I: model development. Journal of Hydrologic Engineering, 17 (10), 1093–1104. doi:10.1061/(ASCE)HE.1943-5584.0000552.
- Luo, W. and Harlin, J., 2003. A theoretical travel time based on watershed hypsometry. Journal of the American Water Resources Association, 39 (4), 785–792. doi:10.1111/j.1752-1688.2003.tb04405.x.
- Maidment, D.R., 1993. Developing a spatially distributed unit hydrograph by using GIS. Proceedings of the Vienna Conference, HydroGIS, 93, 181–192.
- McCuen, R.H., 2009. Uncertainty analyses of watershed time parameters. Journal of Hydrologic Engineering, 14 (5), 490–498. doi:10.1061/(ASCE)HE.1943-5584.0000011.
- McCuen, R.H. and Spiess, J.M., 1995. Assessment of kinematic wave time of concentration. Journal of Hydraulic Engineering, 121 (3), 256–266. doi:10.1061/(ASCE)0733-9429(1995)121:3(256).
- McCuen, R.H., Wong, S.L., and Rawls, W.J., 1984. Estimating urban time of concentration. Journal of Hydraulic Engineering, 110 (7), 887–904. doi:10.1061/(ASCE)0733-9429(1984)110:7(887).
- Meselhe, E., Peeva, T., and Muste, M., 2004. Large scale particle image velocimetry for low velocity and shallow water flows. Journal of Hydraulic Engineering, 130 (9), 937–940. doi:10.1061/(ASCE)0733-9429(2004)130:9(937).
- Moramarco, T. and Singh, V.P., 2002. Accuracy of kinematic wave and diffusion wave for spatial-varying rainfall excess over a plane. Hydrological Processes, 16 (17), 3419–3435. doi:10.1002/hyp.1108.
- Morgali, J.R. and Linsley, R.K., 1965. Computer analysis of overland flow. Journal of Hydraulics Division, 91 (HY3), 81–100.
- Mügler, C., et al., 2011. Comparison of roughness models to simulate overland flow and tracer transport experiments under simulated rainfall at plot scale. Journal of Hydrology, 402 (1–2), 25–40. doi:10.1016/j.jhydrol.2011.02.032.
- Mulvany, T.J., 1851. On the use of self-registering rain and flood gauges in making observations of the relations of rainfall and flood discharges in a given catchment. Proceedings of the Institution of Civil Engineers of Ireland, 4 (2), 18–33.
- Muzik, I., 1974. Laboratory experiments with surface runoff. Journal of the Hydraulics Division, 100 (4), 501–516.
- Niri, M.Z., et al., 2012. Derivation of travel time based on diffusive wave approximation for the time-area hydrograph simulation. Journal of Hydrologic Engineering, 17 (1), 85–91. doi:10.1061/(ASCE)HE.1943-5584.0000399.
- Noto, L. and La Loggia, G., 2007. Derivation of a distributed unit hydrograph integrating GIS and remote sensing. Journal of Hydrologic Engineering, 12 (6), 639–650. doi:10.1061/(ASCE)1084-0699(2007)12:6(639).
- Olivera, F. and Maidment, D.R., 1999. Geographic information systems (GIS)-based spatially distributed model for runoff routing. Water Resources Research, 35 (4), 1155–1164. doi:10.1029/1998WR900104.
- Pilgrim, D.H., 1976. Travel times and nonlinearity of flood runoff from tracer measurements on a small watershed. Water Resources Research, 12 (3), 487–496. doi:10.1029/WR012i003p00487.
- Planchon, O., et al., 2005. An automated salt-tracing gauge for flow-velocity measurement. Earth Surface Processes and Landforms, 30 (7), 833–844. doi:10.1002/esp.1194.
- Prickett, T.A., Naymik, T.G., and Lonnquist, C.G., 1981. A random walk solute transport model for selected groundwater quality evaluations. Champaign, IL: Illinois Water Survey Bulletin 65.
- Raffel, M., Willert, C.E., and Kompenhans, J., 1998. Particle image velocimetry: a practical guide. New York: Springer.
- Roels, J.M., 1984. Flow resistance in concentrated overland flow on rough slope surfaces. Earth Surface Processes and Landforms, 9 (6), 541–551. doi:10.1002/esp.3290090608.
- Rouhipour, H., et al., 1999. Roughness coefficients and velocity estimation in well-inundated sheet and rilled overland flow without strongly eroding bed forms. Earth Surface Processes and Landforms, 24 (3), 233–245. doi:10.1002/(SICI)1096-9837(199903)24:3<233::AID-ESP949>3.0.CO;2-T.
- Saghafian, B. and Julien, P., 1995. Time to equilibrium for spatially variable watersheds. Journal of Hydrology, 172 (1–4), 231–245. doi:10.1016/0022-1694(95)02692-I.
- Saghafian, B., Julien, P.Y., and Rajaie, H., 2002. Runoff hydrograph simulation based on time variable isochrone technique. Journal of Hydrology, 261 (1–4), 193–203. doi:10.1016/S0022-1694(02)00007-0.
- Singh, V., 1976. Derivation of time of concentration. Journal of Hydrology, 30 (1–2), 147–165. doi:10.1016/0022-1694(76)90095-0.
- Singh, V.P. and Aravamuthan, V., 1995. Accuracy of kinematic wave and diffusion wave approximations for time-independent flows. Hydrological Processes, 9 (7), 755–782. doi:10.1002/hyp.3360090704.
- Singh, V.P., Jain, S.K., and Sherif, M.M., 2005. Errors of kinematic wave and diffusion wave approximations for time-independent flows with infiltration and momentum exchange included. Hydrological Processes, 19 (9), 1771–1790. doi:10.1002/hyp.5633.
- Smedt, D.F., Yongbo, L., and Gebremeskel, S., 2000. Hydrologic modeling on a catchment scale using GIS and remote sensed land use information. In: C.A. Brebbia, ed. Risk Analysis II. Southampton: WIT Press, 295–304.
- Su, D.H. and Fang, X., 2004. Estimating traveling time of flat terrain by 2-dimensional overland flow model. In: G. Jirka and W. Uijttewaal, eds. Shallow flows. Roterdam: Balkema, 623–625.
- Tatard, L., et al., 2008. Measurement and modelling of high-resolution flow-velocity data under simulated rainfall on a low-slope sandy soil. Journal of Hydrology, 348 (1–2), 1–12. doi:10.1016/j.jhydrol.2007.07.016.
- Tauro, F., et al., 2010. Characterization of buoyant fluorescent particles for field observations of water flows. Sensors, 10 (12), 11512–11529. doi:10.3390/s101211512.
- Tauro, F., et al., 2012a. Fluorescent particle tracers in surface hydrology: a proof of concept in a semi-natural hillslope. Hydrology and Earth System Sciences, 16 (8), 2973–2983. doi:10.5194/hess-16-2973-2012.
- Tauro, F., et al., 2012b. Tracing of shallow water flows through buoyant fluorescent particles. Flow Measurement and Instrumentation, 26 (0), 93–101. doi:10.1016/j.flowmeasinst.2012.03.007.
- Taylor, T.D., 1983. Computational methods for fluid flow. New York: Springer-Verlag.
- Tingwu, L., et al., 2005. Method for measuring velocity of shallow water flow for soil erosion with an electrolyte tracer. Journal of Hydrology, 301 (1–4), 139–145. doi:10.1016/j.jhydrol.2004.06.025.
- Ventura Jr, E., Nearing, M.A., and Norton, L.D., 2001. Developing a magnetic tracer to study soil erosion. CATENA, 43 (4), 277–291. doi:10.1016/S0341-8162(00)00149-1.
- Weitbrecht, V., Kühn, G., and Jirka, G.H., 2002. Large scale PIV-measurements at the surface of shallow water flows. Flow Measurement and Instrumentation, 13 (5–6), 237–245. doi:10.1016/S0955-5986(02)00059-6.
- Wong, T.S.W., 1996. Time of concentration and peak discharge formulas for planes in series. Journal of Irrigation and Drainage Engineering, 122 (4), 256–258. doi:10.1061/(ASCE)0733-9437(1996)122:4(256).
- Wong, T.S.W., 2005. Assessment of time of concentration formulas for overland flow. Journal of Irrigation and Drainage Engineering, 131 (4), 383–387. doi:10.1061/(ASCE)0733-9437(2005)131:4(383).
- Woolhiser, D.A. and Liggett, J.A., 1967. Unsteady one-dimensional flow over a plane-the rising hydrograph. Water Resources Research, 3 (3), 753–771. doi:10.1029/WR003i003p00753.
- Yeh, G.T., et al., 1998. A numerical model simulating water flow and contaminant and sediment transport in watershed systems of 1-D stream-river network, 2-D overland regime, and 3-D subsurface media (WASH123D: Version 1.0). US Army Corps of Engineers, Technical Report CHL-98-19.
- Yen, B.C. and Chow, V.T., 1983. Local design storms: Vol III. Washington, DC: US Department of Transportation, Federal Highway Administration, H 38 FHWA-RD-82/065.
- Yu, Y.S. and McNown, J.S., 1963. Runoff from impervious surfaces. Lawrence, KS: University of Kansas, 2–66.