
Abstract
Two river catchments, the Huangfuchuan and the Hailiutu, located in the same climate zone in the Erdos Plateau, China, have distinctly different flow regimes. This study systematically compared differences between the flow regimes of these two catchments using several statistical methods, and analysed the possible causes. The variations in yearly, monthly and daily mean discharges were found to be much greater in the Huangfuchuan catchment than in the Hailiutu catchment. Preliminary analysis indicated that these differences are not caused by changes in climate, but are instead attributable to differences in geology, geomorphology, hydrological processes and human interventions. In the Hailiutu catchment, the dominant groundwater contribution maintains stationary daily and monthly river discharges, while shifts in yearly mean discharges were closely associated with the expansion or reduction of crop area. In the Huangfuchuan catchment, the dominant direct rainfall–runoff process generates flashier daily and monthly river discharges, while the decrease of yearly mean discharges is caused mainly by the construction of check dams. These findings have significant implications for water resource management and the implementation of proper soil and water conservation measures in the middle reach of the Yellow River Basin of China.
Editor Z.W. Kundzewicz; Associate editor Y. Gyasi-Agyei
Résumé
Les bassins versants deux rivières, la Huangfuchuan et la Hailiutu, situés dans la même zone climatique du plateau d’Erdos, dans le Nord-Ouest de la Chine, ont des régimes d’écoulement nettement différents. Cette étude compare les différences entre les régimes d’écoulement de ces deux bassins en utilisant plusieurs méthodes statistiques et en analyse les causes possibles. Les variations des débits moyens annuels, mensuels et journaliers sont plus importantes dans le bassin versant de Huangfuchuan que dans celui de Hailiutu. Une analyse préliminaire montre que ces différences ne sont pas causées par les changements climatiques, mais sont plutôt attribuables à des différences de la géologie, de la géomorphologie, des processus hydrologiques et des interventions humaines. Dans le bassin de Hailiutu, la contribution dominante des eaux souterraines maintient des débits journaliers et mensuels stationnaires, tandis que les modifications des débits moyens annuels sont étroitement associées à l’expansion ou à la réduction de la superficie cultivée. Dans le bassin de Huangfuchuan, le processus dominant d’écoulement direct génère des débits quotidiens et mensuels rapides, tandis que la baisse des débits moyens annuels est causée principalement par la construction de barrages de retenue. Ces résultats ont des implications importantes pour la gestion des ressources en eau et la mise en œuvre de mesures de conservation des eaux et des sols dans le bief moyen du fleuve Jaune en Chine.
1 INTRODUCTION
River flow regimes have been altered worldwide by human activities and climate change (Matheussen et al. Citation2000, Bergström Citation2001, Yang et al. Citation2004, Gibson et al. Citation2005, Hu et al. Citation2005, Thodsen Citation2007, Bejarano et al. Citation2010, Lavers et al. Citation2010, Doll and Schmeid Citation2012). The Yellow River of China is prominent among altered rivers. Due to climate change and human activity in recent decades, the Yellow River discharge has fallen to zero many times since 1960, with devastating impacts on downstream water use and ecosystems (Liang et al. Citation2010). Several tributaries join the Yellow River where it flows around the Erdos Plateau, increasing not only the flow discharge but also sediment concentrations. The Erdos Plateau consists of two distinct geomorphic regions: the Maowusu Desert in the northwest and the Loess Plateau in the southeast. The Loess Plateau is one of the most severely eroded areas in the world, due to its loose loess soils, steep slopes, high rainfall intensity and poor vegetation (Rustomji et al. Citation2008, Feng et al. Citation2010). In the desert and semi-desert region, however, erosion is not a major concern; instead, desertification and dust storms have been identified as the most severe problems (Wang et al. Citation2010). Thus, semi-desert regions require different measures for soil, water and ecosystem conservation than do loess hill ravines.
To combat soil erosion and desertification in the area, China has implemented soil conservation and desertification prevention measures since the 1950s. The soil erosion control measures comprise converting gentle sloping farmland to terraces, returning steep farmland to nature, and constructing check dams (also called sediment trapping dams) in gullies. The desert prevention measures comprise vegetating sand dunes, returning farmland to forest and grassland, and keeping cattle and sheep in stalls. The landscape in the Erdos Plateau is largely modified. Regional-scale landscape modifications have had profound effects on river discharge and sediment yields. Statistical analyses of long-term river sediment concentrations have identified a significant trend of decreasing river sediment loads in the coarse sandy, hilly areas of the Loess Plateau since the late 1970s (Xu Citation2004, Citation2010, Rustomji et al. Citation2008). Similar decreasing trends in river discharge have also been detected (Huang and Zhang Citation2004, McVicar et al. Citation2007, Mu et al. Citation2007, Zhang et al. Citation2008, Yang et al. Citation2012). Soil and water conservation measures have reduced both river discharges and sediment concentrations.
However, there are few inter-catchment comparisons that explore the influences of geological and geomorphologic characteristics on river flow regime changes under the impacts of climate variability and human activities. Huang et al. (Citation1999) compared the hydrological behaviours of forest and grassland watersheds in the Loess Plateau and found that the forest watershed had less discharge than the grassland watershed. Qian et al. (Citation2004) found that the baseflow index of the loess hill ravine region was less than that of the Maowusu semi-desert area. Chang and Zhang (Citation2008) indicated that the Kuyehe River discharge in the loess hill ravine region is influenced mainly by precipitation and responds rapidly to rainfall events. They also found that discharge from rivers originating in blown-sand grasslands are mainly fed by groundwater discharge and have smaller fluctuations. The factors that control the differences in river flow regimes between semi-desert and loess hill ravine regions have not been thoroughly investigated, and their different hydrological responses to climate change and human activities have not been compared. Understanding how flow regime changes correspond to geological and morphological conditions facilitates the implementation of appropriate and effective soil and water conservation measures in river basins. This study compared the flow regimes of two rivers from the Erdos Plateau: one from the Loess Plateau (Huangfuchuan River) and another from the Maowusu semi-desert (Hailiutu River). We used statistical methods to analyse various hydrological responses to climate factors and human activities. Geological and geomorphologic factors controlling these differences were explored. The results show that these two catchments are located in the same climate zone, but have distinctly different flow regimes. The findings have significant implications for water resource management and the implementation of proper soil and water conservation measures in the middle reach of the Yellow River Basin of China.
2 MATERIALS AND METHODS
2.1 Study area
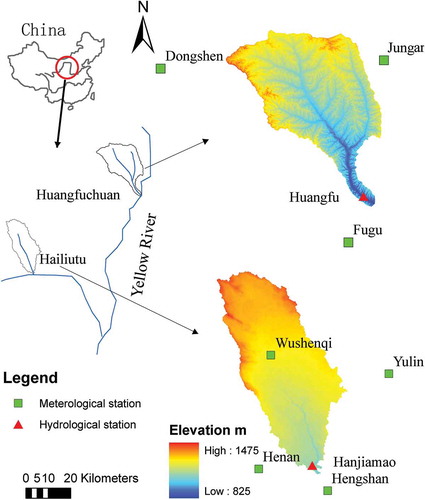
Two medium-size river catchments were investigated in this study: the Hailiutu and the Huangfuchuan (). These two catchments are located in the same climate zone, but in different geological and geomorphologic environments. The Hailiutu River catchment (38°02′–38°50′N, 108°37′–109°19′E) lies in the Maowusu semi-desert, while the Huangfuchuan River catchment (39°12′–39°54′N; and 110°8′–111°59′E) is located in the loess hill ravine region. The catchment areas of the Hailiutu and Huangfuchuan are 2645 and 3240 km2, respectively. Significant differences in topography can be observed between the two catchments (). The geomorphology of the Hailiutu catchment is characterized by undulating sand dunes, low hills at the northern and western water divide, and one primary river valley in the downstream area. The area is relatively flat, and the stream network is limited to one main river and one branch in the Hailiutu catchment. Meanwhile, the geomorphology of the Huangfuchuan catchment is characterized by high hills, deep valleys, and steep slopes. The stream networks are well developed, with up to third-order branch rivers in the Huangfuchuan catchment.
Fig. 1 Catchment map of the Hailiutu and Huangfuchuan rivers.
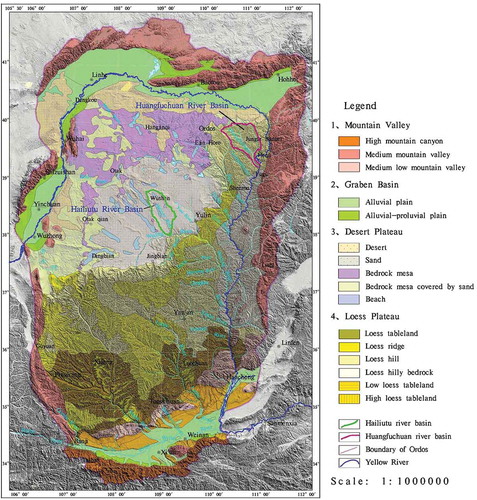
The geology of the two catchments is also very different (). The geology of the Hailiutu catchment is uniform, with Cretaceous sandstones covered by aeolian sand dunes in the entire catchment. In contrast, there are three distinct geological areas in the Huangfuchuan catchment: aeolian sand dunes underlain by loess in the upper catchment, Jurassic sandstone and mudstone overlain by loess in the middle catchment, and a loess plateau in the lower catchment.
Fig. 2 Geomorphological map of the Erdos Plateau (from the Xi’an Geological Survey Centre).
The two catchments belong to the same continental semi-arid climate zone. The summer (June–August) is hot, with average daily temperatures above 20°C. The winter (November–March) is cold, with average daily temperatures below zero. The long-term average annual precipitation is approximately 350–400 mm/year. Total rainfall in the rainy season (June–September) accounts for approximately 80% of the annual rainfall. The long-term average annual pan evaporation is 2400 and 2000 mm/year in the Hailiutu and Huangfuchuan catchments, respectively.
2.2 Data
There are three meteorological stations around the Huangfuchuan catchment, and three stations around and one inside the Hailiutu catchment (). For all of these stations, daily rainfall, daily average temperature and daily pan evaporation data are available from 1959 to 2005. Daily mean discharge measurements from 1957 to 2007 were available at the Hanjiamao gauging station in the Hailiutu catchment and at the Huangfu gauging station in the Huangfuchuan catchment (). In the Hanjiamao station, daily rainfall measurements were also available from 1959 to 2007. All these data were kindly provided by the Yellow River Conservancy Commission. A digital elevation model (DEM) at 90 m resolution was derived from 1:50 000-scale topographic maps for both catchments. The DEM data were used to compute the topographic parameters, such as surface slope and drainage density. The Landsat-5 TM (thematic mapper) image of 10 July 2010, at 30-m resolution, was obtained from a shared dataset provided by the International Scientific Data Service Platform, Computer Network Information Centre, Chinese Academy of Sciences (http://datamirror.csdb.cn/). Normalized difference vegetation index (NDVI) values were derived from the image and converted to a land cover map (Lv et al. Citation2013).
2.3 Methods
Differences in river discharge between the Hailiutu and Huangfuchuan catchments were analysed for annual, monthly and daily mean discharge.
Most studies have used the Pettitt test to detect a regime shift (or a change point) in river flows (Zhang et al. Citation2008, Love et al. Citation2010). However, the Pettitt test can only detect a single change point in a time series and is not applicable for time series composed of multiple change points. In this study, two regime shift detectors were applied to detect multiple regime shifts in annual mean discharge in the Hailiutu and Huangfuchuan catchments: the cumulative sum (CUSUM) chart with a bootstrap analysis (Taylor Citation2000a) and the regime shift index (RSI; Rodionov Citation2004). The CUSUM chart plots the cumulative sum of deviations of successive sample values from the mean. A sudden change in the direction of the CUSUM chart indicates a sudden shift in the mean. Change-Point Analyzer Software is available to detect change points, together with both confidence levels and confidence intervals for each change (Taylor Citation2000b). The RSI is a sequential algorithm to estimate the regime shift by statistically testing the means of the previous subsets and subsequent datasets. The regime shift point is identified when the means are significantly different. This point is considered to be the possible starting point of the new regime. A piece of add-in software for Microsoft Excel (RSI) is available to perform regime shift detection (http://www.beringclimate.noaa.gov/regimes/). Yang et al. (Citation2012) detected multiple shifts in annual mean discharges in the Hailiutu catchment using CUSUM and RSI.
The periodic characteristics of monthly mean discharge were analysed using a harmonic series (Zhou Citation1996). The periodicity, magnitude and phase shift of the harmonic components were investigated to contrast the differences between monthly discharge series in the Hailiutu and Huangfuchuan catchments.
The differences in daily mean discharges were analysed by constructing flow duration curves (FDC). Flow duration curves have been widely used to analyse changes of daily flow characteristics (Zhang et al. Citation2008) or differences in daily flow characteristics between catchments (McMahon et al. Citation2008).
To explore whether climate factors are plausible causes of flow regime differences between the two catchments, a number of statistical methods were used. First, the regime shift detectors (CUSUM and RSI) were applied to test whether annual precipitation, annual pan evaporation and annual average daily temperature also present similar trends. Second, statistical descriptors (mean, variance, skewness, coefficient of variation) of climate factors were computed and compared. Third, the Student t-test for the difference in means and the F-test for the difference in variances of climate factors between the two catchments were performed. Fourth, correlation coefficients of climate factors between the two catchments were evaluated.
To diagnose the effects of catchment characteristics on flow regime differences, differences in land cover were evaluated by converting NDVI values to vegetation types for each catchment (Lv et al. Citation2013). The differences in topographic controls of flow regime were analysed by computing topographic indices with high resolution DEM data (Merz and Blöschl Citation2009, Tetzlaff et al. Citation2009, Capell et al. Citation2012). In this study, drainage density was calculated, and the surface slopes were classified and compared between two catchments.
Although differences in geology can indicate that groundwater may be contributing to flow regime differences, streamflow recession and baseflow separation can provide quantitative assessment (Chapman Citation1999, Wittenberg and Sivapalan Citation1999, Kirchner Citation2009). In this study, the automated hydrograph separation tool HYSEP (Sloto and Crouse Citation1996) was used to separate baseflow from daily average river discharge using three baseflow separation methods: fixed interval, sliding interval and local minimum. The ratio of baseflow to total discharge is defined as the baseflow index (BFI). The annual average baseflow indices of the two catchments were computed and compared.
Finally, a multiple regression analysis was used to ascertain the relative effects of climate variables and human activities on annual flow regimes in both catchments.
3 ANALYSIS OF DIFFERENCES IN FLOW REGIMES
3.1 Differences in annual mean discharges
Regime shift detectors (CUSUM and RSI) were used to detect multiple change points in the annual mean river discharge of the Hailiutu and Huangfuchuan catchments. Four flow regime shift points were detected in 1968, 1986, 1992 and 2001 in the Hailiutu River discharges ()). These flow regime shifts were caused largely by land-use policy changes (Yang et al. Citation2012). Two flow regime shift points were detected at 1968 and 1999 in the Huangfuchuan River discharges ()). However, Zhang et al. (Citation2008) detected only one change point there, in 1982, using the Pettitt test. It seems likely that the Pettitt test was not able to detect multiple change points and instead indicated a compromise change point between two real change points. The first change point in 1968 corresponded to a point in the Hailiutu catchment. However, the cause of this change point in the Huangfuchuan catchment was most likely terrace construction. Though flow has increased since 2001 in the Hailiutu catchment, the annual mean discharge has decreased since 1999 in the Huangfuchuan catchment. This latter flow regime shift was caused mainly by the construction of check dams for soil conservation (Wang et al. Citation2012). Furthermore, the inter-annual variation in annual mean discharge (deviations from the step trends) in the Huangfuchuan River is much larger than those of the Hailiutu River ()). The standard deviation of the variations in annual mean discharges in the Huangfuchuan River is 2.44 m3/s, while it is only 0.28 m3/s for the Hailiutu River. The F statistical test for the difference in variances confirms that the variance of annual mean discharges in Huangfuchuan River is significantly greater than the variance in the Hailiutu River, at a 99% confidence.
Fig. 3 Flow regime shifts of annual mean discharges of (a) the Hailiutu River (four flow regime change points in 1968, 1986, 1992 and 2001); (b) the Huangfuchuan River (two flow regime change points in 1968 and 1999); and (c) departures of annual mean discharges from their step trends.
3.2 Differences in monthly mean discharge
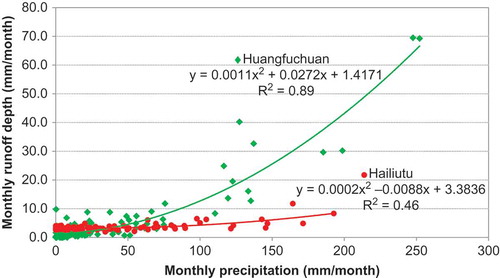
Differences in monthly mean discharge were compared with discharge measurements under natural situations in the period 1959–1967. The responses of monthly runoff depth to monthly precipitation are clearly different between the two catchments in the scatter plot (). When the monthly precipitation is less than around 50 mm/m, the monthly runoff depth in the Hailiutu catchment is stationary around 3 mm/m, while the monthly runoff depth in the Huangfuchuan catchment varies greatly with the minimum zero depth. When monthly precipitation increases beyond 50 mm/m, monthly runoff depth in the Huangfuchuan catchment increases much faster than in the Hailiutu catchment. This means that a greater percentage of heavy rainfall is converted to direct runoff in the Huangfuchuan catchment than in the Hailiutu catchment.
Fig. 4 Scatter plot of monthly mean discharge (runoff depth in mm) vs monthly precipitation in the Huangfuchuan and Hailiutu catchments.
Statistical characteristics of monthly mean discharges from 1959 to 1967 were calculated for the two catchments (). The coefficient of variation in the Huangfuchuan River was more than six times greater than that in the Hailiutu River. The Spearman correlation coefficient between the monthly mean discharge and monthly precipitation was only 0.20 for the Hailiutu River, but as high as 0.74 for the Huangfuchuan River. Statistical tests for differences in the means (t-test) and variance (F-test) indicate that both the monthly mean discharge and the variance in the Huangfuchuan River are significantly larger than those in the Hailiutu River, at a 99% level of confidence. It is clear that the variation in monthly mean discharge in the Huangfuchuan River is greater than that in the Hailiutu River.
Table 1 Statistical characteristics of river discharges.
The harmonic analysis identified dominant seasonal fluctuations in the two rivers. The Huangfuchuan River had larger seasonal fluctuations than those of the Hailiutu River (). The amplitude of the annual periodic fluctuation in the Huangfuchuan River is 15 times larger than that in the Hailiutu River. The monthly mean discharges in the Hailiutu River had smaller peaks in March and in September. In the Huangfuchuan River, a small discharge peak occurred in March and a much larger peak occurred in September ().
Fig. 5 Seasonal variation in monthly mean discharge in (a) the Hailiutu and (b) the Huangfuchuan rivers.
3.3 Differences in daily mean discharge
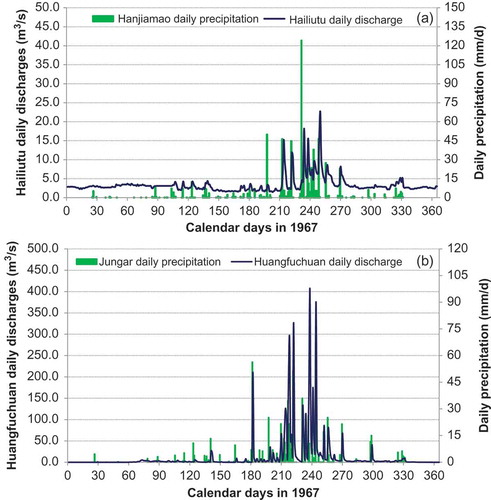
To visualize the differences of the daily mean discharge in responses to daily rainfall in the two catchments, daily mean discharge values for 1967 were plotted against rainfall () and statistical descriptors were computed (). The daily mean discharge of the Hailiutu River in 1967 was stationary during no-rain days, and responded to heavy rain events with a moderate increase in discharge ()). The river was never dry. The Huangfuchuan River was dry on most days in January, February and December 1967, and responded to heavy rain events with flash floods ()). The Spearman correlation coefficient between the daily mean discharge and daily precipitation was 0.33 in the Hailiutu River, and 0.46 in the Huangfuchuan River. The variation in daily discharge in the Huangfuchuan River is extremely large compared with the coefficient of variation in the Hailiutu River ().
Fig. 6 Variation of daily mean discharge in relation to rainfall in 1967 in (a) the Hailiutu and (b) the Huangfuchuan rivers.
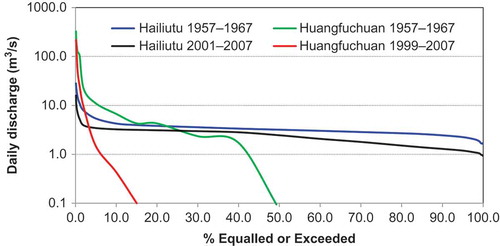
The flow duration curves of the mean daily discharge were constructed to compare differences between natural (1959–1967) and recent flow between the two rivers (). The Huangfuchuan River has much steeper flow duration curves, implying a flashier runoff hydrograph. The Hailiutu River, on the other hand, has very flat flow duration curves indicating stationary daily discharges. Furthermore, in the Huangfuchuan River, the flow duration curve of the recent flows (1999–2007) is shifted largely to the left compared to the natural flows (1959–1967). This indicates a large reduction in daily flows since 1999, as detected in the annual mean discharges ()). In the Hailiutu River, the flow duration curve of the recent flows (2001–2007) is only slightly lower than that of the natural flows. Therefore, the overall impacts on flow regimes (the difference between recent and natural flows) were greater in the Huangfuchuan River than in the Hailiutu River.
Fig. 7 Flow duration curves of the mean daily discharges of the Hailiutu and Huangfuchuan rivers.
4 ANALYSIS OF CAUSES OF DIFFERENCES IN FLOW REGIMES
4.1 Climate effects
The regime shift detectors did not find any significant trend in the changes in annual precipitation in the Hailiutu (Hanjiamao) and Huangfuchuan (Jungar) catchments ()). The Pearson correlation coefficient of annual precipitation between the two stations was 0.65. The long-term mean annual precipitation at Hanjiamao station (352 mm/year) was not significantly smaller than that (397 mm/year) at Jungar station, according to the Student t statistical test at a 99% level of confidence. Furthermore, there was no significant difference in the variance of annual precipitation between the two stations according to the F statistical test at a 99% level of confidence. The coefficient of variation of annual precipitation was similar at the two stations (). The monthly precipitation variations were also very similar. The correlation coefficients of monthly precipitation between the two stations was as high as 0.79 (p < 0.001). Therefore, rainfall is not likely the cause of the differences in flow regime shifts between the two rivers.
Fig. 8 Comparison between (a) annual precipitation, (b) annual mean temperature, and (c) annual pan evaporation in the Hailiutu and Huangfuchuan catchments.
Table 2 Statistical characteristics of annual precipitation and pan evaporation.
Air temperature changes were also not significantly different in the two catchments. A significant increase in temperature was detected since 1997 in both catchments ()). The Pearson correlation coefficient of annual mean temperatures between the two catchments was as high as 0.92 (p < 0.001), which indicates similar variation in annual mean temperature in the two catchments. The Student t test indicates that the mean temperature in Yulin (Hailiutu catchment) was higher than that in Jungar (Huangfuchuan catchment) at a 99% confidence. However, the F test indicates there was no significant difference in the variance of annual mean temperatures between the two catchments at a 99% confidence. The correlation coefficient of monthly mean temperatures between two catchments was nearly equal to one, indicating similar seasonal temperature variations. Therefore, temperature is also not the cause of the differences in flow regimes between the two rivers.
Finally, annual pan evaporation measurements showed significant differences between the Hailiutu (Wushenqi station) and Huangfuchuan (Jungar station) catchments ()). A significant decreasing trend in annual pan evaporation was detected beginning in 1988 at the Wushenqi station and beginning in 1982 at the Jungar station. Both mean evaporation and standard deviation at Wushenqi station were statistically greater than those at Jungar station () at a 99% level of confidence. The correlation coefficient of annual evaporation between the two stations was 0.76. The correlation coefficient of monthly evaporation between two stations was as high as 0.97. Therefore, the larger variation of annual evaporation in the Hailiutu catchment and smaller variation in the Huangfuchuan catchment cannot explain the lower variability of discharge in the Hailiutu catchment and the higher variability in the Huangfuchuan catchment.
4.2 Topographic effects
The DEM data were used to compute drainage density and surface slopes. Land surface slopes were classified into three categories for both catchments (). The upper limit for classes was 15 degrees because steep farmland with a slope over 15° must be returned to trees or grasses according to a governmental policy issued in 1999 (Cao et al. Citation2009). It can be clearly observed that the Hailiutu catchment is flat; 95% of the area has a surface slope less than 5° (). Furthermore, the land surface is covered by permeable Aeolian sand; therefore, the stream network is limited to only one main river and one branch in the Hailiutu catchment (see ). The drainage density was calculated only as 0.18 km/km2. In contrast, almost 70% of the areas of the Huangfuchuan catchment have surface slopes greater than 5° (). Only in valley bottoms is the surface slope less than 5° (). Moreover, large areas are covered by responsive loess soil. As a result, the stream networks are well developed into third-order branch streams (). The drainage density was calculated as 0.40 km/km2, more than double that of the Hailiutu. In conclusion, the flat land surface covered by permeable sand with very low drainage density in the Hailiutu catchment resulted in a stationary streamflow hydrograph ()), while the steep land surface covered largely by impermeable loess with relatively high drainage density generated a flashy streamflow hydrograph there ()).
Fig. 9 Differences in slopes in the Hailiutu and Huangfuchuan catchments.
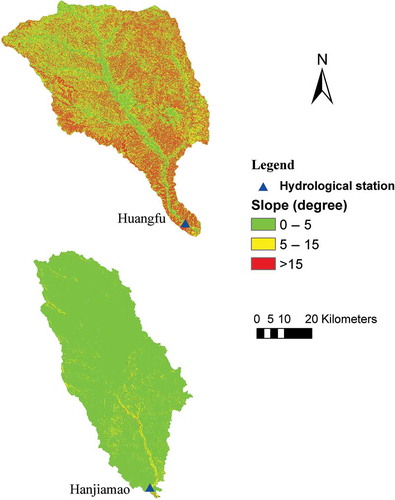
Table 3 Differences in slope in the two catchments.
4.3 Groundwater effects
HYSEP was used to separate baseflow from daily mean discharge for the period 1957–2005. The BFI was computed every day, and the annual average values are plotted in . It is evident that the BFI in the Hailiutu catchment is much larger than that in the Huangfuchuan catchment. In the Hailiutu catchment, the dominant hydrological cycle is precipitation infiltration through sand dunes to sandstone aquifers, followed by discharge to rivers. The direct surface runoff is limited. The annual mean discharge in the Hailiutu River consists of approximately 88% groundwater discharge, on average, which explains why the annual, monthly and daily mean discharges are relatively stable. In the Huangfuchuan catchment, however, the dominant hydrological cycle is direct surface runoff. Groundwater discharge contributes only 15% of the annual mean discharge, on average. Therefore, the variation in yearly, monthly and daily mean discharges are much larger in the Huangfuchuan River.
Fig. 10 Differences in baseflow index between the Hailiutu and Huangfuchuan rivers.
4.4 Land cover effects
Landsat-5 TM-derived NDVI data were used to analyse the distribution patterns of vegetation. Images from 10 July 2010, with 30-m resolution, were processed for the Hailiutu and Huangfuchuan catchments. The NDVI values were converted to five land cover classes (). Both catchments are mainly covered by low-density (NDVI < 0.15) and high-density (0.15 < NDVI < 0.30) shrublands. Meadows (0.30 < NDVI < 0.40) and farmlands (NDVI > 0.40) are limited (). The main difference in land cover between the catchments is that the Huangfuchuan has slightly more high-density shrublands, while Hailiutu has more farmland. However, the crop types are notably different: because there is no groundwater for irrigation and the annual rainfall is above 400 mm/year, the crops in the Huangfuchuan catchment are rainfed. Drought-resistant crops, such as barley and millet, are planted there. Since 1999, the steep slopes in Huangfuchuan have been terraced and planted with trees. The increase in high-density vegetation increases the total evaporation, as trees evaporate more water than drought-resistant crops (Yang et al. Citation2003, McVicar et al. Citation2007, Feng et al. Citation2012). The main crops in the Hailiutu catchment are maize and potatoes, which are irrigated with groundwater in the upland and with river water in the valley. These differences in land cover partly explain why the annual mean discharges have increased in the Hailiutu catchment but decreased in the Huangfuchuan catchment since 1999.
Fig. 11 Distribution of NDVI in the Hailiutu and Huangfuchuan catchments, 10 July 2010.
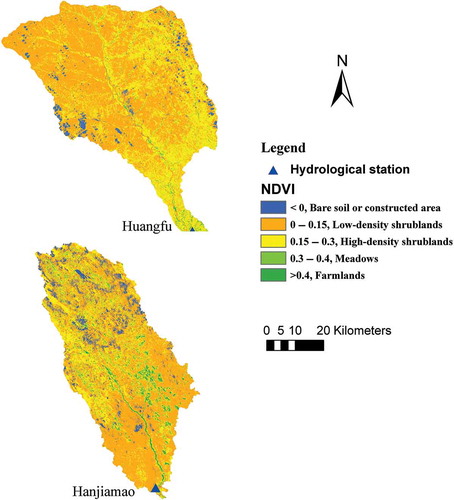
Fig. 12 Comparison of NDVI index between the Hailiutu and Huangfuchuan catchments, 10 July 2010.

4.5 Regression analysis
Multiple correlation and regression analyses have been widely used to explore the relative effects of climate factors and human activities on stream flow changes (Zhang et al. Citation2008, Merz and Blöschl Citation2009). In this study, annual precipitation and annual mean daily temperature were used to represent climate variables since annual pan evaporation was not significantly correlated to annual mean discharge at a 95% confidence (). Because crops were irrigated in the Hailiutu catchment, the effects of reservoirs and river diversions for irrigation can be indirectly represented by the crop area. Check dams had drastic impacts on the decrease of river discharge in the Huangfuchuan catchment. The data on check dams (number, dam height, storage capacity and drainage area) from 1962 to 2005 were collected from Erdos municipality. Correlation analysis found that the cumulative check dam storage was correlated to the annual mean discharge significantly (). Therefore, the cumulative check dam storage was used in regression analysis in the Huangfuchuan catchment.
Table 4 Correlation between annual mean river discharge and causative factors.
There is a strongly negative correlation between the annual mean discharge of the Hailiutu River and crop area, and there are lower correlations with annual precipitation and temperature (). Because the crops are irrigated, the increase in crop areas results in a decrease in river discharge. Therefore, the return of farmland to desert shrubland decreases evaporation, thus increasing the river discharge (Yang et al. Citation2012). The multiple regression between the annual runoff depth and its influencing factors (precipitation, crop area and temperature) in the period 1968–2006 was significant, with a coefficient of determination of 0.64 ()).
Fig. 13 Scatter plot of measured annual mean runoff depth against that predicted by regressions for (a) the Hailiutu and (b) the Huangfuchuan.
In the Huangfuchuan catchment, the annual mean discharge is highly correlated with precipitation (). Furthermore, discharge is negatively correlated with the cumulative check dam storage and temperature. The increase of check dam storage resulted in the decrease of river discharge. The multiple regression between the annual runoff depth and influencing factors (precipitation, cumulative check dam storage and temperature) in the period 1962–2005 is significant, with a coefficient of determination of 0.75 ()).
5 IMPLICATIONS FOR SOIL AND WATER CONSERVATION
Soil and water conservation measures for the Middle Yellow River basin were initiated in the mid-1950s. However, these measures did not have significant effects until the end of the 1960s. Numerous measures were implemented in the 1970s, including the construction of check dams, bench terraces, fish scale pits and reservoirs, and planting of trees and grass (Xu and Cao Citation2002, Li et al. Citation2009). Since 1999, projects designated to return farmland to forest and grassland have been implemented (Cao et al. Citation2009). The vegetation recovery and soil conservation projects have proved effective in reducing the sediment yields in the region (Xu and Cao Citation2002, Rustomij et al. Citation2008, Feng et al. Citation2010). However, the effects on the river discharges are clearly different and depend on the characteristics of the catchments (McVicar et al. Citation2007, Bi et al. Citation2009, Feng et al. Citation2012).
The Huangfuchuan River is one of the main sources of sediment in the Middle Yellow River area (Wang et al. Citation2002). In 1983, the catchment was designated as one of the eight key areas for combating soil and water erosion in China. Ever since, it has become an experimental site for soil and water conservation and ecosystem restoration in the Loess Plateau (Zhu et al. Citation2003, Yu et al. Citation2008, Wang et al. Citation2012). Two methods of soil and water erosion control have been widely practiced. To control surface erosion, farmlands with slopes greater than 15° have been converted to forest, while gently sloping farmlands have been terraced. Check dams have been constructed in gullies to control gully erosion. In 2003, the Ministry of Water Resource of China started a new campaign to speed up the construction of check dams. As many as 163 000 check dams are planned for the Loess Plateau by 2020 (Jin Citation2012). A large number of check dams have already been constructed in the Huangfuchuan catchment. The main objective of check dams is to reduce the sediment pouring into the Yellow River. Check dams have also created new farmlands (Xiang-zhou et al. Citation2004). However, check dams are also expected to reduce the river discharge (Jin Citation2012). The decrease in the annual mean discharge in the Huangfuchuan River since 1999 is largely due to the construction of check dams. It is necessary to modify the check dam design to trap sediments while releasing sufficient clean water discharge to maintain the minimum flow of the Yellow River. To control soil erosion on steeper slopes, native bushes should be promoted instead of trees, which transpire more water and are less effective in the conservation of soil.
The main challenge in the Hailiutu River catchment is different from that of the Huangfuchuan catchment. Control of desertification is the top priority in the Hailiutu catchment. The area suffers from frequent sandstorms, and farmland is threatened by moving sand dunes. At the beginning of the 1980s, the Chinese government started a forestation project known as ‘Three North Forest Shelterbelts’ (Wang et al. Citation2009, Citation2010). Since 2000, projects returning farmland to forest and grassland have also been implemented (Wang et al. Citation2009). Human activities have greatly shifted the flow regimes. The construction of reservoirs and river diversion dikes and the extraction of groundwater for irrigation are the main causes of the multiple flow regime shifts (Yang et al. Citation2012). The return of farmland to desert shrubland has increased the river discharge since 2001. Water and ecosystem management strategies must satisfy both environmental water use by vegetation and water use for socioeconomic development. In the future, the Hailiutu River catchment must manage the groundwater recharge for water resource conservation and the maintenance of healthy vegetation.
6 CONCLUSIONS
Distinct differences in flow regimes were identified between the Hailiutu and Huangfuchuan rivers located in the same climate zone in the Erdos Plateau. The variations in yearly, monthly, and daily mean discharge are much greater in the Huangfuchuan River than in the Hailiutu River. Climate factors were not found to be the causes of the differences in flow regimes between the two catchments. Instead, the differences in flow regimes are mainly attributed to geology and geomorphology. In the Hailiutu catchment, the homogeneous sandstone serves as a good aquifer for groundwater storage. The aquifer is covered by permeable undulating sand dunes, which allow substantial precipitation infiltration. The dominant hydrological cycle is precipitation infiltration through sand dunes to sandstone aquifers followed by discharge to rivers. A large percentage of the groundwater baseflow maintains a stationary river flow regime. In the Huangfuchuan catchment, the interbedded sandstone and mudstone are less permeable. Furthermore, the aquifer is covered by impermeable loess. The steep slopes of the land surface are favourable for surface runoff. Therefore, the dominant hydrological cycle is direct surface runoff. The groundwater baseflow is limited; therefore, the river flow varies widely.
The influences of human activities are also different in the two catchments. At the Hailiutu catchment, river discharge is closely related to crop area changes. Because most crops are irrigated, the return of farmland to desert shrubs reduced evaporation and therefore increased river discharge. Conversely, the construction of a large number of check dams in the Huangfuchuan catchment reduced both the sediment yield and the river discharge.
These findings have important implications for soil and water conservation and ecosystem management in the catchments. The water and ecosystem management priority in the Hailiutu catchment should be to increase groundwater recharge by reducing evaporation loss. Plant species with less evaporation should be selected to vegetate sand dunes. Crops with lower irrigation demands should be promoted to reduce water abstraction. In the Huangfuchuan catchment, river discharge and vegetation depend directly on rainfall. The extent of rain-fed crops should be expanded, and bushes instead of trees should be used for soil and water conservation in steep slopes. Modification of the check dam design is also necessary to allow cleaner water discharge and maintain the minimum flow of the Yellow River.
Disclosure statement
No potential conflict of interest was reported by the author(s).
Acknowledgements
The critical review and constructive comments from the associate editor, Dr Yeboah Gyasi-Agyei, and an anonymous reviewer helped improve the manuscript.
Additional information
Funding
REFERENCES
- Bejarano, M.D., et al., 2010. Flow regime patterns and their controlling factors in the Ebro basin (Spain). Journal of Hydrology, 385, 323–335. doi:10.1016/j.jhydrol.2010.03.001.
- Bergström, S., et al., 2001. Climate change impacts on runoff in Sweden – assessments by global climate models, dynamical downscaling and hydrological modelling. Climate Research, 16 (2), 101–112. doi:10.3354/cr016101.
- Bi, H.X., et al., 2009. Effects of precipitation and landuse on runoff during the past 50 years in a typical watershed in Loess Plateau, China. International Journal of Sediment Research, 24, 352–364. doi:10.1016/S1001-6279(10)60009-1.
- Cao, S.X., Chen, L., and Yu, X.X., 2009. Impact of China’s Grain for Green Project on the landscape of vulnerable arid and semi-arid agricultural regions: a case study in northern Shaanxi Province, China. Journal of Applied Ecology, 46, 536–543. doi:10.1111/j.1365-2664.2008.01605.x.
- Capell, R., et al., 2012. Linking metrics of hydrological function and transit times to landscape controls in a heterogeneous mesoscale catchment. Hydrological Processes, 26, 405–420. doi:10.1002/hyp.8139.
- Chang, L. and Zhang, M.S., 2008. Characteristics and yield mechanisms of stream runoffs in the Northern Shaanxi energy and chemical industry base, China. Geological Bulletin of China, 27 (8), 1143–1150. (in Chinese).
- Chapman, T., 1999. A comparison of algorithms for stream flow recession and baseflow separation. Hydrological Processes, 13, 701–714. doi:10.1002/(SICI)1099-1085(19990415)13:5<701::AID-HYP774>3.0.CO;2-2.
- Döll, P. and Schmied, H.M., 2012. How is the impact of climate change on river flow regimes related to the impact on mean annual runoff? A global-scale analysis. Environmental Research Letters, 7, 014037. doi:10.1088/1748-9326/7/1/014037.
- Feng, X.M., et al., 2010. Modeling soil erosion and its response to land-use change in hilly catchments of the Chinese Loess Plateau. Geomorphology, 118, 239–248. doi:10.1016/j.geomorph.2010.01.004.
- Feng, X.M., et al., 2012. Regional effects of vegetation restoration on water yield across the Loess Plateau, China. Hydrology and Earth System Sciences, 16, 2617–2628. doi:10.5194/hess-16-2617-2012.
- Gibson, C.A., et al., 2005. Flow regime alterations under changing climate in two river basins: implications for freshwater ecosystems. River Research and Applications, 21, 849–864. doi:10.1002/rra.855.
- Hu, Q., et al., 2005. Effects of climate and landcover change on stream discharge in the Ozark Highlands, USA. Environmental Modeling & Assessment, 10, 9–19. doi:10.1007/s10666-004-4266-0.
- Huang, M. and Zhang, L., 2004. Hydrological responses to conservation practices in a catchment of the Loess Plateau, China. Hydrological Processes, 18, 1885–1898. doi:10.1002/hyp.1454.
- Huang, M.B., Kang, S.Z., and Li, Y.S., 1999. A comparison of hydrological behaviours of forest and grassland watersheds in gully region of the Loess Plateau, China. Journal of Natural Resources, 14 (3), 226–231. (in Chinese).
- Jin, Z., et al., 2012. How many check dams do we need to build on the Loess Plateau? Environmental Science and Technology, 46, 8527–8528. doi:10.1021/es302835r.
- Kirchner, J.W., 2009. Catchments as simple dynamical systems: catchment characterization, rainfall-runoff modeling, and doing hydrology backward. Water Resources Research, 45, 1–34. doi:10.1029/2008WR006912.
- Lavers, D., Prudhomme, C., and Hannah, D.M., 2010. Large-scale climate, precipitation and British river flows: identifying hydroclimatological connections and dynamics. Journal of Hydrology, 395, 242–255. doi:10.1016/j.jhydrol.2010.10.036.
- Li, Z., et al., 2009. Impacts of land use change and climate variability on hydrology in an agricultural catchment on the Loess Plateau of China. Journal of Hydrology, 377, 35–42. doi:10.1016/j.jhydrol.2009.08.007.
- Liang, S., et al., 2010. Can climate change cause the Yellow River to dry up?. Water Resources Research, 46, W02505. doi:10.1029/2009WR007971.
- Love, D., et al., 2010. Changing hydroclimatic and discharge patterns in the northern Limpopo Basin, Zimbabwe. Water South Africa, 36, 335–350.
- Lv, J., et al., 2013. Groundwater-dependent distribution of vegetation in Hailiutu River catchment, a semi-arid region in China. Ecohydrology, 6, 142–149. doi:10.1002/eco.1254.
- Matheussen, B., et al., 2000. Effects of land cover change on streamflow in the interior Columbia River Basin (USA and Canada). Hydrological Processes, 14, 867–885. doi:10.1002/(SICI)1099-1085(20000415)14:5<867::AID-HYP975>3.0.CO;2-5.
- McMahon, T.A., et al., 2008. Understanding the surface hydrology of the Lake Eyre Basin: Part 2—Streamflow. Journal of Arid Environments, 72, 1869–1886. doi:10.1016/j.jaridenv.2008.06.001.
- McVicar, T.R., et al., 2007. Developing a decision support tool for China’s re-vegetation program: simulating regional impacts of afforestation on average annual stream flow in the Loess Plateau. Forest Ecology and Management, 251, 65–81. doi:10.1016/j.foreco.2007.06.025.
- Merz, R. and Blöschl, G., 2009. A regional analysis of event runoff coefficients with respect to climate and catchment characteristics in Austria. Water Resources Research, 45, W01405. doi:10.1029/2008WR007163.
- Mu, X.M., et al., 2007. Analysis of the impact of conservation measures on stream flow regime in catchments of the Loess Plateau, China. Hydrological Processes, 21, 2124–2134. doi:10.1002/hyp.6391.
- Qian, Y.P., et al., 2004. Analysis on the characteristic and variation of base flow in loess plateau of the middle reaches of Huanghe River. Journal of Earth Sciences and Environment, 26 (2), 88–91. (in Chinese).
- Rodionov, S.N., 2004. A sequential algorithm for testing climate regime shifts. Geophysical Research Letters, 31, 9204. doi:10.1029/2004GL019448.
- Rustomji, P., et al., 2008. River sediment load and concentration responses to changes in hydrology and catchment management in the Loess Plateau region of China. Water Resources Research, 44, W00A04. doi:10.1029/2007WR006656.
- Sloto, R.A. and Crouse, M.Y., 1996. HYSEP: a computer program for streamflow hydrograph separation and analysis. US Geological Survey Water-Resources Investigations Report, 96–4040, p. 46.
- Taylor, W.A, 2000a. Change-point analysis: a powerful new tool for detecting changes [online]. Available from: http://www.variation.com/cpa/tech/changepoint.html [Accessed 10 October 2013].
- Taylor, W.A, 2000b. Change-point analyzer 2.3 software package [online]. Available from: http://www.variation.com/cpa.html [Accessed 10 October 2013].
- Tetzlaff, D., Seibert, J., and Soulsby, C., 2009. Inter-catchment comparison to assess the influence of topography and soils on catchment transit times in a geomorphic province; the Cairngorm mountains, Scotland. Hydrological Processes, 23, 1874–1886. doi:10.1002/hyp.7318.
- Thodsen, H., 2007. The influence of climate change on stream flow in Danish rivers. Journal of Hydrology, 333, 226–238. doi:10.1016/j.jhydrol.2006.08.012.
- Wang, B.W., Yang, Q.K., and Liu, Z.H., 2009. Effect of conversion of farmland to forest or grassland on soil erosion intensity changes in Yanhe River Basin, Loess Plateau of China. Frontiers of Forestry in China, 4 (1), 68–74. doi:10.1007/s11461-009-0015-5.
- Wang, S.J., et al., 2012. Contributions of precipitation and human activities to the runoff change of the Huangfuchuan drainage basin: application of comparative method of the slope changing ratio of cumulative quantity. Acta Geographica Sinica, 67 (3), 388–397. (in Chinese).
- Wang, P.W., et al., 2002. Analysis on hydrological characteristics of Huangfuchuan basin in the middle Yellow River, China. Northwest Water Resources and Water Engineering, 13 (3), 61–64. (in Chinese).
- Wang, X.M., et al., 2010. Has the Three Norths Forest Shelterbelt Program solved the desertification and dust storm problems in arid and semiarid China? Journal of Arid Environments, 74, 13–22. doi:10.1016/j.jaridenv.2009.08.001.
- Wittenberg, H. and Sivapalan, M., 1999. Watershed groundwater balance estimation using streamflow recession analysis and baseflow separation. Journal of Hydrology, 219, 20–33. doi:10.1016/S0022-1694(99)00040-2.
- Xiang-zhou, X., Hong-wu, Z., and Ouyang, Z., 2004. Development of check-dam systems in gullies on the Loess Plateau, China. Environmental Science and Policy, 7, 79–86. doi:10.1016/j.envsci.2003.12.002.
- Xu, J. and Cao, Y., 2002. Efficiency and sustainability of converting cropland to forest and grassland in the western region. In: J. Xu, E. Katsigris and T.A. White, eds. Implementing the natural forest protection program and the sloping land conversion program: lessons and policy implications. Beijing: China Forestry Publishing House.
- Xu, T.X., 2004. Short-term tendency of water and sediment reduction through soil conservation in the coarse sediment regions in the middle Yellow River. Soil and Water Conservation in China, 7, 3–7. (in Chinese).
- Xu, T.X., 2010. Trend of sediment yield in the coarser sediment-producing area in the middle Yellow River Basin in the period 1997-2007 and the causes. Journal of Soil and Water Conservation, 24 (1), 1–7. (in Chinese).
- Yang, D.Q., Ye, B.S., and Shiklomanov, A., 2004. Discharge characteristics and changes over the Ob river watershed in Siberia. Journal of Hydrometeorology, 5, 595–610. doi:10.1175/1525-7541(2004)005<0595:DCACOT>2.0.CO;2.
- Yang, J., et al., 2003. Experimental study on ecological use of water of a small catchment in Huangfuchuan area. Journal of Natural Resources, 18 (5), 513–521. (in Chinese).
- Yang, Z., et al., 2012. The causes of flow regime shifts in the semi-arid Hailiutu River, Northwest China. Hydrology and Earth System Sciences, 16, 87–103. doi:10.5194/hess-16-87-2012.
- Yu, F., et al., 2008. Land use change and eco-security assessment of Huangfuchuan Watershed. Acta Geographica Sinica, 61 (6), 645–653. (in Chinese).
- Zhang, X.P., et al., 2008. Responses of streamflow to changes in climate and land use/cover in the Loess Plateau, China. Water Resources Research, 44, W00A07. doi:10.1029/2007WR006711.
- Zhou, Y., 1996. Sampling frequency for monitoring the actual state of groundwater systems. Journal of Hydrology, 180, 301–318. doi:10.1016/0022-1694(95)02892-7.
- Zhu, Q.W., Yao, W.Y., and Ru, Y.Y., 2003. Study on comprehensive management of Huangfuchuan River Basin and effects on river channel erosion and deposition. Soil and Water Conservation in China, 254 (5), 22–25. (in Chinese).