
Abstract
The aim of this study was to evaluate canopy water storage (CWS) of the co-dominant shrubs in the revegetation of sand dunes in northwest China. Our results indicated that CWS differed among the xerophyte taxa studied. The average CWS increased exponentially with decreased raindrop size. The time course of CWS in terms of leaf area indicated that Artemisia ordosica attains its peak value of 0.48 mm within 170 min. The corresponding values for Caragana korshinskii and Hedysarum scoparium were 0.38 mm and 178 min, and 0.32 mm and 161 min, respectively, implying that A. ordosica had a higher CWS than C. korshinskii and H. scoparium. Dry biomass was a desirable predictor for estimation of CWS for C. korshinskii and H. scoparium, and shrub volume for A. ordosica. Our results show that the dependence of CWS on raindrop size varied in accordance with the shrub canopy structure.
Editor Z.W. Kundzewicz
Résumé
Le but de cette étude est d’évaluer le stockage de l’eau dans la canopée (SEC) des arbustes co-dominants dans la revégétalisation de dunes de sable, dans le Nord-Ouest de la Chine. Nos résultats indiquent que le SEC diffère selon les taxons xérophytes étudiés. La moyenne du SEC augmente de façon exponentielle quand la taille des gouttes de pluie diminue. Le temps de concentration du SEC en termes de surface foliaire indique que Artemisia ordosica atteint la valeur maximale de 0,48 mm en 170 min. Les valeurs correspondantes pour Caragana korshinskii et Hedysarum scoparium sont respectivement de 0,38 mm et 178 min, et de 0,32 mm et 161 min, ce qui implique que A. ordosica a une capacité de SEC plus importante que C. korshinskii et H. scoparium. Le prédicteur le plus adapté pour l’estimation du SEC est la biomasse sèche pour C. korshinskii et H. scoparium, et le volume de l’arbuste pour A. ordosica. Nos résultats montrent que la dépendance du SEC à la taille des gouttes de pluie varie en fonction de la structure du couvert arbustif.
INTRODUCTION
Revegetation to stabilize moving sand dunes through the use of xerophytic shrubs produces a wide range of hydrological effects. The interaction between raindrops and shrub canopies changes the microphysical characteristics of precipitation. Understanding the mechanisms driving these changes is a key step towards unveiling the mechanics of soil water recharge, soil erosion under shrub canopies, and evaporation of intercepted rainfall (Wang et al. Citation2013). Part of the incident precipitation is intercepted by the above ground parts of vegetation and evaporated into the atmosphere either during events as well as after the cessation of rainfall. This is known as interception loss, a cost to the plant community accounting for 10–30% of the bulk precipitation (Navar and Bryan Citation1990, Dunkerley and Booth Citation1999). Canopy storage is generally defined as water on external surfaces of the canopy that subsequently drains to the soil or evaporates during or within a short time (hours) after cessation of rainfall (Levia et al. Citation2011). When the canopy is saturated, most rain that falls on the vegetation will drain to the ground and interception can only increase by evaporation during rainfall (Klaassen et al. Citation1998). Therefore, canopy storage is a key factor controlling rainfall interception and other ecohydrological processes associated with vegetation such as stemflow and throughfall (e.g. Herwitz Citation1985, Citation1987, Llorens and Gallart Citation2000, Davie Citation2002, Levia and Frost Citation2003, Wang et al. Citation2005, Keim et al. Citation2006, Dunkerley Citation2008, Garcia-Estringana et al. Citation2010, Wang et al. Citation2013). Accordingly, it is the pivotal parameter in models for prediction of interception loss, such as the well known Rutter model (Rutter et al. Citation1971), Gash model (Citation1979) and Calder model (Citation1986).
An accurate assessment of the canopy water balance, by means of in situ measurements or modelling exercises, is essential for evaluating the hydrological consequences of re-establishment of a particular vegetation cover. This is especially true for arid desert ecosystems in northwest China where this cover-type is being re-established to protect the railway from encroachment by moving sand dunes. In addition to water budget simulation exercises, the modelling of canopy interception loss and understory precipitation fluxes may also be important for ecological investigations. Interception losses of dryland shrubs may be quite large partly because of dense canopies and fine twigs and abundant, small and densely packed leaves that provide a large intercepting surface (Dunkerley Citation2008). For example, Dunkerley and Booth (Citation1999) reported 1.3 mm of canopy water storage capacity for dryland shrubs of Atriplex vesicaria and Astrebla lappacea, and Wang et al. (Citation2005) estimated 0.71 mm of canopy water storage capacity for C. korshinskii and 0.75 mm for A. ordosica using a regression analysis approach under natural rainfall events in the field. For simulated rainfall events with variable rainfall intensity from 1.15 to 11.53 mm h-1, the average storage capacity was 0.39, 0.43 and 0.61 mm for C. korshinskii, H. scoparium and A. ordosica, respectively (Wang et al. Citation2012).
Canopy water storage varies with individual plant form and is generally assumed to be controlled by plant size, surface area and the water-holding capacity of canopy elements such as leaves, branches and stems (Davie Citation2002, Dunkerley Citation2008). It is also affected by meteorological conditions such as rainfall intensity (Aston Citation1979, Keim et al. Citation2006, Wang et al. Citation2012), raindrop size (Calder et al. Citation1996, Price and Carlyle-Moses Citation2003) and wind speed (Hörmann et al. Citation1996). Only a few researchers have paid attention to the relationship between raindrop size and canopy water storage. Calder (Citation1986, Citation1996) first emphasized the importance of raindrop size in determining interception losses from canopies. His model predicts that for storms with the same total rainfall, interception losses will be greater for those with smaller raindrop sizes. Later, Price and Carlyle-Moses (Citation2003) obtained similar results. In one recent revision, Dunkerley (Citation2008) pointed out that the drop size for simulated rainfall may fail to reach the levels typical of natural rainfall. He suggested that there is a need to generate rain rates of 1 to 10 mm h-1, while at the same time correctly reproducing the range of drop sizes, kinetic energy and drop arrival rate. Thus, further systematic studies are merited to quantify the variation of canopy water storage on raindrop size under simulated rainfall events resembling natural ones for different plant species.
Many authors have tried to measure canopy water storage capacity, either directly or indirectly. In one recent example, Wang et al. (Citation2012) used direct measurements to report the influence of rainfall intensity on water storage capacity, where simulated rainfall intensity ranks were identical to natural rainfall properties. Wang et al. (Citation2012) found that the canopy water storage capacity varied with rainfall intensity, and suggested that more research was needed to understand the relationships between canopy water storage and raindrop size.
To this end, we conducted detailed experiments on the water storage of three xerophytic shrubs under simulated rainfall with varying raindrop sizes at a constant rainfall intensity. The objectives of our study were: (a) to characterize the dynamics of rainfall storage response to temporally varying raindrop sizes, (b) to quantify the relationship between canopy storage and raindrop size, and (c) to determine the correlations between canopy water storage and the biometric characteristics of the shrubs with varied raindrop size.
MATERIALS AND METHODS
Shrub species and tested samples
The xerophytic shrubs C. korshinskii and H. scoparium, and dwarf shrub A. ordosica () were selected to undergo simulated rainfall. These shrubs were assumed to be representative of those growing in the study area in terms of shrub height, canopy size, average branch and/or stem diameter, and the canopy morphology. Detailed descriptions of the tested samples are provided in Wang et al. (Citation2012). Obvious differences in canopy morphology and bark among these shrubs are as follows: A. ordosica is a needle-leaved and rough-barked species with a cone-shaped canopy; C. korshinskii is an ovate-leaved and smooth-barked species with an inverted cone-shaped canopy; and H. scoparium is an ovate-leaved and smooth- and crack-barked species with an inverted cone-shaped canopy.
Fig. 1 Set-up of the rainfall simulator (model DIK-6000, Daiki Rika Kogyo Co., Japan) and the shrub species for the experiment: (a) C. korshinskii; (b) H. scoparium; and (c) A. ordosica.
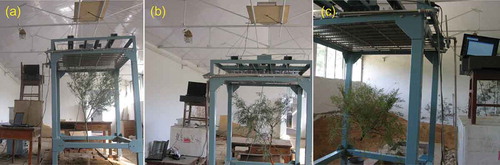
For rainfall simulation, the C. korshinskii and H. scoparium samples were cut off at their single stem bases. For A. ordosica, the whole plant was cut off from the ground surface due to its obvious one main stem and the small canopy fit for rainfall simulation. Before sample collection, the base diameter and stem stretch angle were measured in situ, together with measurements of plant height and canopy diameter to estimate the vertical canopy projection area and the volume of the shrub. The shrub canopy projection area approximated an ellipse rather than a circle in shape. It was therefore calculated as the area of an ellipse by taking the longest and shortest diameters through the centre of the fullest part of the canopy (Peek Citation1970, Pugnaire et al. Citation1996), and shrub volume was calculated as that of an inverted elliptical cone. The canopy volume was calculated by subtracting the volume below the bottom of the canopy from the shrub volume. Six specimens of each species were collected.
After rainfall simulation, each sample was disassembled into leaves, stems, and branches. The one-sided, projected leaf area was measured using a portable area meter (model LI-3000, LI-Cor Co., USA). The leaf area index was obtained by calculating the ratio of leaf area to canopy projection area. The dry biomass of leaves, stems and branches was obtained by weighing oven-dried samples (75°C for about 48 h), which were added together for the whole plant.
Rainfall simulation and data collection
Tests were performed indoors in the absence of wind and in controlled air temperature (22–25°C) and relative humidity (82–92%) conditions in July 2011. Rain was simulated using a rainfall simulator (model DIK-6000, Daiki Rika Kogyo Co., Japan) using varied intensities. The DIK-6000 rainfall simulator has a height of 2 m, a spray grid (1.02 m × 1.02 m) and 324 needles (18 × 18), an effective rainfall area of 1.0404 m2, and a rainfall intensity of between 0 and 200 mm h-1 (refer to Figure 1 of Wang et al. Citation2012). The raindrop size (range: 1.7–2.8 mm) was adjusted by manipulating the revolution rate of the vibration motor, which controls the vibration magnitude of a main frame with rainfall nozzles on it. Five revolution rates of the vibration motor were established (900, 775, 700, 500, and 300 r.p.m.) equivalent to raindrop sizes of 1.9, 2.1, 2.3, 2.5 and 2.7 mm, according to the calibrated equation in the technical manual of the DIK-6000 rainfall simulator. The raindrop sizes were checked by the filter paper splash procedure. The variation in drop size accounted for less than ±0.1% of the technically calibrated results, and the spatial distribution of drop size was even. The rainfall intensity was set constant at 5 mm h-1 through the experimental period and was determined using long-term meteorological records in the study area (Wang et al. Citation2005) in order to test the influence of raindrop size at high-limit rainfall intensity. Five mm h-1 is not an average rainfall intensity obtained from long-term records, but it is a ‘limit’ natural rainfall intensity.
We suspended vegetation specimens on a 1-mm cable in their growth position found in the field. These were hung from the base of an electronic balance (model LA16001S, Sartorius Co., Germany, precision: ±0.1 g) mounted on the ceiling directly above the rainfall simulator (Wang et al. Citation2012). The electronic balance was controlled by a laptop computer and automatically recorded the raw weight of the specimen with a frequency of 20 readings per minute during simulated rainfall. The hypothesis in the experiment was that the amount of water stored by the shrub canopy would increase from bigger raindrop size to smaller raindrop size (Calder et al. Citation1996, Price and Carlyle-Moses Citation2003). Therefore, the canopy in wet conditions will not affect the total amount of water that is stored in each experimental stage with the consecutive smaller raindrop size, i.e. the canopy storage water is the sum of the water intercepted by the canopy from a dry to a wet state. Each test began with simulated rainfall at the largest drop size (2.7 mm) until the weight increase of the sample reached a steady-state value. The simulator was then turned off for 3 min to allow water to drip off the leaves. The objective was not to return to initial dry conditions during this 3-min recess, rather to allow excess water to leave the plant. The raindrop size was then set to 2.5 mm for another cycle of rainfall simulation. The sequence for raindrop sizes of 2.3, 2.1 and 1.9 mm was repeated. When the weight increase of the sample became stable at a raindrop size of 1.9 mm, the rainfall simulator was immediately turned off. At the same time, two ventilators were turned on with all windows and doors opened to enable quick specimen drying for subsequent biometric determinations.
Two corrections were taken into account to the raw weight data required for measurement of water stored during simulated rain. One is that the weight gain caused by water detention of the suspension cable should be subtracted; it can be obtained by running tests with no vegetation sample. The other is to subtract the weight gain originating from the drop force of water impinging on the specimen and suspension cable; it can be accomplished by analysing the response of the apparent sample weight to 9-s interruptions while the sample was at steady-state storage during simulated rainfall. The latter subtraction should be analysed for each sample under simulated rainfall at each raindrop size. The tests showed that water stored on the suspension cable was small and accounted for less than 0.1% of the apparent weight and the force of raindrops accounted for less than 1% of the weight gain of the sample between two consecutive raindrop sizes.
RESULTS AND DISCUSSION
Relationship between canopy water storage and raindrop size
Canopy water storage per leaf area (mm), per dry biomass (g g-1), per canopy projection area (g cm-2), per canopy volume (g cm-3), and per shrub volume (g cm-3), exclusively, decreased exponentially with increasing raindrop size (). The results from this experiment agree with data presented by Calder et al. (Citation1996), who found the rate of wetting was greatest for small drop sizes for five tropical tree species. A significant exponential relationship can be found between canopy water storage and raindrop size for C. korshinskii, H. scoparium and A. ordosica, respectively. It is important to emphasize that the present experiment did not hold all variables other than rainfall intensity constant to investigate the effects of increased rainfall drop size on canopy storage, as in Calder (Citation1996), instead holding the range of raindrop sizes more closely to the natural average ones (Marshall and Palmer Citation1948). In this respect, our results agreed with the former study that increased drop size also increased kinetic energy associated with the rainfall (Calder et al. Citation1996), though the previous study of Calder et al. (Citation1996) varied rainfall intensity by 25% while varying drop size by 160–650%, which do not accord with the natural rainfall conditions in the study areas concerned.
Fig. 2 Canopy storage per (a) canopy area; (b) canopy volume; (c) dry biomass; (d) shrub volume; (e) leaf area of shrubs C. korshinskii (CK), H. scoparium (HS), and A. ordosica (AO) varying with five raindrop sizes. Values are equilibrium storage averaged across all tests for each species (n = 6). Vertical bars represent standard error.
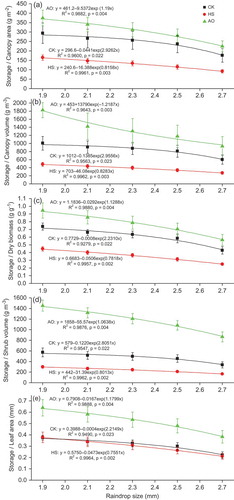
Needle-leaved species A. ordosica stored more water than C. korshinskii and H. scoparium with a broader ovate leaf shape for all raindrop sizes (). For example, mean canopy water storage per leaf area for A. ordosica was 0.52 mm (range: 0.38–0.64 mm) compared with corresponding values of 0.31 mm (range: 0.22–0.37 mm) and 0.30 mm (range: 0.21–0.38 mm) for C. korshinskii and H. scoparium, respectively, when raindrop size varied from 2.7 to 1.9 mm at the constant rainfall intensity of 5 mm h-1. These are comparable to previous direct measurements, although the plant species differed from these studies. Calder et al. (Citation1996) measured maximum canopy storage of five tropical tree species which ranged from 0.037 to 0.42 mm under simulated drop diameters of 0.5, 0.8 and 5.2 mm, with intensities of 36 and 45 mm h-1, respectively. It is evident that, in the study area of lower rainfall intensity, the shrub species has relatively higher canopy storage. In comparison, the needle-leaved species A. ordosica had a higher canopy water storage than the ovate-leaved species C. korshinskii and H. scoparium under simulated rainfall at a specific raindrop size. This was similar to that under varied rainfall intensities, indicating that the canopy water storage increased with the increase in rainfall intensity (Wang et al. Citation2012). We may conclude that the needle-leaved species with rough-barked stem will induce more water loss through canopy interception. This shows a negative influence on hydrological processes (e.g. a higher threshold for stemflow generation) than that of ovate-leaved species with smooth stem in this water-limited arid desert area, with an averaged raindrop size of 2.3 mm and rainfall intensity of less than 5 mm h-1.
Time course of canopy water storage varying with raindrop size
exemplifies the course of canopy water storage of C. korshinskii, H. scoparium and A. ordosica over time under simulated rainfall at five raindrop sizes from large to small (range: 2.7–1.9 mm). Canopy water storage exclusively showed an increase when rainfall was changed to a smaller drop size for the three shrub species, and each raindrop size corresponded to a steady-state storage, which the water storage would not be expected to exceed (). indicates that, for canopies wetted in a gradual, asymptotic manner, the maximum number of drops retained on a per-leaf-area basis is less than or equal to one. The observed exponential wetting relationship of the present study was similar to the form of the stochastic model of Calder (Citation1986). The time when it attained steady-state storage differed significantly under each different raindrop size for the shrubs in the experiment. For example, for simulated rainfall with a raindrop size of 2.7 mm, it took 69, 60 and 59 min to attain steady-state canopy water storage of 0.21, 0.17 and 0.34 mm for C. korshinskii, H. scoparium and A. ordosica, respectively. Physically, this means that canopies which stored more water at lower drop sizes tended to accumulate proportionally less water at higher drop sizes; species that stored water more effectively were less sensitive to variations in drop size. Overall, C. korshinskii had the longest duration of approximately 180 min to reach steady-state canopy water storage under simulated rainfall with varied raindrop size compared with that of H. scoparium (around 160 min) and A. ordosica (around 170 min) ().
Fig. 3 Example data from tests of rainfall simulation on shrubs. In each case, the black line is the depth-equivalent mass of water stored on the shrub canopy, vertical dashed lines indicate step decreases in raindrop size (shown on the upper panel). Dips in stored water are the result of 3-min rainfall pauses.
There were notable storage increases of 0.006 mm min-1 for A. ordosica at the beginning of rainfall interception (with an initially dry canopy surface), whereas for C. korshinskii and H. scoparium, they were 0.003 and 0.003 mm min-1, respectively. It is the initial wetting effects of the storm that should be taken into account to improve the performance of the model prediction (Hall et al. Citation1996). The overall storage increment rate was 0.002, 0.002 and 0.004 mm min-1 for C. korshinskii, H. scoparium and A. ordosica, respectively (), due mainly to the density and shape of the leaves, and partly to the structure of the canopy. The needle-leaved species A. ordosica stored the most water per leaf area in a short period, compared with the ovate-leaved species C. korshinskii and H. scoparium over all raindrop sizes. It is evident that the needle-leaved species exhibited quicker accumulation of storage than ovate-leaved species. This is contrary to the results of Keim et al. (Citation2006), who suggested that dynamic storage on needle-leaved species depends on fewer variables than that on ovate-leaved species, and perhaps because of that the needle-leaved species has less overlapped leaf effects on canopy storage on whole samples directly exposed to simulated rainfall. This agreed with the performance of canopy water storage of these shrubs under rainfall of varied intensities (Wang et al. Citation2012).
The monotonic accumulation of storage to equilibrium state in the present experiment with varying drop size () and the previous results with varying intensity (e.g. in Wang et al. Citation2012) strongly support the physically-based conceptual model of canopy storage during rainfall that includes the concepts of static and dynamic storage (Keim et al. Citation2006). This accounts for intensity- and drop size-driven changes in storage by considering the synthetic effects of intensity and drop size of the rainfall, where the maximum canopy storage that was achieved is not constant, but is dependent on drop size (Calder et al. Citation1996) and intensity (Keim et al. Citation2006, Wang et al. Citation2012). The results presented here corroborate the studies on drop size of Price and Carlyle-Moses (Citation2003), who attributed the reduction in canopy storage to increased raindrop sizes. However, they are contrary to the hypothesis of a reduction in canopy storage due to increased rainfall intensity (Price and Carlyle-Moses Citation2003). The results of the present and previous (Wang et al. Citation2012) studies suggest that there is no definite linkage between drop size and intensity for rainfall in either simulated or natural conditions, though both drop size and intensity are positively related to kinetic energy.
Fig. 4 Relationship between water storage and biomass for (a) C. korshinskii and (b) H. scoparium and (c) shrub volume for A. ordosica under simulated rainfall with mean raindrop size of 2.3 mm (range from 1.7 to 2.9 mm).
indicates that static canopy storages per leaf area were 0.21, 0.29, 0.31, 0.32 and 0.38 mm for C. korshinskii at drop sizes of, respectively, 2.7, 2.5, 2.3, 2.1 and 1.9 mm, under a rainfall intensity of 5 mm h-1. The corresponding values were 0.17, 0.21, 0.24, 0.27 and 0.32 mm for H. scoparium and 0.32, 0.37, 0.40, 0.43 and 0.48 mm for A. ordosica. These values will fill a gap in that most published estimates of interception loss in dryland plant communities appear to be based upon inadequate data and methods (Dunkerley Citation2000) and will be useful for hydrological modelling efforts directed towards interpreting canopy interception loss from rainfall within revegetated desert shrub communities. As water is a scant resource in an area affected by desertification, any change in vegetation cover could have important consequences for rainfall reaching the soil surface. The introduction of shrub vegetation in an area where no vegetation was present increases the interception losses of vegetation, which means that water that is stored on the canopy evaporates without reaching the soil surface.
Canopy water storage and biometric characteristics of shrubs
Canopy water storage increased linearly with increased dry biomass for C. korshinskii (). For H. scoparium, canopy water storage will attain its maximum value of 123.31 g regardless of the increase in dry biomass beyond 600 g (). However, for A. ordosica, canopy water storage will definitely increase with each increment of shrub volume (). These results were at an average raindrop size of 2.3 mm with a wide range (1.9–2.7 mm), which was identical to the average raindrop size of 2.36 mm generated by the dripper modules of Dunkerley (Citation2008). Drops of this size are common in natural rainfall of the intensity simulated here (Marshall and Palmer Citation1948).
The coefficient of variation, the ratio of standard deviation to the mean, enables comparison of the standard deviations of different variables that are in different measurement units (Zar Citation1999). We used the coefficient of variation here to determine which of the five variables (leaf area, canopy projection area, dry biomass, canopy volume and shrub volume) is better as a predictor for estimation of canopy water storage varying with raindrop size.
As illustrated in , the mean coefficient of variation of canopy water storage at all tested raindrop sizes for C. korshinskii, H. scoparium and A. ordosica varies significantly, although the units, such as leaf area, etc., differ. The lowest coefficient of variation was 16.65% for H. scoparium for water storage per dry biomass, and the highest was 51.68% for A. ordosica for water storage per canopy volume. The canopy storage of C. korshinskii and H. scoparium both had the lowest coefficient of variation when it was expressed as water storage per dry biomass (g g-1), whereas it was lowest for water storage per shrub volume (g cm-3) for A. ordosica under specific raindrop sizes. The results imply that dry biomass is a better predictor relating to steady-state water storage for C. korshinskii and H. scoparium, while for A. ordosica, shrub volume is a better predictor than leaf area, canopy projection area and canopy volume, respectively. As a comparison, Dunkerley and Booth (Citation1999) found that, for Australian dryland species Astrebla lappacea and Atriplex vesicaria, the strongest relationship was between interception capacity (expressed in cm3) and canopy projection area (in cm2), while for Maireana sedifolia, stronger relationships were found using plant green weight rather than projected canopy projection area. By contrast, Keim et al. (Citation2006) stated that leaf area was the best predictor of canopy water storage with varying rainfall intensities and the biomass was an unreliable predictor in their studies of eight different species of shrubs and trees.
Table 1 Coefficient of variation (%) between canopy storage (S, g) versus leaf area (LA, cm2), dry biomass (DB, g), canopy area (CA, cm2), canopy volume (CV, cm3) and shrub volume (SV, cm3), respectively, for the xerophytic taxa tested (n = 6).
For the same plant species in the study area under varied rainfall intensities with a constant raindrop size (2.5 mm), Wang et al. (Citation2012) found that leaf area, plant dry biomass and fresh biomass were better predictors for canopy water storage capacity estimation. Comparing these studies, it seems that the predictors of canopy storage capacity are especially species-specific, and are inevitably affected by rainfall characteristics such as rainfall intensity and raindrop size.
CONCLUSION
It is important to understand the nature of canopy storage processes on desert shrubs for a number of reasons. An accurate assessment of the canopy water balance, by means of in situ measurements or modelling exercises, is essential for evaluating the hydrological consequences of the re-establishment of a shrub vegetation cover. In studies of the ecohydrology of water-limited arid environments, such as the revegetated desert ecosystems of northwestern China, much attention has been paid to the linkages between hydrological, biogeochemical and ecological processes, for instance, the role of revegetated shrubs in modifying land-surface responses and soil infiltration to rain (Wang et al. Citation2007, Citation2008).
This research investigates the effect of raindrop size on canopy storage, which is of general interest in the quest to better understand how canopies interact with precipitation, and is an essential parameter for rainfall partitioning models. The results highlight that canopy water storage depends on the morphological characteristics of shrub species associated with the raindrop size. A significant relationship was found between canopy storage and raindrop size. Canopy storage decreased exponentially with increasing raindrop size. The needle-leaved species (e.g. A. ordosica) has a higher canopy storage than ovate-leaved species (e.g. C. korshinskii and H. scoparium). Based on the variation of raindrop size during rainfall processes, predictors of canopy storage are shrub species-specific; for example, plant biomass is the best predictor of canopy water storage for C. korshinskii and H. scoparium and, in comparison, plant volume is the best predictor of canopy water storage for A. ordosica.
Disclosure statement
No potential conflict of interest was reported by the author(s).
Additional information
Funding
REFERENCES
- Aston, A.R., 1979. Rainfall interception by eight small trees. Journal of Hydrology, 42, 383–396. doi:10.1016/0022-1694(79)90057-X.
- Calder, I.R., 1986. A stochastic model of rainfall interception. Journal of Hydrology, 89, 65–71. doi:10.1016/0022-1694(86)90143-5.
- Calder, I.R., 1996. Dependence of rainfall interception on drop size: 1. Development of the two-layer stochastic model. Journal of Hydrology, 185, 363–378. doi:10.1016/0022-1694(95)02998-2.
- Calder, I.R., et al., 1996. Dependence of rainfall interception on drop size: 2. Experimental determination of the wetting functions and two-layer stochastic model parameters for five tropical tree species. Journal of Hydrology, 185, 379–388. doi:10.1016/0022-1694(95)02999-0.
- Davie, T., 2002. Fundamentals of hydrology. 2nd ed. London and New York: Routledge, Taylor & Francis Group.
- Dunkerley, D., 2000. Measuring interception loss and canopy storage in dryland vegetation: a brief review and evaluation of available research strategies. Hydrological Processes, 14, 669–678. doi:10.1002/(SICI)1099-1085(200003)14:4<669::AID-HYP965>3.0.CO;2-I.
- Dunkerley, D.L., 2008. Intra-storm evaporation as a component of canopy interception loss in dryland shrubs: observations from Fowlers Gap, Australia. Hydrological Processes, 22, 1985–1995. doi:10.1002/hyp.6783.
- Dunkerley, D.L. and Booth, T.L., 1999. Plant canopy interception of rainfall and its significance in a banded landscape, arid western New South Wales, Australia. Water Resources Research, 35, 1581–1586. doi:10.1029/1999WR900003.
- Garcia-Estringana, P., Alonso-Blázquez, N., and Alegre, J., 2010. Water storage capacity, stemflow and water funneling in Mediterranean shrubs. Journal of Hydrology, 389, 363–372. doi:10.1016/j.jhydrol.2010.06.017.
- Gash, J.H.C., 1979. An analytical model of rainfall interception by forests. Quarterly Journal of the Royal Meteorological Society, 105, 43–55. doi:10.1002/qj.49710544304.
- Hall, R.L., et al., 1996. Dependence of rainfall interception on drop size: 3. Implementation and comparative performance of the stochastic model using data from a tropical site in Sri Lanka. Journal of Hydrology, 185, 389–407. doi:10.1016/0022-1694(95)03000-X.
- Herwitz, S.R., 1985. Interception storage capacities of tropical rainforest canopy trees. Journal of Hydrology, 77, 237–252. doi:10.1016/0022-1694(85)90209-4.
- Herwitz, S.R., 1987. Raindrop impact and water flow on the vegetative surfaces of trees and the effects on stemflow and throughfall generation. Earth Surface Processes and Landforms, 12, 425–432. doi:10.1002/esp.3290120408.
- Hörmann, G., et al., 1996. Calculation and simulation of wind controlled canopy interception of a beech forest in Northern Germany. Agricultural and Forest Meteorology, 79, 131–148. doi:10.1016/0168-1923(95)02275-9.
- Keim, R.F., Skaugset, A.E., and Weiler, M., 2006. Storage of water on vegetation under simulated rainfall of varying intensity. Advances in Water Resources, 29, 974–986. doi:10.1016/j.advwatres.2005.07.017.
- Klaassen, W., Bosveld, F., and de Water, E., 1998. Water storage and evaporation as constituents of rainfall interception. Journal of Hydrology, 212–213, 36–50. doi:10.1016/S0022-1694(98)00200-5.
- Levia, D.F. and Frost, E.E., 2003. A review and evaluation of stemflow literature in the hydrologic and biogeochemical cycles of forested and agricultural ecosystems. Journal of Hydrology, 274, 1–29. doi:10.1016/S0022-1694(02)00399-2.
- Levia, D.F., et al., 2011. Throughfall and stemflow in wooded ecosystems. In: D.F. Levia, D.E. Carlyle-Moses, and T. Tanaka, eds. Forest hydrology and biogeochemistry: synthesis of past research and future directions, ecological studies 216. Dordrecht: Springer, 425–444.
- Llorens, P. and Gallart, F., 2000. A simplified method for forest water storage capacity measurement. Journal of Hydrology, 240, 131–144. doi:10.1016/S0022-1694(00)00339-5.
- Marshall, J.S. and Palmer, W.McK., 1948. The distribution of raindrops with size. Journal of Meteorology, 5, 165–166. doi:10.1175/1520-0469(1948)005<0165:TDORWS>2.0.CO;2.
- Navar, J. and Bryan, R., 1990. Interception loss and rainfall redistribution by three semi-arid growing near tree trunks in a beechwood on limestone: indications for stemflow induced changes in community structure. Applied Soil Ecology, 3, 115–125.
- Peek, J.M., 1970. Relation of canopy area and volume to production of three woody species. Ecology, 51, 1098–1101. doi:10.2307/1933640.
- Price, A.G. and Carlyle-Moses, D.E., 2003. Measurement and modelling of growing-season canopy water fluxes in a mature mixed deciduous forest stand, southern Ontario, Canada. Agricultural and Forest Meteorology, 119, 69–85. doi:10.1016/S0168-1923(03)00117-5.
- Pugnaire, F.I., et al., 1996. Facilitation and succession under the canopy of a leguminous shrub, Retamasphaerocarpa, in a semiarid environment in southeast Spain. Oikos, 76, 455–464. doi:10.2307/3546339.
- Rutter, A.J., et al., 1971. A predictive model of rainfall interception in forests, 1. Derivation of the model from observations in a plantation of Corsican pine. Agricultural Meteorology, 9, 367–384. doi:10.1016/0002-1571(71)90034-3.
- Wang, X.P., et al., 2005. Measurement of rainfall interception by xerophytic shrubs in re-vegetated sand dunes. Hydrological Sciences Journal, 50, 897–910. doi:10.1623/hysj.2005.50.5.897.
- Wang, X.P., et al., 2007. Effects of surface characteristics on infiltration patterns in an arid shrub desert. Hydrological Processes, 21, 72–79. doi:10.1002/hyp.6185.
- Wang, X.P., et al., 2008. Effects of rainfall characteristics on infiltration and redistribution patterns in revegetation-stabilized desert ecosystems. Journal of Hydrology, 358, 134–143. doi:10.1016/j.jhydrol.2008.06.002.
- Wang, X.P., et al., 2012. Canopy storage capacity of xerophytic shrubs in Northwestern China. Journal of Hydrology, 454–455, 152–159. doi:10.1016/j.jhydrol.2012.06.003.
- Wang, X.P., et al., 2013. Influence of shrub canopy morphology and rainfall characteristics on stemflow within a revegetated sand dune in the Tengger Desert, NW China. Hydrological Processes, 27, 1501–1509. doi:10.1002/hyp.9767.
- Zar, J.H., 1999. Biological analysis. 4th ed. Upper Saddle River, NJ: Prentice-Hall.