
Abstract
Sulphide mine waste extensively contaminates the Odiel River (southwest Spain), releasing sulphuric acid into the water body. Acidic water in this river precipitates and dissolves variably hydrated iron sulphate in a complex geological pattern controlled by climate. Local abrupt changes in the water pH in the vicinity of highly contaminated tributaries can be mapped by means of imaging spectroscopy using hyperspectral remote sensing (HyMap) data. Also, increased pH through mixing of acidic river water with marine water can be detected when the river reaches the area influenced by sea tides. Mapping the quality of water with hyperspectral data is confounded by vegetation, either dry or wet, rooted or floating. The spectral features of acidic water measured with a field spectrometer revealed the spectral influence of green vegetation, similar to the influence of the depth and transparency of water. Careful mapping of such parameters with HyMap data must therefore precede any spectral evaluation of water related to acidity in a river course. The spectral features detectable by HyMap data and associated with pH changes caused by contamination in river water by iron sulphide mine waste, and their controls, are described and references established for routine monitoring through hyperspectral image processing.
Résumé
Les déchets miniers sulfurés polluent beaucoup la rivière Odiel (Sud-Ouest de l’Espagne), libérant de l’acide sulfurique dans l’eau courante. L’eau acide de cette rivière précipite et dissout différents hydrates de sulfate de fer dans un environnement géologique complexe contrôlé par le climat. De brusques changements locaux du pH de l’eau au voisinage d’affluents fortement pollués peuvent être visualisés par le biais de l’imagerie spectroscopique utilisant des données de télédétection hyperspectrale (HyMap). De même, l’augmentation du pH du fait du mélange de l’eau acide de la rivière avec l’eau de mer peut être détectée lorsque la rivière atteint la zone influencée par les marées. Il peut cependant y avoir des confusions entre la cartographie de la qualité de l’eau obtenue à partir de données hyperspectrales, et la végétation, sèche ou humide, enracinée ou flottante. Les caractéristiques spectrales de l’eau acide mesurée avec un spectromètre de terrain révèlent l’influence spectrale de la végétation verte, semblable à l’influence de la profondeur et de la transparence de l’eau. Une cartographie précise de ces grandeurs avec des données HyMap hyperspectrales doit précéder toute évaluation spectrale de l’acidité de l’eau dans une rivière. Nous décrivons les caractéristiques spectrales associées aux changements de pH liés à la pollution de la rivière par le sulfure de fer provenant de déchets miniers détectables par les données HyMap, comment elles peuvent être contrôlées, et les modalités de la surveillance de routine par traitement d’images hyperspectrales.
INTRODUCTION
Traditional remote sensing of water uses the optical properties of water colour related to water depth, suspended sediment concentration, and the presence of near-surface vegetation pigments such as chlorophyll (Bukata et al. Citation1995) in both ocean and inland waters. Inland, estuarine and coastal waters are the subject of a number of studies using hyperspectral sensors with the aim of estimating water quality parameters such as coloured dissolved organic matter, chlorophyll and suspended matter (Dekker and Hoogenboom Citation1996, Brando and Dekker Citation2003, Karaska et al. Citation2004). This study focuses on a narrow polluted river carrying acid water that is geochemically and spectrally different from any large water body. The Odiel River (Pyrite Belt, Huelva, southwest Spain) is highly contaminated by sulphide mine waste, released as sulphuric acid into the water body. Water colour can be related to local river geochemistry (Sánchez España et al. Citation2005) and this is the optical property responsible for the observed spectral variations in the contaminated river.
Imaging spectroscopy as a contamination mapping tool
This study aims to map contaminated river water using hyperspectral remote sensing (HyMap) data, based on the spectral features of water colour associated with pH changes resulting from contamination from iron sulphide mine waste along the entire river course (Sarmiento et al. Citation2009a, Citation2009b) and, by means of controls, establishing references for routine monitoring.
Imaging spectroscopy is an effective tool for the study of mine waste deposits that can produce acid mine drainage (AMD). Early focus on mine wastes through the study of secondary minerals initially concentrated on iron-bearing oxides and hydroxides (Farrand and Harsanyi Citation1995). It soon expanded to consider secondary minerals related to mine waste weathering (Swayze et al. Citation1996, Lévesque Citation1997, Clark et al. Citation1998), establishing differences between contaminated and non-contaminated streams (Anderson and Robbins Citation1998).
Minerals generating acid environments have attracted the attention of the geological scientific community. This is because they are highly mobile in the environment through dissolution in drainage water with patterns of precipitation that can be established and traced using remote sensing hyperspectral data (Swayze et al. Citation1998, Citation2000). By acquiring data from waste deposits containing different kinds and proportions of minerals, and representing various characteristics, spectral libraries have been produced that allow relatively rapid assessment of ephemeral thin crusts originating from acidic mine water (Crowley et al. Citation2003, Velasco et al. Citation2005).
The geochemistry of the Odiel River in southwest Spain () is closely monitored by local hydrogeologists (Sarmiento et al. Citation2009a, Citation2009b). Fluvial sediments from the Odiel River, which gathers spills from numerous mine sites throughout its drainage basin, are of special interest for hyperspectral monitoring (Riaza and Carrère Citation2010, Riaza et al. Citation2012a, Buzzi et al. Citation2011, Buzzi Citation2012). In addition, several study sites were selected from maps of mine waste compiled from historical HyMap data and laboratory spectral studies (Riaza and Müller Citation2010, Riaza et al. Citation2011a, Citation2011b). The influence of the pre-processing routines of hyperspectral imagery and the spatial patterns observed on the mineralogical diagnosis of coatings on river sediments are discussed in Riaza et al. (Citation2011c).
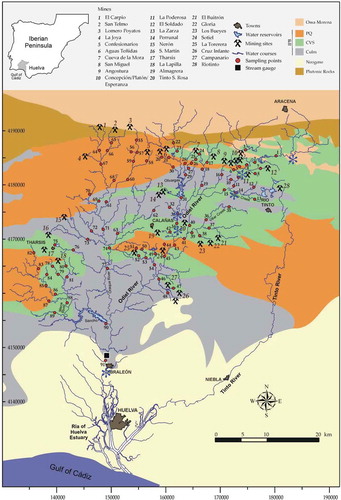
Fig. 1 Location of the study area in the Odiel River (Huelva, Spain). Contaminated and uncontaminated drainage channels are shown together with the location of the main mine operations (source: Sarmiento et al. Citation2009a). Blue stars are water sampling locations for geochemical analysis contemporaneous to the dates of HyMap flights. Black rectangles frame mapped areas.
The dramatically different spectral response in water bodies within a mine site with variable water chemistry has been mapped with HyMap data (Riaza et al. Citation2011b). Preliminary results on acid water mapping in the river channel (Riaza et al. Citation2012b) are already available to the public and provide basic information, which is expanded on below. Water colour is used for pH-related hyperspectral remote sensing of the shallow water of the contaminated river (Sanchez España et al. 2005). The pH of water is used in this work as an environmental indicator of complex geochemical reactions in acid water involving heavy metals (Nordstrom and Alpers Citation1999). Direct field observation of the complex spectral effects of water–vegetation–bottom interactions and field spectral measurements are the empirical basis for the work described below.
Geochemistry of acid mine drainage in the Odiel River: climate control
The geochemistry of the Odiel River closely follows climate variations during the hydrological year. Further geochemical changes are associated with inter-annual water flow dependent on fluctuations in rainfall and evapotranspiration.
Precipitation in the Huelva area consists of intense, short rain events in autumn, relatively dry winters, and dry springs and summers. The low precipitation rate defines a semi-arid climate with a permanently low water table. Acidic water in the Odiel River precipitates and dissolves variably hydrated iron sulphate in a complex geological pattern controlled by climate. During flash floods, the river carries AMD from solubilized iron sulphide. After the main annual flood in October, sediments lose water and oxidize continuously during the winter, spring and summer.
The majority of the sulphate and metal materials released through mine waste remain as particulates within the river basin (Sanchez España et al. 2005). As a general trend in the river basin, the concentrations of heavy metals increase during the dry season and decrease during the wet season (Sarmiento et al. Citation2009a, Olías et al. Citation2006). However, immediately after the intense rains of autumn the concentration of some elements increases in the lower part of the river as a result of dissolution of soluble salts.
Contaminants are more available in the freshwater environment. Wide variations in the pH (from 2 to 8.6) of the water along the Odiel River were recorded and showed a close correlation with geochemical water parameters quantifying the contamination (Sarmiento et al. Citation2009a, Citation2009b, Riaza et al. Citation2012b). In the summer, in the absence of dilution by rainfall, the pH drops, and the sulphide oxidation processes increase in areas close to the sources of contamination. The concentration of contaminants is at a maximum during the dry season in the upper and middle parts of the basin, remaining constant in the lower part.
The colour of acid water in the river is directly related to the geochemistry (Sanchez España et al. 2005), depending on the dissolved iron and aluminium in the drainage water. Acid water is typically red because of the content of iron, colloidal Fe(III). When Fe(II) is abundant, the water has a greenish colour. The surface of water rich in aluminium is white. Transitions between the three hydro-geochemical facies, based on field evidence, can happen within distances of centimetres.
DATASET
HyMap data
HyMap data were acquired on 1 August 2008 and 13 August 2009 along the main channel of the Odiel River with a 4 m spatial resolution. HyMap is an airborne hyperspectral remote sensing sensor, with 126 wavebands from 436 to 2485 nm and a spectral resolution of 10–20 nm. The raw HyMap data were system-corrected (Cocks et al. Citation1998). The imagery was geocoded using parametric-based software (Schläpfer and Richter Citation2002) and ATCOR4 (Richter and Schläpfer Citation2002) was used for atmospheric correction. Further details about the pre-processing of HyMap data can be found in previous work (Riaza and Müller Citation2010).
Field spectra
Field spectra along the entire Odiel River were measured with coincident pH estimations using indicator strips. Representative spectra were selected from a large library of 500 field spectra, using field locations, local pH measurements and background geological setting observations (Riaza and Müller Citation2010; Buzzi et al. Citation2011, Buzzi Citation2012, Riaza et al. Citation2011b, Citation2012b).
Field spectra were taken with an Advanced Spectral Device (ASD) Fieldspec3 spectrometer operating between 400 and 2400 nm, with a 1 nm spectral resolution. Operational details of the spectral measurements are outlined in Riaza et al. (Citation2011a).
Geochemical analysis of water
Water samples were collected from the Odiel River on the same days as the HyMap flights (1 August 2008 and 13 August 2009), at six different points along the whole length of the river course (). Physicochemical parameters (temperature, pH, specific conductance, dissolved O2 and redox potential) were measured in the field (Riaza et al. Citation2012b).
The pH of water was also measured on the ground using pH indicator strips at the same locations as the measurements of water field spectra.
BUILDING A MAP OF WATER IN A RIVER CHANNEL THROUGH IMAGE PROCESSING USING HYMAP DATA
Once reflectance data have been obtained (after the pre-processing steps outlined above), the next step is to map target geological features on the surface of the Earth. Various algorithms have been developed to manage hyperspectral high dimensional data (RSI Citation2000). The following explains the basics regarding the algorithm routines used by the authors () to map spectral features in a contaminated river (Riaza et al. Citation2012a). The procedure used for feature extraction for thematic purposes was an interpreter-oriented sequential spectral separation method using standard algorithms, leading to a spatial pattern and spectral identification for pixels within the scene, displayed as a map (Hubbard and Crowley Citation2005).
Fig. 2 Sequence of hyperspectral image processing to produce a map of acidic water.
The standard sequence of image processing typically begins with a Minimum Noise Fraction (MNF) transform. The MNF rotation determines the inherent dimensionality of image data, segregates noise in the data, and reduces the computational requirements for subsequent processing (Boardman and Kruse Citation1994).
A previous work that attempted to understand the pattern of contamination products detected by hyperspectral HyMap data led to the requirement to first map river sediments (Riaza et al. Citation2012a), after isolating the river flow path (, , and ).
Fig. 3 Sequential subscenes produced by image processing (from left to right): (a) false colour composite with HyMap channels 7 (0.5602 µm), 34 (0.9414 µm) and 110 (2.2450 µm); (b) minimum noise fraction transform showing the flow path and water; (c) mask for the flow path; (d) map of sediments (in Riaza et al. Citation2012a); (e) mask for mud and water; (f) map of water and mud (in Riaza et al. Citation2012b); (g) mask for deep water; and (h) map of acidic water.
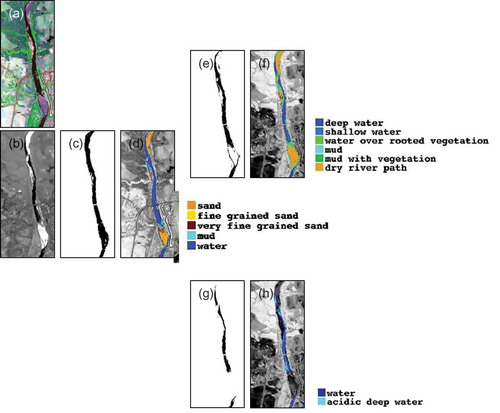
The seventh MNF, computed from the entire geometrically and atmospherically corrected HyMap image, efficiently identified water (Riaza et al. Citation2012b); a mask was then built from these data ()). The MNFs were again computed under this water mask ()). After the Pixel Purity Index procedure and n-dimensional analysis, the populations which were going to be the end members for input to the Spectral Angle Mapper (Kruse et al. Citation1993) were identified and the final map of the river water was constructed ()), including water and muddy areas ()). The final step was performed on a mask for deep water ()) from the previous map of water and mud, to map the areas showing an acidic water spectral response ()).
The spectral response of water in a narrow and mostly shallow river channel is strongly influenced by the presence of vegetation, whether in voids on wet sands close to the edge of the water, or as weeds floating on the water or rooted on the bottom. If the water is transparent and very shallow, the spectral response is influenced by the bottom. Therefore, mapping all the parameters in water must occur before any evaluation linking the physicochemical properties of water to pH, and, hence, the intensity of contamination. The mapping of water pH is only performed for water which is considered deep and devoid of vegetation or bottom spectral influences ()).
The map of acidic water presented in shows only the areas where the spectral response of acidic water can be detected by HyMap imagery, which is controlled by the geomorphology of the river sediments and water dynamics. The spectral response of the rest of the river flow path is dominated by the presence of vegetation or the influence of the bottom. Therefore, this map cannot be directly translated into a water quality map.
MAPPING DIFFERENCES IN WATER pH IN A RIVER CHANNEL WITH HYMAP IMAGES
Once a map has been created identifying areas where the presence of vegetation and the bottom of the river influence the spectral response (see the next section), it is possible to overcome the challenge of identifying the spectral features associated with the influence of the pH of the water (Riaza et al. Citation2012b). The river is relatively short, flowing from a mountain chain close to the seashore. Mine sites contributing contaminated water to the main channel are spread throughout the river basin (Sarmiento et al. Citation2009a). Since the river channel is narrow, a representative number of test sites was selected to show diverse settings where acid water pools can be mapped through hyperspectral image processing, and the geomorphological and climate parameters influencing their location pattern are typical.
Climatology is the most important factor influencing the geochemical evolution of the river, as well as the evolution of the secondary minerals that occur in the margins of the river. The amount of river flow is directly related to the rainfall rate. After the annual flood in October, which washes all efflorescence and crusts on the river flow path, there is a slow lowering of the water level. This leaves wider areas uncovered, depending mainly on temperature and humidity. The year 2005 was very warm and extremely dry (AEMET Citation2004–2009). The annual temperature increased from 2008 to 2009, but rainfall rates were similar.
The confluence of a highly contaminated tributary with a clean main stream
The Odiel River receives heavily contaminated water from the Gossan Reservoir of the Rio Tinto mine facilities, resulting in an abrupt decrease in pH from 6–7 to 3 (). The water flow shown by the imagery was higher in 2008 than in 2009 (AEMET Citation2004–2009). Changes in pH were only possible in 2008, since the flow path upstream of the confluence with the contaminated tributary (), yellow circle) was dry in 2009. The area covered by all units within the transition from water to the dry flow path was also wider in 2008 than in 2009 ( and ).
Fig. 4 (left) The first input of intensely contaminated water in the river: maps of (a) deep water with different pH and (b) water, from HyMap data on 1 August 2008. Maps of (c) deep water and (d) water, from HyMap data on 13 August 2009. Right: seasonal summer maps of temperature and precipitation for the corresponding years (source: AEMET). Temperature legend: EC: extremely warm (exceeds maximum recorded for the reference period 1961–1990); MC: very warm (within 20% of the span of the warmest years of 1961–1990); C: warm (within 20% and 40% of the warmest years of 1961–1990); N: normal within 40% and 60% of 1961–1990); F: cold (within 60% and 80% of 1961–1990); MF: very cold (within 80% of 1961–1990); EF: extremely cold (temperatures recorded do not reach the minimum value recorded during the reference period). Precipitation: EH: extremely wet (precipitation exceeded the maximum recorded for the reference period 1971–2000); MH: very wet (within 20% of the span of wettest years of 1971–2000); H: wet (within 20% and 40% of wettest years); S: dry (within 60% and 80% of 1971–2000); MS: very dry (within the 80% of 1971–2000); ES: extremely dry (precipitation does not reach the minimum value recorded during 1971–2000).
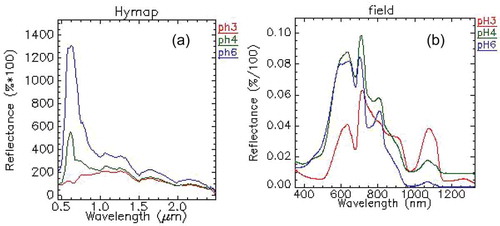
The HyMap 2008 images were able to produce pH maps when only deep water was introduced in the sequence of mapping algorithms ()). The spectra for less acidic water with a pH of 6 (i.e. uncontaminated water upstream of the confluence with the tributary containing intensely contaminated water) displayed higher overall reflectance, with a maximum at 0.63 µm and decreasing reflectance towards longer wavelengths of up to 1 µm (). This spectral trend agrees with the spectral response of deep basic water (pH 8) near the estuary. Intermediate acidic water downstream (pH 3) displayed spectra with lower overall reflectance and the same 0.63 µm peak, narrowing during a quick descent to 0.67 µm, where reflectance decreased less steeply.
Fig. 5 (a) HyMap spectra of the end-members mapped as pH associated with water at the first input of intensely contaminated water in the river. (b) Field spectra of water with different pH measured in the field at the first input of intensely contaminated water in the river.
Water with a more acidic pH of 3 showed spectra with low overall reflectance and a clear influence of vegetation. This more acidic water was restricted to partially dammed areas in the river with lower energy, slow water flow, and a tendency to host vegetation (), cyan circle). This abrupt change in pH occurs within centimetres, when the water is pooled behind small rock fragments in the river.
The river path with mine dumps on the bank (Sotiel)
The Sotiel mine site, located in the middle course of the river, has left approximately 1 km of mine dumps along the river bank, resulting in an average water pH of 3 in the summer. The mine operation used the river as a washing system, building numerous walls along the area where the mine dumps occur. As a consequence, the river flow is artificially slowed and the water forms pools.
As expected, based on rainfall rates in spring, and average rainfall and temperature in the seasons prior to the flights, the level of the water was lower in 2005 than in 2008 and 2009. In spite of the comparatively heavy rains in the spring of 2008, the water was level in 2008 and 2009 at this point. The numerous walls crossing the river slow down the water flow and reduce the differences caused by changes in climate. Only extremely low rainfall and high temperatures in 2005 caused an obvious decrease in water flow.
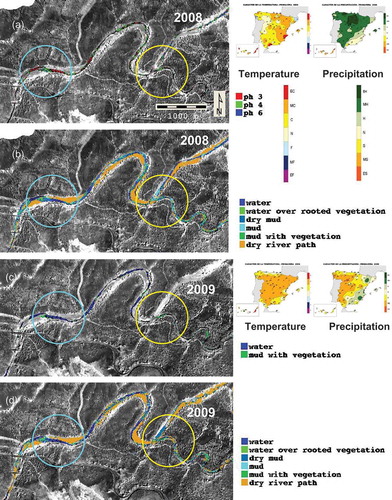
The water maps produced from HyMap imagery showed spots of acidic water on coincident locations in 2005, 2008 and 2009 (). Interestingly, the areas showing clear acidic water spectral responses were larger in 2005 ()), a very dry and warm year when the water level in the river was at its lowest. In 2008, which had the highest water level in the river, a relatively smaller area was mapped as acidic water ()).
Fig. 6 The mine site along the river. Top row: Temperature and second row: precipitation. Seasonal (summer) maps for corresponding year of flights (AEMET):.(a) false colour composite image with HyMap channels 16 (0.6755 µm), 26 (0.8188 µm) and 108 (2.1917 µm). Mineworks are enhanced in light colour on the western bank of the river. (b)–(d) Maps of acidic deep water built from HyMap data on 17 June 2005, 1 August 2008, and 13 August 2009, respectively. See for explanation of colours and maps.
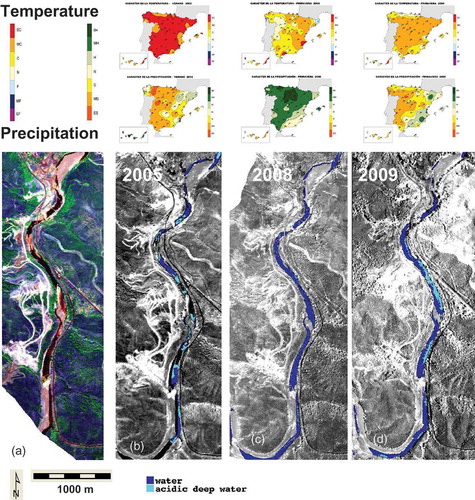
Therefore, there is a close correlation between average water depth and the occurrence of restricted areas showing acidic water spectral responses. This agrees with ground observations using pH indicator strips, where shallower water behind obstacles or knick-points favours local decreases in pH. The water close to the obstacle has a pH of 3, which changes to pH 4 only 50 cm away from it.
SPECTRAL ANALYSIS
The hydrochemical characteristics of Odiel River water in the summer vary downstream from the head, which is initially free of contamination but is immediately loaded with heavy pollution from the Rio Tinto mine facilities. Subsequently, the hydrochemical parameters drop abruptly and vary little with water flow. Most of the high contamination indicators decrease downstream and finally disappear under the influence of tidal seawater at the entrance to the estuary.
Mapping a small river path with HyMap data of 4 m spatial resolution is a challenge. The Odiel River is a narrow channel widening from 20 m at the Bridge of the Five Arches, the first input of heavy contamination from the Rio Tinto mine site, to the main river channel. In the middle course of the river, at the Sotiel mine site, the width of the water channel averages 40 m. It widens to 120 m at the entrance to the estuary. Mapping the quality of water is confounded by vegetation, dry or wet, rooted or floating (Riaza et al. Citation2012a). Shallow water with floating vegetation and the spectral influence of the river bottom are the most critical parameters relating to the significant presence of contamination in the water. Spatially discriminating the spectral features of the influence of vegetation and the bottom of the river from the water itself using HyMap data with a 4 m spatial resolution is a major challenge in the already small area of the river channel.
Spectra of river water from HyMap data
HyMap spectra from water in the river channel at the entrance of the estuary were chosen to show the spectral features associated with the main spectrally distinct surfaces, because the river path is wider and, correspondingly, the area covered by water is greater.
Deep water shows a simple spectral response with an enhanced maximum at 575 nm and a rapid descent towards 1000 nm (, ). No significant spectral features occur in the near-infrared range (1000–2478 nm).
Fig. 7 HyMap spectra of the end-members used to build the map of water and mud (cf. and (f)) (source: Riaza et al. Citation2012b).
Table 1 Summary of relevant spectral features on the HyMap spectra (see ) of the end-members used to build the map of water and mud (). ‘max’ and ‘min’ refer to maximum and minimum reflectance shown by the corresponding spectra in the graphs of . ‘end’ describes the wavelength at which the spectral response stops in a particular spectrum. Particularly enhanced spectral features are in bold font.
The spectral signature of shallow water reflects an enhanced maximum with the same shape as deep water shifted to 589 nm and a rapid decrease towards 1000 nm (, ). The influence of the river bottom can be seen from the smooth features common to mud and vegetation and higher overall reflectance than that of deep water in the near-infrared range.
The presence of vegetation, whether rooted on the bottom of the river under shallow water or floating on the surface, can be recognized by deep absorption at 677 nm (, ). This feature is related to the photosynthetic activity of plants (Zeinalov and Maslenkova Citation2000). Absorption at 677 nm is also generally present in the spectral response of most mud surfaces. Reflectance decreases from a maximum at 763 nm towards longer wavelengths with minima coinciding with the spectral signatures of mud surfaces.
The spectral response from mud surfaces displayed a typical shape rapidly increasing to 1278 nm with a minor maximum at 673 nm and the typical minimum associated with the presence of vegetation at 677 nm (, ).
Field spectra of river water
Field spectra along the entire Odiel River were measured with coincident pH estimations using indicator strips. Representative spectra were selected from a large spectral library of 500 field spectra, using field locations, local pH measurements, and background geological setting observations. The resulting spectra displayed similar shapes with variable enhancement in the minimum or maximum depending on water depth, pH, the presence of vegetation, whether rooted on the bottom of the river or floating on the surface of the water, turbulence, and the influence of tidal marine water at the estuary (Riaza et al. Citation2012a).
The average pH measured in the field with indicator strips in a single week during the summer was approximately 3 along the whole length of the flow path, the minimum value expected during the year according to local hydrogeologists. Minor deviations in which the pH was lower than 3 corresponded with being in the vicinity of highly contaminated tributaries, slow water flow behind walls crossing the river, or blind lateral channels.
Details on water quality parameters contemporaneous to flights in 2008 and 2009 are given in a previous work (Riaza et al. Citation2012b). The Odiel River initially had a water quality typical of natural streams. In both 2008 and 2009, all physicochemical parameters experienced an abrupt change at the first input of contamination from the Gossan Reservoir at the Rio Tinto mine site, not far from the head of the river (Riaza et al. Citation2012b). The pH drops abruptly at this point from the uncontaminated head of the river, and after that keeps constant acid values, tending to loose acidity smoothly towards the mouth (Riaza et al. Citation2012b). The Eh evolves along opposite trends to pH.
The water spectrum near the head of the river (), where it is relatively free from contamination (pH 6), displays a comparatively flatter spectral response, with smoothed spectral absorptions compared to the spectra of more acidic water downstream (pH 3).
Typically, deep water with an acidic pH of 3 displayed an enhanced maximum or peak between 567 and 640 nm, decreasing rapidly to a sharp absorption at 618 nm (, and , ). A less pronounced maximum at 701 nm followed, in a quick steep descent towards longer wavelengths with an asymmetric minimum centred at 742 nm and another asymmetric maximum at 808 nm, leading to a shoulder between 832 and 900 nm. A wide minimum centred at 975 nm preceded a smooth maximum centred at 1072 nm, and decreasing signal that ends at 1140 nm.
Fig. 8 Mosaic with the six HyMap flight lines covering the flow path of the River Odiel in 2008, with test sites and locations of field spectral measurements. (A)–(H): Field spectra of water measured with an ASD Fieldspec 3 spectrometer in locations corresponding to (a)–(h) along the river flow path, with expression of the water pH measured on the ground contemporaneous to the field spectral measurements.
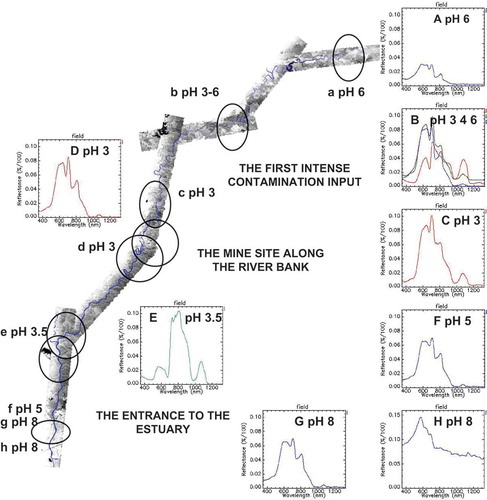
Table 2 Summary of relevant spectral features on field reflectance spectra of river water according to pH and other parameters (see ). See and text for explanations.
This was the main trend of the spectral response of water along the river. The spectra of deep water with pH values more basic than the average pH 3 along the entire length of the river, displays smoothed spectral features compared to the spectral response of acidic pH ( and , ). There was a shoulder centred at 618 nm where there was a sharp minimum. The sharp minimum at 674 nm in spectra of acidic water was moderated in spectra of deep water. The distinct spectral features ended at 832 nm or continued with a smoothed maximum centred at 1072 nm.
In the channel open to marine water with a basic pH of 8, deep water, and a rippled water surface, there was a maximum at 572 nm, and reflectance decreased with shoulders where acidic water spectra displayed minima at 674 and 742 nm. A clear signal was lost at 808 nm (, ). There was no influence of the bottom of the channel in this spectrum.
The influence of vegetation on the spectral response of water was distinct, with unique spectral features permitting the digital isolation of water with vegetation from the rest of the surface of the water. This was recognized primarily by sharp absorption at 674 nm, interrupting the ascent of reflectance to a maximum at 719 nm. This absorption is known as the ‘red drop’ associated with photosynthesis in green algae (Emerson and Lewis Citation1943, Zeinalov and Maslenkova Citation2000). Another minor minimum at 742 nm preceded a shoulder at 808 nm. Reflectance dropped steeply toward a deep minimum centred at 975 nm, rose again to a maximum at 1075 nm, and finally fell at 1140 nm.
Discussion on the HyMap/field spectra
Several spectral features were common to both the HyMap imagery and field spectra. The spectra from HyMap images in deep water coincided at a maximum centred at 575 nm with the spectral response in the field (). The absorption of the ‘red drop’ at 674 nm due to the presence of vegetation was also clearly present on both the HyMap imagery and field spectra.
However, HyMap spectra did not record the noisy spectral response from 674 nm shown by field spectra. The HyMap spectra from shallow water suggested a minimum at 742 nm. The maximum centred at 1072 nm in the field spectra was not suggested in the HyMap imagery.
Field spectral measurements record features different from the crucial spectral responses from hyperspectral data. The spectra selected as end members of mappable water units summarize such features. Both poor spatial resolution of HyMap data, and a wider field of view are responsible for the less detailed spectral response recorded by HyMap than the field spectral measurements.
HyMap imagery is able to summarize wider spectral features than field spectra. Interestingly, the features mapped from HyMap data have ground sizes below the spatial resolution of 4 m from HyMap data. HyMap proves a remarkable mapping capability of water features in the river related to environmental hydrochemical changes.
DISCUSSION
Mapping water in an acidic river contaminated by mine waste requires an understanding of the entire river system, sediments, geomorphological parameters, and vegetation growth which can be rooted, floating, or even dead. Climate strongly influences all these parameters.
Previous attempts to map the coatings precipitating from dissolved sulphate in the water showed the need to map river sediments first, and to isolate digitally dry and wet areas (Riaza et al. Citation2012a). The diagnosis of minerals present on the surface is performed digitally using reference spectral libraries (RSI Citation2000, Crowley et al. Citation2003) on the separate masked areas for dry sediments, water and intermittently wet areas (Buzzi et al. Citation2011, Buzzi Citation2012, Riaza et al. Citation2011b, Riaza et al. Citation2012a, Citation2012b).
Therefore, preliminary maps of the flow path displaying dry land, mud, mud with vegetation, water with vegetation, shallow water, or turbid water are necessary to target the areas where the spectral features of acidic water can be recognized. After the compilation of the previous maps, the areas with deep water without vegetation are digitally isolated. In these areas of deep water free from vegetation only HyMap data are able to show spectral responses identifiable as acidic water.
The temporal changes at pools mapped as acidic water were strongly controlled by the water level of the river resulting from the climate of the previous seasons. The authors observed that low water levels in dry and warm years favour the presence of pools of acidic water, generally located where water is slowed behind a knick-point. This trend was observed both behind small rocks in the river in the ground, and by flow path mapping from HyMap data. The change in water dynamics at a barrier triggers geochemical precipitation of iron, which is shown by water reddening. Low water flow in dry and warm years favours the identification of pools of acidic water in HyMap imagery.
The maps of acidic water show only the areas where the spectral response of acidic water can be detected by HyMap imagery, which are controlled by the geomorphology of the river sediments, the colour of surface water related to geochemistry, and the water dynamics. The spectral response of the rest of the river flow path is dominated by the presence of vegetation or the influence of the bottom. This acidic water HyMap map cannot be directly translated into a water quality map, but is a useful environmental indicator.
Conventional river water quality monitoring is based mainly on the chemical analysis of water samples collected regularly throughout the year, and groundwater physical parameters measured by instruments located in the flow path. It is a novelty to detect differences in the acidity of river water using airborne hyperspectral data. The spectral features described in river water contaminated by iron sulphide mine waste and the methodology used to build maps developed from HyMap data, are a solid basis for a new temporal water quality monitoring system.
CONCLUSIONS
HyMap hyperspectral data are able to produce water maps of a river with a narrow channel, including water parameters that allow qualitative and quantitative estimations of the intensity of contamination in an acid mine drainage basin using pH as an environmental indicator.
The pools of spectrally identifiable acidic water tend to occur behind knick-points and locally slowed water flow. Vegetation growth in the river water is also favoured in intensely contaminated locations detectable by imagery.
A routine sequence of image processing using hyperspectral remote sensing data is described, enabling the production of river water maps following identifiable spectral trends, which can be used as a new temporal river water quality monitoring system.
The HyMap acidic water map should not be translated directly into a water quality map. The spectral features associated with river contamination by acid mine drainage suitable for monitoring by hyperspectral imagery are described.
Disclosure statement
No potential conflict of interest was reported by the author(s).
Acknowledgements
J.M. Moreira contributed with information about mine inventories and regional environmental databases. The Andalusian Regional Government, the Junta de Andalucía, permitted entry to the abandoned mine site of Sotiel at the border of the river. Local industries also allowed access to the river through their facilities.
Additional information
Funding
REFERENCES
- AEMET (Agencia Estatal de Meteorología, Spain), 2004–2009. Resumen anual climatológico del año 2004, 2005, 2006, 2007, 2008 y 2009 [online]. Available from: http://www.aemet.es [Accessed 24 February 2014].
- Anderson, J.E. and Robbins, E.I., 1998. Spectral reflectance and detection of iron-oxide precipitates associated with acidic mine drainage. Photogrammetric Engineering and Remote Sensing, 64, 1201–1208.
- Boardman, J.W. and Kruse, F.A.,1994. Automated spectral analysis: a geological example using AVIRIS data, north Grapevine Mountains, Nevada, Proceedings ERIM Tenth Thematic Conference on Geologic Remote Sensing, Environmental Research Institute of Michigan, Ann Arbor, MI, I, 407–418.
- Brando, V.E. and Dekker, A.G., 2003. Satellite hyperspectral remote sensing for estimating estuarine and coastal water quality. IEEE Transactions on Geoscience and Remote Sensing, 41–6, 1378–1387.
- Bukata, R.P., et al., 1995. Optical properties and remote sensing of Inland and coastal waters. London: CRC Press.
- Buzzi, J., 2012. Imaging spectroscopy to monitor the contamination from sulphide mine waste in the Iberian Pyrite Belt using hyperspectral sensors (Huelva, Spain). Thesis (PhD). Universidad de León (Spain).
- Buzzi, J., et al., 2011. Modified Gaussian modelization applied to hyperspectral data in an AMD-contaminated area. Case of Odiel River, Huelva, SW Spain, Proceedings 7th EARSeL Workshop on imaging spectroscopy [online], 11–13 April, Edinburgh. Available from: http://www.earsel2011.com/Proceedings/ [Accessed 24 February 2014].
- Buzzi, J., et al., 2012. Change detection in sediments of a river affected by acid mine drainage using airborne hyperspectral HyMap data (River Odiel, SW Spain). In: Proceedings 4th workshop on remote sensing and geology, 24–25 May, Mykonos. European Association of Remote Sensing Laboratories (EARSeL), 134–158.
- Clark, R.N., Vance, J.S., and Livo, K.E., 1998. Mineral mapping with imaging spectroscopy: the Ray Mine, AZ. In: R.O. Green, ed. Summaries of the 7th annual JPL airborne earth science workshop, 12–14 January. JPL Publication, 97–21, 67–75.
- Cocks, T., et al., 1998. The Hymap™ Airborne Hyperspectral Sensor: The system, calibration and performance. In: Proceedings 1st EARSEL workshop on Imaging Spectroscopy, October, Zürich.
- Crowley, J.K., et al., 2003. Spectral reflectance properties (0.4–2.5 m) of secondary Fe-oxide, Fe-hydroxide, and Fe-sulphate-hydrate minerals associated with sulphide-bearing mine wastes. Geochemistry: Exploration, Environment, Analysis, 3–3, 219–228.
- Dekker, H.J. and Hoogenboom, A.G., 1996. Predictive modelling of AVIRIS performance over inland waters. Proceedings Sixth Annual JPL Airborne Earth Science Workshop. JPL Publication, 96-4 1, 83–92.
- Emerson, R. and Lewis, Ch., 1943. The dependence of the quantum yield of Chlorella photosynthesis on wave length of light. American Journal of Botany, 30–3, 83–163.
- Farrand, W.H. and Harsanyi, J.C., 1995. Mineralogic variations in fluvial sediments contaminated by mine tailings as determined from AVIRIS data, Coeur d’Aldene River, Idaho. Proceedings AVIRIS Workshop, 47–50.
- Hubbard, B.E. and Crowley, J.K., 2005. Mineral mapping on the Chilean–Bolivian Altiplano using co-orbital ALI, ASTER and Hyperion imagery: data dimensionality issues and solutions. Remote Sensing of Environment, 99, 173–186. doi:10.1016/j.rse.2005.04.027
- Karaska, M.A., et al., 2004. AVIRIS measurements of chlorophyll, suspended minerals, dissolved organic carbon, and turbidity in the Neuse River, North Carolina. Photogrammetric Engineering and Remote Sensing, 70, 125–133. doi:10.14358/PERS.70.1.125
- Kruse, F.A., et al., 1993. The spectral image processing system (SIPS)—interactive visualization and analysis of imaging spectrometer data. Remote Sensing of Environment, 44, 145–163. doi:10.1016/0034-4257(93)90013-N
- Lévesque, J., et al., 1997. Spectral unmixing for monitoring mine tailings site rehabilitation, Copper Cliff Mine, Sudbury, Ontario. Proceedings 12th international conference and workshops on applied geologic remote sensing, 17–19 November, Denver, CO.
- Nordstrom, D.K. and Alpers, C.N., 1999. Geochemistry of acid mine waters. In: G.S. Plumlee and M.J. Logsdon, eds. The environmental geochemistry of mineral deposits. Part A: Processes, techniques, and health issues. Littleton, CO: Society of Economic Geologists Inc., Reviews in Economic Geology, 6A, 133–160.
- Olías, M., et al., 2006. Evaluation of the dissolved contaminant load transported by the Tinto and Odiel rivers (Southwest Spain). Applied Geochemistry, 21, 1733–1749.
- Riaza, A. and Carrère, V., 2010. Monitoring of superficial contamination produced by massive sulphide mine waste along the Odiel River (Andalousia, Spain) using hyperspectral data. In: IGARSS 2009 Geoscience and remote sensing symposium, 13–17 July, Cape Town, III-1701–III-1704, ISBN: 978-1-4244-3394-0.
- Riaza, A. and Müller, A., 2010. Hyperspectral remote sensing monitoring of pyrite mine wastes: a record of climate variability (Pyrite Belt, Spain). Environmental Earth Sciences, 61–3, 575–594.
- Riaza, A., et al., 2011b. Pyrite mine waste and water mapping using HyMap and Hyperion hyperspectral data. Environmental Earth Sciences, 66–7, 1957–1971.
- Riaza, A., et al., 2011c. Monitoring the extent of contamination from acid mine drainage in the Iberian Pyrite Belt (SW Spain) using hyperspectral imagery. Remote Sensing, 3, 2166–2186. doi:10.3390/rs3102166
- Riaza, A., et al., 2012a. River acid mine drainage: sediment and water mapping through hyperspectral Hymap data. International Journal of Remote Sensing, 33 (19), 6163–6185. doi:10.1080/01431161.2012.675454
- Riaza, A., et al., 2012b. Mapping acid water on an acid mine drainage contaminated river with hyperspectral Hymap data (River Odiel, Huelva, Spain). Proceedings 4th workshop on remote sensing and geology, 24–25 May, Mykonos, 163–177.
- Riaza, A., García-Meléndez, E., and Mueller, A., 2011a. Spectral identification of pyrite mud weathering products: a field and laboratory evaluation. International Journal of Remote Sensing, 32 (1), 185–208. doi:10.1080/01431160903439957
- Richter, R. and Schläpfer, D., 2002. Geo-atmospheric processing of airborne imaging spectrometry data. Part 2: atmospheric/topographic correction. International Journal of Remote Sensing, 23, 2631–2649. doi:10.1080/01431160110115834
- RSI, 2000. ENVI User´s Guide. Research Systems Inc. Publications.
- Sánchez España, J., et al., 2005. Acid mine drainage in the Iberian Pyrite Belt (Odiel River watershed, Huelva, SW Spain): geochemistry, mineralogy and environmental implications. Applied Geochemistry, 20, 1320–1356. doi:10.1016/j.apgeochem.2005.01.011
- Sarmiento, A.M., et al., 2009a. Hydrochemical characteristics and seasonal influence on the pollution by acid mine drainage in the Odiel River basin (SW Spain). Applied Geochemistry, 24, 697–714. doi:10.1016/j.apgeochem.2008.12.025
- Sarmiento, A.M., et al., 2009b. Inorganic arsenic speciation at river basin scales: the Tinto and Odiel rivers in the Iberian Pyrite Belt, SW Spain. Environmental Pollution, 157, 1202–1209. doi:10.1016/j.envpol.2008.12.002
- Schläpfer, D. and Richter, R., 2002. Geo-atmospheric processing of airborne imaging spectrometry data. Part 1: parametric orthorectification. International Journal of Remote Sensing, 23, 2609–2630. doi:10.1080/01431160110115825
- Swayze, G.A., et al., 1996. Mapping acid generating minerals at the California Gulch Superfund Site in Leadville, Colorado using imaging spectroscopy. In: R.O. Green, ed. Proceedings sixth annual JPL airborne earth sciences workshop. JPL Publication 96-4.
- Swayze, G.A., et al., 1998. Using imaging spectroscopy to cost-effectively locate acid-generating minerals at mine sites: an example from the California Gulch Superfund Site. Paper presented at Airborne Visible/Infrared Imaging Spectrometer (AVIRIS). Proceedings 1998 JPL Airborne Geoscience Workshop, Leadville, CO, 49–53.
- Swayze, G.A., et al., 2000. Using imaging spectroscopy to map acidic mine waste. Environmental Science and Technology, 34, 47–54. doi:10.1021/es990046w
- Velasco, F., et al., 2005. Mapping Fe-bearing hydrated sulphate minerals with short wave infrared (SWIR) spectral analysis at San Miguel mine environment, Iberian Pyrite Belt (SW Spain). Journal of Geochemical Exploration, 87, 45–72. doi:10.1016/j.gexplo.2005.07.002
- Zeinalov, Y. and Maslenkova, L., 2000. On the action spectra of photosynthesis and spectral dependence of the quantum efficiency. Bulgarian Journal of Plant Physiology, 26 (1–2), 68–69.