
Abstract
This study analyses the statistical and dynamic properties of time series of mean annual groundwater levels for the years 1961–2000, with the purpose of preparing reference statistics for the study period. Data came from 62 measurement stations of the groundwater observation network of the Institute of Meteorology and Water Management—the National Research Institute IMGW-PIB—located across the Wielkopolska Lowland (western Poland). Station-grouping criteria were as follows: the availability of a 40-year measurement series, spatial location, as well as separation of the aquifer from the surface. For estimating the time series structure of groundwater levels, the following stationarity tests were conducted: the augmented Dickey-Fuller (ADF) test and the Kwiatkowski-Phillips-Schmidt-Shin (KPSS) test, with positive results in 44% of the stations, the majority comprising a group that represents confined aquifers. Their non-stationarity was attributed to the presence of a long-term stochastic trend. In the majority of cases the groundwater-level frequency distributions were within the group of platykurtic distributions, right asymmetrical. In the period studied, 62% of the series showed a downward tendency of groundwater levels, including 45% for which the trend was statistically significant; a rising trend was only statistically significant in half of the series. The masking effect of anthropogenic factors was indicated as a fundamental element interfering with the statistical properties of the groundwater observation series in the period 1961–2000 in the Wielkopolska Lowland. This information can be of use for the management and protection of water resources and in prognostic studies on modifying aquiferous systems with recorded water deficits.
Editor D. Koutsoyiannis; Associate editor T. Ouarda
Résumé
Cette étude analyse les propriétés statistiques et dynamiques des séries temporelles de piézométries moyennes annuelles pour les années 1961–2000, dans le but d’élaborer des statistiques de référence pour la période en question. Les données proviennent de 62 stations du réseau d’observation des eaux souterraines de l’Institut de météorologie et de gestion de l’eau (Institut national de recherche IMGW-PIB) qui étaient situés à travers la plaine de Wielkopolska (Ouest de la Pologne). Les critères de regroupement de stations ont été les suivants : une série de mesures de 40 ans, la localisation spatiale, ainsi que la séparation de l’aquifère de la surface. Pour l’estimation de la structure des séries temporelles de piézométrie, les tests de stationnarité suivants ont été réalisés: le test de Dickey-Fuller augmenté et le test de Kwiatkowski-Phillips-Schmidt-Shin (KPSS), avec des résultats positifs pour 44% des stations, la majorité comprenant un groupe qui représente les aquifères captifs. Leur non-stationnarité a été attribuée à la présence d’une tendance stochastique à long terme. Dans la majorité des cas, les distributions de fréquences des piézométries étaient dans le groupe des distributions platykurtiques, asymétriques à droite. Au cours de la période étudiée, 62% des séries montré une tendance à la baisse de la piézométrie, dont 45% pour lesquelles la tendance était statistiquement significative; une tendance à la hausse n'était statistiquement significative que dans la moitié des séries. L’effet de masquage par les facteurs anthropiques a été identifié comme un élément fondamental interférant avec les propriétés statistiques des chroniques piézométriques 1961–2000 dans la plaine de Wielkopolska. Cette information peut être utile pour la gestion et la protection des ressources en eau et dans les anticipations des modifications des systèmes aquifères où un déficit a été observé.
INTRODUCTION
The basis for estimating regularities of the groundwater regime is provided by spatial analyses of selected characteristics in relation to different periods and study scales (Döll Citation2009, Koutsoyiannis Citation2011). These take into account the hydrogeological and geomorphological conditions of groundwater occurrence and circulation, and also include their relationship to the hydrographic network of the area, which requires the transfer and extrapolation of spatial data. The spatial scale problem, which is described in the principles of the concept of hierarchical scale combination (Blöschl Citation2001, Lin and Rathbun Citation2003, Koutsoyiannis Citation2013), is substantiated by cartographic and model studies of complex water-bearing systems (Sveinsson et al. Citation2003, Ali et al. Citation2012, Varouchakis et al. Citation2012, Toth Citation2013). The utilitarian aspect stresses the significance of the development of a groundwater monitoring network and a geographic information system (GIS) which would enable the collection, processing and verification of data on variability and trends in their levels (Taylor and Alley Citation2001, Ghile et al. Citation2010, Singh et al. Citation2013).
The water table location index illustrating its current position relative to water level zones is, besides the indices of chemical quality and the condition of water resources, an element of environmental groundwater level assessment. Observations and research in this area are now being conducted in Poland by the Polish Geological Institute—the National Research Institute, PIG-PIB (PIG–PIB Citation2011)—based on its own integrated observation network as well as on that of the Institute of Meteorology and Water Management—the National Research Institute, IMGW-PIB (Warsaw, Poland). Information on groundwater-level fluctuations and their incidence constitutes a basis for land development plans and investment projects as well as for water resource conservation implemented within the drainage basin. The significance of shallow groundwater in research has recently increased in connection with the development of environmental hydrogeology and water indexing, in which statistical and geostatistical methods are used (Wu et al. Citation2006, Lamoreaux et al. Citation2008, Kundzewicz and Döll Citation2009, Grönwall Citation2011). Research has been undertaken into the susceptibility of shallow water-bearing systems to the influx of contaminants from the land surface, as well as estimations of the trends of groundwater-table fluctuations in areas with a risk of groundwater degradation (Pillai Citation2003, Leblanc Citation2007, Re and Zuppi Citation2011).
Groundwater-level time series characteristics are used in calculations to guarantee probability as well as average and extreme value repeatability (Konoplancew and Siemionow Citation1979, Chełmicki Citation1991, Doglioni et al. Citation2010, Graf Citation2010, Van Camp et al. Citation2010). In this area the most often considered are measures characterizing groundwater table variability, such as the amplitude and progress of fluctuations with the time limit of occurrence of characteristic levels, and water-level frequency. A groundwater table is also assessed in terms of its tendency over a number of years, the verification of which is difficult due to observation periods that are too short (Patil and Deng Citation2012). Long-term water-table fluctuations provide a basis for assessing the influence of climatic conditions and the seasonality of recharge processes and runoff on their temporal variability (Bates et al. Citation2008, Goulden et al. Citation2009, Kundzewicz and Döll Citation2009). Groundwater fluctuation models are used to characterize groundwater systems and to carry out research on their dynamics, most often in relation to precipitation and variations in use (Knotters and Bierkens Citation2000, Von Asmuth and Knotters Citation2004). Statistical methods used in trend analysis vary from simple linear regression equations to more complicated parametric and non-parametric methods (Helsel and Hirsch Citation2002, Doglioni et al. Citation2010, Panda et al. Citation2012). In the estimation of a groundwater table trend over a period of a given number of years, HARTT (Hydrograph Analysis: Rainfall and Time Trends) and PIRFICT (Predefined Impulse Response Function In Continuous Time) models have been used (Ferdowsian et al. Citation2001, Yihdego and Webb Citation2010). Methodological difficulties in the assessment of contemporary groundwater trends in high-seasonality drainage basin systems are emphasized (Aziz and Burn Citation2006, Shamsudduha et al. Citation2009, Taylor et al. Citation2009). Indicating the direction of groundwater table changes for a measurement series conducted over a number of years is not, however, a constant phenomenon, but often a fragment of a longer cycle determined by a more or less distinct tendency of an apparently constant character (Koutsoyiannis et al. Citation2007, Graf Citation2010). It is presumed that upward and downward trends are of a linear character or are well represented by short, linear segments in their data structures (Ferdowsian and Pannell Citation2001, Kalf and Woolley Citation2005). New approaches in groundwater dynamics research combine time series, the results of groundwater modelling and ecohydrological models, provided that the response of the system to an impulse is shaped by more or less regular recharge periods as well as losses related, for example, to evapotranspiration (Winter et al. Citation1998, Von Asmuth and Maas Citation2001, Zhang and Savenije Citation2005, Thangarajan Citation2007, Re and Zuppi Citation2011). This approach is preferred in phreatology, which characterizes groundwater systems by using information on groundwater ecology, hydrochemistry and modelling which is integrated by tele-detection systems and the geographic information system GIS (Batelaan Citation2006).
An element modifying and often also masking the influence of natural factors on the formation of groundwater regime features is human activity (Norman et al. Citation2001, Grönwall Citation2011). Under Polish conditions, elements significantly influencing the level of groundwater resources include exploitation of groundwater and natural resources or its cessation (Chełmicki Citation1991, Buczyński and Staśko Citation2004, Graf Citation2012), as well as amelioration and urbanization processes. Anthropogenic changes that progress with time are ascribed a linear character and regarded as a measure of influences on groundwater-level variability and other hydrological and meteorological characteristics (Fenicia et al. Citation2005).
SCOPE OF THE RESEARCH
Information on variations in the level of shallow groundwater located within the potamic zone of a drainage basin is of particular significance for the preparation of hydrological and agro-meteorological prognoses (Graf Citation2012). Groundwater occurring within the draining range of hydrographic features helps maintain the continued functioning of river systems, wetlands and lakes, in particular during low water and hydrological drought. They are also a significant factor regulating and maintaining the right moisture conditions in land use, as well as in agricultural and plant vegetation systems. However, due to short groundwater measurement sequences, there is still little information concerning the influence of temporal and spatial fluctuations of their water tables on the productivity and structural diversity of plants (Riis and Hawes Citation2002, Kowalczak et al. Citation2007). Moreover, water in shallow aquifers also acts as an intermediate link in the recharge of confined groundwater, which usually forms rich usable horizons and also, often, so-called primary aquifers which need special protection.
Taking into account the role of shallow groundwater in the hydrological cycle, mainly as an element determining the functioning of land ecosystems that are dependent on such groundwater, research commenced on identifying selected characteristics of the structure and dynamics of water-table fluctuations. An estimation was conducted of the long-term variation of mean annual groundwater levels of shallow aquifers in the Wielkopolska Lowland area, i.e. in the west of Poland, which is classified as a region with observed substantial water deficits. The procedure included characterization of selected structural features of groundwater level measurement series and evaluation of their degree of similarity at selected points of the observation network, with the possibility of calculating reference statistics for the period 1961–2000. In order to achieve the objective, 62 groundwater observation stations, located in the Wielkopolska Lowland (), were designated within the measurement network of the National Research Institute (IMGW-PIB).
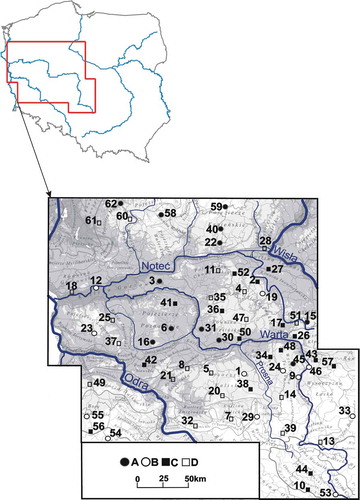
Fig. 1 Locations of the IMGW-PIB observation stations that were considered for the paper (station numbering is consistent with , and ) showing the tendency of mean annual series of groundwater levels in the Wielkopolska Lowland (western Poland) in the years 1961–2000: A – stations with significant increasing tendencies; B – stations showing no significant increasing tendencies; C – stations with significant decreasing tendencies; and D – stations showing no significant decreasing tendencies.
In order to estimate the time series structure of groundwater levels, their stationarity and homogeneity, the distribution type of the variable being analysed and the long-term tendency of the variability in the water table were all examined (). The analysis was supplemented with temporal and spatial autocorrelation studies. The results of the research have enabled the identification of similarities and differences regarding the structural characteristics of temporal series of groundwater levels at each station (), as well as irregularities in the structure that might be indicative of the presence of factors interfering with the properties being analysed.
Table 1 Structure and statistical properties of the measurement series of groundwater levels in the IMGW-PIB observation station groups located in the Wielkopolska Lowland (1961–2000).
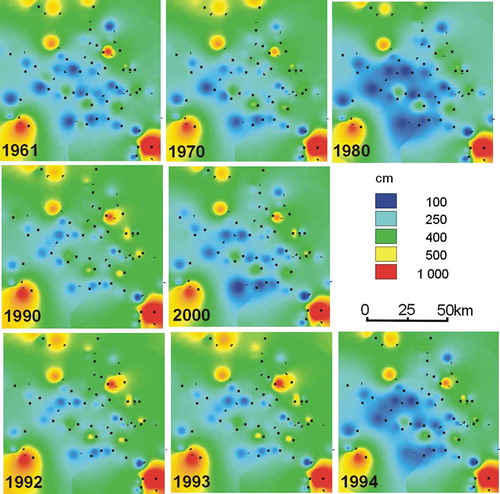
Fig. 2 Spatial variation of mean annual groundwater levels in selected time sequences in the period 1961–2000.
On this basis, dominant and accessory characteristics were determined in the structure of the shallow water table measurement series for the period studied, and the tendencies of the hydrodynamic equilibrium to change or remain stable were indicated. Accessory symptoms can indicate rare or deviating-from-average properties of a water circulation system, which are shaped by local factors that are often related to an anthropogenic impact. As a consequence, in the long term, manifestations of anthropogenic irregularities of groundwater regime characteristics and hydrodynamic equilibrium disruptions can be expected (Konoplancew and Siemionow Citation1979, Toth Citation2009, Graf Citation2012, Koutsoyiannis Citation2013).
The reference statistics of groundwater-level time series obtained for the Wielkopolska Lowland should be treated as valuable documentation material for potential use in future research, and can be used to update hydrographical and hydrogeological data that are a thematic component of the national spatial information infrastructure. Fluctuations of the shallow groundwater level, and in particular its recorded downward tendency, present a threat to the natural values of ecosystems that are dependent on waters, especially mires, which are often unique on a trans-regional scale. Due to this fact it was concluded that the results of the analyses being conducted, as source and benchmark material, can provide a significant contribution to research on the functioning of and changes in special habitat conservation areas designated across the Greater Poland region (Wielkopolska) under the European Ecological Network of NATURA 2000 areas.
At the first stage of analysis of reference statistics for groundwater levels, a grouping of the observation points was carried out by taking into account the following criteria: the availability of a 40-year measurement series of groundwater levels, spatial location (upland or lowland), isolation of the aquifer from the surface (confined and unconfined aquifers), and the periodical mean groundwater table depth (Graf Citation2010). Three types of station were designated: ones representing the upper clay aquifer (‘confined sand’) in the clay moraine upland and end moraine hills (Pi(W) = 33); those representing the unconfined horizon (‘unconfined sand’) in sand-gravel formations of sandur plains and the upland area (Po(S/W) = 23); and stations representing the unconfined horizon (‘unconfined sand’) of valley and glacial valley benches (Po(D) = 6)—(). The majority of groundwater stations of the IMGW-PIB network in Poland, which are located in the lowland areas, represent the upland type of low-permeability flat moraines, followed by those of high-permeability.
The spatial distribution of water in the ground horizon of the Wielkopolska Lowland reflects the relief of the area, which is the result of glacial and Holocene morphogenesis (Graf Citation2010). Morainic uplands predominate here: rolling and hilly and genetically related to the glaciation of the Oder in the southern part of the region and the Vistula (Poznan and Leszno phases) in its remaining part. The adopted division of groundwater observation stations was compared to the so-called ‘first aquifer’ groundwater zones: valley, upland and slope, with varying recharge types, geological-geomorphological, lithological and infiltration conditions. Alimentation conditions of shallow groundwater horizons reflect the influence of near-surface lithology elements and the recharge potential of precipitation. In the near-surface zone, Quaternary formations related to the influence of continental glacier and glacial water in glacial periods predominate; river water in interglacial periods, in depression zones (valleys, arheic depressions), river formations (alluvial soil) and organic (peat and aggregate mud) deposits occur. The spatial distribution of total annual precipitation in the Wielkopolska Lowland varies from between 650 mm in the southern and northern parts of the region to lowest values in the range 500–550 mm in the central part, which encompasses the area from the Poznan Lakeland to Kujawy. In terms of hydrographic structure, the Wielkopolska Lowland is part of the Oder basin and is drained mainly by the Warta and its tributaries (), and, in areas directly neighbouring the region, through tributaries of the Oder (Barycz, Bóbr, Ina, Myśla, Pliszka) and the Vistula (Brda, Bzura, Zgłowiączka). Evidence for the unfavourable water balance structure of the area also includes mean unit runoff of below 3.0 dm3 s-1 km-2, which is classified as being among the lowest in Poland.
The precipitation shortage and high evaporation losses recorded in the central part of the Wielkopolska Lowland influence drought incidence and the occurrence of major water deficits (Kowalczak et al. Citation2007), which then contribute to a decrease in the number of shallow aquifers located within the draining range of the hydrographic network. Groundwater shortages are a threat to the continued functioning of wetlands, which are important due to their unique natural value as special protection zones for habitats and birds selected for NATURA 2000 areas. In the region they occupy about 17% of the area. Some are, among others, sphagnum bogs, which are characterized by an abundance of rare and relict mosses (glacial relicts) and the presence of a great number of protected plant species (bryophytes) which have been threatened with extinction on a regional and national level, due to the influence of adverse natural as well as anthropogenic impact factors (Tobolski Citation1998, Lamentowicz et al. Citation2008).
Identifying a long-term downward tendency in the structure of a measurement series of groundwater levels can indicate the presence of an anthropogenic factor (e.g. draining water for use or soil improvement) in the process of quasi-permanent changes occurring in regional or local water circulation systems. It is emphasized that climate characteristics and water balance elements, usually treated as cyclo-stationary stochastic processes, require new estimation approaches and methods due to the high variability of annual cycles. In researching stochastic processes one needs to depart from a priori assumptions concerning their stationarity. In research on hydrological and meteorological (climatic) processes, it is increasingly demonstrated that processes generated in the catchment, mainly groundwater-fed outflow due to anthropogenic impact, lose their stationarity characteristics (Sveinsson et al. Citation2003, Cohn and Lins Citation2005, Koutsoyiannis Citation2006, Milly et al. Citation2008, Kundzewicz Citation2011).
MATERIAL AND METHODS
The research examined the characteristics of selected structural features of measurement series of mean annual groundwater levels at 62 points of the IMGW-PIB observation network (), most of which have consistent, i.e. in relation to a 40-year observation period, measurement series. In several stations the data series were complemented by the application of second-order polynomial interpolation (Graf Citation2010).
Many time series having hydrological and meteorological characteristics exhibit specific regularities, e.g. the presence of long-term trends or seasonal effects in the data (Von Storch Citation1995, Khaliq et al. Citation2009). Identification of the type of trends occurring in a measurement series makes it possible to select appropriate variants of forecasting methods, forecasting model parameters and methods of matching stationary models to the character of the data (Brockwell and Davis Citation2002, Chatfield Citation2004, Maddala Citation2008). Owing to the diverse character of data found in reality, verification of specific properties of a time series is only possible to a limited extent (Koutsoyiannis and Montanari Citation2007, Koutsoyiannis et al. Citation2007, Graf Citation2012, Patil and Deng Citation2012).
Two tests were used for the assessment of stationarity of the time series: the augmented Dickey-Fuller test (ADF) (Dickey and Fuller Citation1981) and the Kwiatkowski-Phillips-Schmidt-Shin test (KPSS) (Kwiatkowski et al. Citation1992). The ADF and KPSS tests are among the most commonly used testing methods for simulating variable stationarity or a process (the first approximation of which is the autocorrelation function, ACF) that is not a formal stationarity test. The concept of stationarity is interpreted here as the homogeneity of the properties of a time series of groundwater levels, i.e. an absence of systematic variations of the mean and variance with time shift, which corresponds to the so-called wide-sense stationarity (weak stationarity). In this case, covariance between the variables is dependent solely on their temporal distance, as opposed to narrow-sense stationarity (strong stationarity), where it is assumed that the distribution of a process is invariable in time (Hamilton Citation1994, Charemza and Syczewska Citation1998, Chatfield Citation2004, Lutkepol and Kratzig Citation2004). Non-stationarity can suggest the presence of factors interfering with the statistical properties of measurement series (e.g. anthropogenic impact).
In the ADF test the unit root null hypothesis (H0: p = 1) means a non-stationary process and the presence of a stochastic trend (random walk), whereas the alternative hypothesis (H1: p < 1) provides for the assumption of process stationarity, which excludes the occurrence of a stochastic trend (Dickey and Fuller Citation1981). In the test, stationarity of the series was determined for a test p value lower than the accepted significance level of 0.05, which meant rejecting the unit root hypothesis (null hypothesis, isolated element a = 1) and acceptance of the stationarity. If the measurement series is considered stationary, then, at the same time, the absence of a stochastic trend in the time series is assumed, which does not, however, preclude the presence of a deterministic trend. If a measurement series is not stationary, the unit root test (ADF) makes it possible to determine its cause, thus indicating whether a time series is trend stationary (stationary around a trend—no unit root) or difference stationary (non-stationary). In the KPSS test the null hypothesis is time series stationarity, and an alternative hypothesis is the presence of a unit root. A series is stationary if the test statistic value is less than the critical value at a significance level of 0.05 (Kwiatkowski et al. Citation1992).
The tests that were used allow us to determine variables influenced by random walk, i.e. by classifying them as stochastic trend variables. This means that they follow a linear trend, which has a different (random) slope in every period. As integration tests they allow for the use of the time series integration order, i.e. their differentiation, which can bring out hidden, periodical interrelations occurring in a groundwater-level observation series, e.g. the non-stationary variable is integrated (Charemza and Syczewska Citation1998, Abraham and Ledolter Citation2005, Maddala Citation2008).
The normal distribution is a continuous distribution described by the values of the arithmetic mean and standard deviation. Standard deviation from the mean level in the case of the existence of a long-term water table tendency can be a result of the occurrence of both variability and a long-term trend. Agreement of the measurement series with a normal distribution was determined using the Shapiro-Wilk test for distribution normality (test value and p value). The null hypothesis, postulating normal distribution of the time series, was dismissed for low values of the test statistic at a significance level of 0.05.
An initial group of statistical characteristics was calculated for each groundwater observation station with respect to measures of central tendencies, variation, asymmetry and dispersion. The groundwater level frequency was interpreted as the size (frequency) of measurements occurring within 10-cm class intervals, the number of which depended on the long-term amplitude quantity. At the modal level we adopted the mean value of the interval with the highest observation frequency, which indicates the number of years with the groundwater level within the mode interval (Mo). As the basis for isolating the type of groundwater level, frequency distribution was used as the relationship between the mean level from the period 1961–2000 and the modal value (Graf Citation2010). Due to the shape of the frequency distribution, unimodal, bimodal and multimodal series were isolated in the studied population. Conventionally, a measurement series was considered as relatively homogeneous if its empirical distribution was characterized by a single distinct maximum (mode) and there was moderate variation of its mean and median values as well as slight or absent asymmetry; whereas a multimodal series in which the difference between mean and median measures was clear was determined to be heterogeneous.
In order to estimate the direction and force of the asymmetry of groundwater-level frequency distribution, the skewness (asymmetry) coefficient, A, was used:
where s is standard deviation, n is the number of observations, xi is the mean groundwater level (variable) in the ith year of the period 1961–2000, and is the mean long-term groundwater level (1961–2000).
A negative skewness value represents negative asymmetry—left-sided (Al)—whereas a positive value represents positive asymmetry—right-sided (Ap)—of the groundwater level distribution. The skewness coefficient for the symmetrical distribution is equal (close) to zero.
Kurtosis, K, as a measure of the concentration of individual observations around the mean, was calculated using:
with other definitions as given in equation (1).
The linear regression method was used in the evaluation of the long-term tendency of mean annual groundwater levels over the years. The quality of trend function and data series match was determined by estimating the statistical significance of the coefficient of determination (R2) with the use of the Fisher-Snedecor distribution at a significance level of 0.05. In a situation where the tendency of the water table changes does not correspond to the tendency of climatic characteristics variability (e.g. precipitation and air temperature), the possibility of anthropogenic impact is assumed. Anthropogenic changes progressing in time are ascribed a linear character, thus they are treated as the measure of influences affecting the variability of groundwater levels. The long-term water table tendency is very often a fragment of long-term fluctuation, verification of which is difficult to conduct due to too-short observation periods. Furthermore, the heterogeneity that is found in the structure of data on mean groundwater levels could be evidence of there being no water table stabilization in the long-term period at the mean level, which could be caused by anthropogenic factors (Chełmicki Citation1991, Graf Citation2010).
Also, tests for autocorrelation in time were conducted by calculating the autocorrelation function (acf), and determining the autocorrelation order (rk), which indicates the variable value correlation with a value from the preceding year and from a period several years before. In order to determine the temporal autocorrelation rk we used an autocorrelation function in the following form:
where k is the autocorrelation order, T is the test period duration, and s2 is the x-variable variance.
Next, a null hypothesis for the absence of a significant correlation of order k was formulated, H0: pk = 0, against an alternative hypothesis, H0: pk ≠ 0. The null hypothesis was tested with the Ljung-Box statistic Q(k) in the following form:
The distribution of the statistic Q(k) is χ2 with k degrees of freedom.
Spatial autocorrelation between stations was determined using Moran’s I spatial autocorrelation statistics. Moran’s I was calculated as follows:
where wij are elements of a row-standardized matrix of spatial scales W, xi, xj are the observations, and n is the number of spatial units.
Spatial correlation patterns and the spatial dependence range were determined on the basis of correlograms. Contiguity was determined from the spatial weight matrix W, i.e. the nearest-neighbour matrix (point data) by taking into account the five nearest neighbours (Griffith Citation2007). Contiguities for each station were determined from the second up to the seventh order maximum on the basis of the matrix that was obtained; higher orders were not registered in the analysed data set.
RESEARCH RESULTS
The concept of stationarity of measurement series of groundwater levels in the period 1961–2000 was interpreted as homogeneity of the properties of the series, i.e. invariability along mean and variance time axes, for example. Measurement series stationarity was found in 27 stations (44%), with the majority from the group representing the ground level under conditions of Pi(W) water-bearing system isolation (). In the remaining 35 stations, the time series showed non-stationarity, which can be related to the presence of a long-term stochastic trend. In the Pi(W) well group the majority of stations showing measurement series stationarity were located in the eastern part of the Wielkopolska Lowland, in the reception basins of the tributaries of the River Warta (Noteć, Prosna, Kopel, Wełna)—, .
Table 2 Selected characteristics of the temporal series structure of groundwater levels for the period 1961–2000 in the station group Pi(W).
Table 3 Selected characteristics of the temporal series structure of groundwater levels for the period 1961–2000 in the station group Po(S/W).
Differences in the data structure were determined by comparing the results of the stationarity/non-stationarity tests of the series and the tendency of groundwater level changes in the studied period. It was observed that 61% of the investigated time series exhibited a downward trend of groundwater levels, including a statistically significant trend for 45% of the cases. A rising trend in the measurement series occurred in the case of 24 wells (38%), and was statistically significant in half of the cases ().
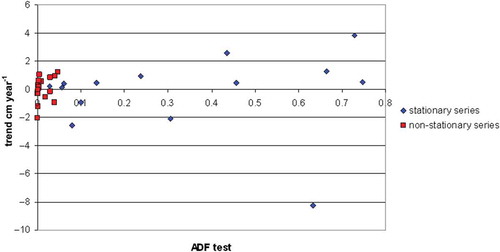
For stationary measurement series in the Pi(W) station group the linear trend ranges from between –2.0 and 2.0 cm year-1, and in the non-stationary measurement series the trend is between –8.28 and 3.85 cm year-1 (, ).
Fig. 3 The connection between measurement series stationarity/non-stationarity and the trend of the groundwater table in the station group Pi(W).
In the group of 23 stations representing the unconfined groundwater horizon Po(W/S), stationarity was observed only in eight series (). These stations are located in the reception basins of the River Warta tributaries: Prosna, Maskawa and Kanał Obrzański, in the border regions of the study area. The results of the adf and KPSS tests showed non-stationarity of the time series in the remaining 15 stations that were located mainly in the reception basin of the largest tributary of the Warta-Noteć, which is characterized by considerable anthropological changes of water conditions caused by amelioration works. In the group of stations with stationary series, tendencies range between –3.62 and 1.34 cm year-1 (, ); however, the absence of a significance of trends with the highest values needs to be stressed.
Fig. 4 The connection between measurement series stationarity/non-stationarity and the trend of the groundwater table in the station group Po(S/W).
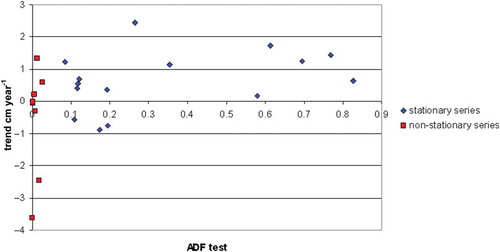
In the non-stationary series a smaller range of variability in the tendencies was observed, i.e. between –0.89 and 2.45 cm year-1. In the group of wells located in valleys, Po(D), a stationary series was identified only in one case; in the remaining five stations this series acquired non-stationarity characteristics (). In the non-stationary observation series the tendency of groundwater table changes was between –0.52 and 0.62 cm year-1, whereas for the stationary series a trend of 0.79 cm year-1 was statistically insignificant. The group of wells in the valley locations Po(D), due to their small number, was considered of too low a representative value to create reference models of measurement series.
Table 4 Selected characteristics of the temporal series structure of groundwater levels for the period 1961–2000 in the station group Po(D).
Consistency of the measurement series of groundwater levels for the period 1961–2000 with a normal distribution at a significance level of 0.05 was observed in 34 stations (), including 19 Pi(W) stations, 14 Po(W/S) and one Po(D). No such consistency was observed in 28 stations located mainly in reception basins that were generally used for agriculture.
The variability range of groundwater levels in the station groups was: 137–746 cm for Pi(W), 102–525 cm for Po(W/S), i.e. after excluding a marginal value obtained in the Brzeźnik station (SSW = 974 cm), and 182–326 cm in the Po(D) station group (). The marginal value in the Brzeźnik station was excluded before identifying the range. This record did not affect the later statistical analysis.
Fig. 5 Range of mean annual variability of groundwater levels in the period of 1961–2000 in the station group: A – Pi(W), B – Po(S/W), C – Po(D). The types of station group were defined in Explanations to .
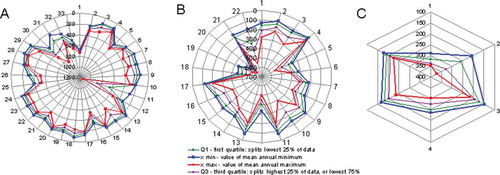
According to Gutry-Korycka (Citation1984) and Chełmicki (Citation1991), a shallow groundwater table in Poland occurs at a depth of 2.5 m on average, whereas in the lowland part of the Warta basin the depth is up to 2 m. The variability of groundwater levels was reflected in long-term amplitude values, which ranged from 0.5 m (Ruszów) to 6.1 m (Kołodziejewo), thus reaching values of up to 2 m in 80% of the stations (). The wide range of groundwater-level fluctuations in the Pi(W) and Po(W/S) station groups may indicate the lack of a distinct relationship between water-level fluctuations and the degree of isolation of the aquifer. In wells in the Pi(W) group, the significant fluctuations of groundwater levels are related, among other things, to the low capacity of the aquifers, which is reflected in the fast reaction of groundwater to the presence or absence of recharge (Graf Citation2012). The station locations are also of significance, which is, in turn, related to hydrodynamic zones with varying degrees of hydrological activity with respect to groundwater recharge rate and outflow (Doglioni et al. Citation2010, Panda et al. Citation2012, Singh et al. Citation2013).
The analysis of the distribution of groundwater level incidence was connected with an assessment of its degree of similarity in selected station groups. The number of years with groundwater levels within the mode interval (Mo) ranged from three (Brzeźnik) to 16 (Barcin), and no significant differences within individual groups of wells were observed (2, 3 and 4). In the case of 48 wells (76%), the distribution of water level incidence had the characteristics of right asymmetrical distribution (type Ap), which was identified in 24 Pi(W) and 22 Po(W/S) stations (). Left asymmetrical distribution (type Al) was determined in 17% of the stations, most of which are located in the upstream part of the Noteć basin. Symmetrical distribution (S type) was found in four observation stations: two Pi(W) and two Po(D). Relationships determined between skewness (Vs) and kurtosis (Vk) indicated that most of the distributions are within the right asymmetrical group and have positive values of the skewness coefficient; platykurtic (flat) distributions have negative kurtosis values ( and ).
Fig. 6 Coefficient distribution: variability (Vz), skewness (Vs) and kurtosis (Vk) in mean annual series of groundwater levels in the studied IMGW-PIB measurement station groups (1961–2000).
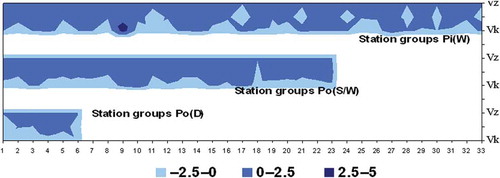
Fig. 7 The connection between the skewness coefficient (Vs) and kurtosis (Vk) in the measurement series of mean annual groundwater levels in the studied IMGW-PIB measurement station groups (1961–2000).

The predominance of right asymmetrical distributions was registered in stations where the groundwater tables reached depths of up to 2 m. With an increase in groundwater depth below 5 m, left asymmetrical distributions predominate in the Pi(W) wells, while in the Po(W/S) station group multimodal distributions are predominant. Numerical series whose empirical distribution was characterized by a single distinct maximum (mode), moderate variation of the mean and average values and slight asymmetry or its absence were considered to be relatively homogenous; whereas multimodal series in which the difference between the mean and average measures was clear were determined to be heterogeneous.
According to Konoplancew and Siemionow (Citation1979), Doglioni et al. (Citation2010) and Pirastru and Niedda (Citation2013) heterogeneous time series of groundwater levels are often observed in stations located in different hydrogeological regions or in areas influenced by local anthropogenic activity related to, for example, water intake inflow or groundwater rise areas within a water body.
DISCUSSION OF RESULTS
How the examined variable is distributed reflects the influence of natural conditions and anthropogenic activity affecting groundwater regime development in a quasi-permanent or periodical manner. Most of the analysed time series were characterized by a right asymmetrical distribution (), which corresponds to groundwater occurring at relatively shallow depths ( and ). Greater variety (Vz = 0.05–0.30) in mean annual groundwater levels was recorded at depths of 1–3 m, irrespective of the degree of insulation of the aquifer from the surface. The dispersion of annual levels around the mean value for the long-term period decreases with an increase in groundwater depth (). It is suggested that in the case of shallow groundwater occurrence, air temperature has a greater influence on aquifer formation than precipitation (Chen et al. Citation2004, Johnson et al. Citation2010, Pirastru and Niedda Citation2013). The trend of air temperature increase, which is taken into account in global climate models, may reduce net groundwater recharge (Döll Citation2009, Kundzewicz and Döll Citation2009).
A reduction in the number of years with groundwater levels in the mode interval (Mo) was observed as the long-term period amplitude increased (, and ). The highest frequency (10–16) in the investigated 40-year period is observed in stations where the long-term amplitude of groundwater levels does not exceed 1 m. Spectral analysis results conducted by Perez-Valdivia and Sauchyn (Citation2011) suggest the domination of modal value oscillation in groundwater horizons within intervals of 2–8 and 8–16 years. Gutry-Korycka (Citation1984), when researching the hydrological structure of Poland on the basis of data from the period 1931–1960, determined groundwater depth distribution as being approximate to normal with quite evident multimodality. The distribution of the incidence of groundwater levels in areas of direct contact with the land surface and the hydrographic network is generally connected with the distribution of precipitation, which exhibits asymmetry characteristics with a right-side tendency (Koutsoyiannis et al. Citation2007, Re and Zuppi Citation2011). Chełmicki (Citation1991) concluded that the standard deviation from the mean level, i.e. if a long-term groundwater table tendency exists, is the result of the occurrence of both variability and a long-term trend.
Symmetry of groundwater-level distribution, which was identified for a small number of cases (), is present when the aeration zone regulates the inflow of water infiltrating into the water-bearing horizon and its oscillations are balanced by groundwater runoff and evaporation. This kind of situation occurs most frequently in divide and upper-valley bench zones (Graf Citation2012). This asymmetrical distribution dominance in the investigated 40-year period is related to the range of mean annual level deviations from the average long-term value. Standard deviation is from 2% (Biała) to 30% (Kołodziejewo, Liszkowo) of water level variation. The dominant process is groundwater recharge in stations representing confined horizons in divide and highland locations (Knotters and Bierkens Citation2000, Singh et al. Citation2013). A groundwater recharge–outflow mechanism is present in partly confined and unconfined horizons with an average slope gradient (Kishel and Gerla Citation2002, Batelaan et al. Citation2003, Bogena et al. Citation2005, Batelaan Citation2006). In sandur plains the groundwater recharge is related to the most favourable infiltration type, i.e. it can be balanced to a greater extent by evaporation, which applies mainly to areas that are moderately drained by the hydrographic network (Johnson et al. Citation2010, Pirastru and Niedda Citation2013).
The development of a state of balance equilibrium in the shallow water-bearing system for the 40-year period in question is probably impeded by the masking action of anthropogenic factors. The anthropogenic groundwater regime types, e.g. exploitation, mining or amelioration (drainage or irrigation), are characterized by an increase in the long-term amplitudes and asymmetrical distributions of the groundwater table (Toth Citation2009, Grönwall Citation2011). Most of the stations with a left asymmetrical distribution type of groundwater level incidence were located in the upstream part of the Noteć basin (). This is an area that has been highly transformed due to irrigation, resulting in, among other things, a dense network of drainage ditches and channels and a lowering of the groundwater table in the drained areas. In this part of the region tendencies towards a constant lowering of the groundwater table should be anticipated, and thus there is an increase in the incidence of below-average levels (Graf Citation2010). The results of the ADF test confirm the heterogeneity of the observation series in the wells of this area (Barcin, Kołodziejewo, Zaryń) (, and ). Significant groundwater level variation in the period 1961–2000 was observed in those stations where the observation series showed non-stationarity characteristics (). This is confirmed by results of analyses of autocorrelation orders (Rk) which indicate correlation of the variable value with the value for the preceding year and for the period from several years before. For a majority of the stations, autocorrelation of the first order (Rk = 1) was obtained, which is a correlation of the value of each variable with a value from the preceding year. An autocorrelation of observations several years apart, e.g. an autocorrelation of the orders Rk = 2 and Rk = 3, was also identified. Tomalski (Citation2007), when investigating minimum series of annual groundwater levels in central Poland in the years 1951–2000, pointed to their high inertia and recorded lower inertia values in annual maximum series.
The downward trend of the groundwater table that was observed in 61% of the measurement series () might indicate the manifestation of a tendency for precipitation that decreases and an air temperature that rises. According to Chełmicki (Citation1991), who investigated the tendencies of shallow groundwater tables in Poland in the period 1961–1980, the upward trend that was dominant at that time was not confirmed by an incremental tendency of the precipitation totals. The results of analyses conducted for the period 1961–2000 confirmed the occurrence of regional regularities only to a small extent. No significant variation tendency was observed in Poland (Żmudzka Citation2002) and in the area of Wielkopolska in precipitation measurement series for that investigation period. Wielkopolska is considered to be one of the regions with the lowest precipitation in Poland, i.e. in the range of 500–550 mm (1966–2006). Furthermore, air temperature variability analyses in Poland conducted for the period 1951–2000 indicated a statistically significant increase in the mean annual temperature and a decrease in its annual amplitude (Kożuchowski and Żmudzka Citation2001). Similar results were obtained for the Wielkopolska area based on data for the period 1966–2006, where a statistically significant increase in the mean annual temperature was observed (Kasprowicz and Mager Citation2007).
A statistically significant downward tendency in groundwater level series was recorded in the upstream part of the Noteć basin (Barcin, Kalina, Nowa Wieś Wielka) (), and partially in the Warta and Prosna interfluve (, and ). The non-stationarity of the measurement series and the linear regression model determined in this case indicate the influence of a factor, which contributes to the intensification and reinforcement of the tendency for a constant lowering of the groundwater table. A fundamental element, interfering with the statistical properties of measurement series of hydrological characteristics in this part of the region is most often regarded to be the land amelioration processes that have been conducted here on a large scale since as early as the 19th century. At present, a recovery tendency of groundwater reserves in reception basins is visible in Poland due to the reduction or cessation of the consumption of groundwater reserves, which is of fundamental significance for deeper usable groundwater horizons (Buczyński and Staśko Citation2004).
The direction of changes of the groundwater table indicated for the period 1961–2000 is not, however, a permanent phenomenon (Ferdowsian et al. Citation2001). In the case of long-term observation series, cyclical fluctuations can be recorded, and in shorter periods it is possible to determine a fragment of a longer cycle by the more or less clear tendency of an apparently permanent character (Chełmicki Citation1991, Ferdowsian and Pannell Citation2001, Taylor and Alley Citation2001, Kundzewicz and Döll Citation2009, Panda et al. Citation2012). In a situation where the tendency of the groundwater table changes does not correspond to the tendency of precipitation variability, the possibility of the influence of anthropogenic factors is assumed, and its changes, which progress in time, are attributed a linear character. The anthropogenic factor, which acts with varying strength and intensity on water conditions, can be considered in the Wielkopolska Lowland to be one of the primary causes of the absence of spatial autocorrelation of statistical and dynamic properties of time series of mean annual groundwater levels (Graf Citation2012).
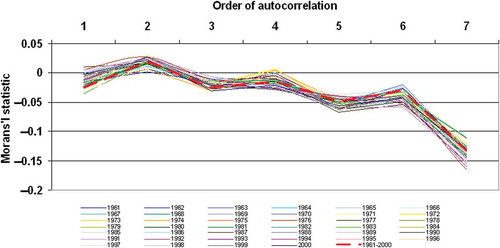
An analysis of the correlograms prepared on the basis of Moran’s I statistic did not confirm the presence of spatial autocorrelation between the stations with respect to the action of structural features of the measurement series of groundwater levels in the period 1961–2000 (). The established absence of spatial interrelation is stable in time. In the investigated area a statistically insignificant negative spatial groundwater-level autocorrelation is present in most cases. This may also be proof of the absence of stationarity in the spatial process. This information, together with data on the location of stations (in relation to the hydrogeological and hydrodynamic structures of the groundwater circulation system), are both essential in selecting a representative group for conducting analyses on the spatial characteristics of the groundwater regime (Zhang and Savenije Citation2005, Toth Citation2009, Doglioni et al. Citation2010, Pirastru and Niedda Citation2013). Reference statistics of the measurement series of groundwater levels, prepared for the period 1961–2000, refer to spatially varying models (), thus indicating local variation of the morphological conditions and different degrees of hydrological activity with respect to groundwater recovery and outflow.
Fig. 8 Moran’s I spatial autocorrelation statistic—correlograms for the years 1961–2000. Order of autocorrelation (order of neighbourhood 1–7 on the basis of the spatial weight matrix).
Interrelations between groundwater variability, tendency models and the hydrological mechanism, i.e. recharge, recharge–outflow and outflow, which shape the particular models were pointed out, among others, by Salama et al. (Citation1993, Citation2003), Winter et al. (Citation1998), Ferdowsian et al. (Citation2001), Taylor and Alley (Citation2001), Von Asmuth and Maas (Citation2001), Batelaan (Citation2006), Thangarajan (Citation2007), Goulden et al. (Citation2009), Yihdego and Webb (Citation2010), Patil and Deng (Citation2012), and for Polish conditions by Gutry-Korycka (Citation1984), Chełmicki (Citation1991), Tomalski (Citation2007) and Graf (Citation2012).
CONCLUSIONS
The subject of the research was the shallow groundwater of an active water exchange zone in a catchment, which, due to its occurrence conditions and the character of its connections to a hydrographic network, forms local circulation systems. An analysis of the time series of mean annual groundwater levels in the period 1961–2000 which was conducted for 62 IMGW-PIB observation stations located in the Wielkopolska Lowland (western Poland) has allowed us to estimate their statistical and dynamic properties. The final results made it possible to determine reference statistics in groups of stations that were representative of this region.
The conducted research has shown that the relationships between elements of the local groundwater circulation systems and the group of climatic and environmental factors which contribute to the formation of their structure and function, occur on various levels of spatial organization of the systems, as well as on the scale and form of the hydrological processes. As significant identifiers of the time series structure we adopted: stationarity/non-stationarity of the measurement series, their consistency/inconsistency with a normal distribution and the type of the long-term groundwater table tendency model. Highlights of the analysis concerning the structure of time series of groundwater levels were: non-stationarity of the time series attributed to the stochastic trend; the series showed a right asymmetrical distribution type and a downward tendency for groundwater levels, and the anthropogenic factor was indicated as an element interfering with homogeneity.
The group of factors influencing the character of the structure of time series of groundwater levels were indicated as climatic factors and terrain factors which applied to, among others, the degree an aquifer was confined/unconfined and the station location in relation to the hydrogeological and hydrodynamic structures of the groundwater circulation system. In the investigated region the influence of anthropogenic factors and the cessation of their effects on the variation of shallow groundwater levels was also not excluded. It was shown that a characterization of the degree of isolation of the systems provides a basis for the evaluation of the confinement and inertia of groundwater circulation systems, which regulate its stability and hydrodynamic equilibrium.
The heterogeneity detected in the structure of data of mean groundwater levels might be proof of water table destabilization in the long term at an average level, which could be influenced by anthropogenic factors. However, identification of such factors is impeded due to the fact that IMGW-PIB groundwater observation stations are most often located in places with natural or quasi-natural groundwater circulation conditions. According to Chełmicki (Citation1991) and Kundzewicz and Döll (Citation2009), in observed series of groundwater levels, many measurement stations give no reflection of the recorded tendency of the groundwater table to fall as a result of human activity, which is often local in character.
The research procedure adopted in this paper made it possible to apply statistical methods as well as evaluate their usefulness in research on shallow groundwater systems. The problem presented here lies in identification and diagnostic hydrological research, the basis of which are diagnostic variable datasets. The results obtained may constitute the basis for an assessment of regional or local regularities (Graf Citation2012). Creating a set of models of shallow groundwater is of key significance in research on water circulation conditions at different spatial scales; it can also contribute to expanding the type and scope of information for the needs of various fields of economy. The information focus on shallow groundwater as carried out in the paper, i.e. in the form of diverse databases, can supplement existing databases with a thematic character, e.g. either hydrological or hydrogeological. This information can also be of use in the formation and management of water resources, thus making it possible to determine methods for their utilization and protection in keeping with the principles of ecological and sustained development of a particular area. This is significant from the point of view of documenting and prognostic studies of modifying aquiferous systems, in particular for areas with recorded water deficits.
The direction of change in the shallow water table level indicated in the Wielkopolska Lowland for the period 1961–2000 is not a permanent phenomenon, after all. The outlined changes do not show any signs of monotony, i.e. of unidirectional changes. Fluctuations were recorded with respect to a growth as well as a drop in their values for the respective years and in the spatial system of the region. This indicates an absence of stability in the shallow groundwater circulation system and confirms, to some extent, the thesis of a gradual loss of stationarity characteristics in processes contributing to their level (Koutsoyiannis et al. Citation2007, Goulden et al. Citation2009, Van Camp et al. Citation2010, Koutsoyiannis Citation2013). This is also confirmed by Kundzewicz’s (Citation2011) research, conducted for European and Polish conditions, under which characteristics (properties) of the systems, such as: total potential of the impact of changes (climate and non-climatic factors), potential variability, and total ability to adjust to variations (adaptive capacity), are classified as the primary elements of the risk of disruptions occurring in the hydrodynamic equilibrium of water circulation systems.
Due to the strong relationships between groundwater and ecosystems that are dependent on waters (mires), the obtained results are of key importance in monitoring, documenting changes and setting out protection measures, which has been underscored by the EU Water Framework Directive (Citation2000) and research by Tobolski (Citation1998) and Lamentowicz et al. (Citation2008). The importance of wetlands is also connected to their role in preserving biodiversity, often of trans-regional impact, and in carrying out goals for which the European network NATURA 2000 was established. In the near future, the Landscape Convention, which is currently in preparation, will take place on both a national and European levels, implementing its objectives, which entail defining ecological and landscaping plans. The identified reference characteristics for time series of shallow groundwater levels can be used in optimizing spatial planning methods by taking into account ecological and environmental protection conditions, which will contribute to the preservation of environmental features that possess a natural value.
Disclosure statement
No potential conflict of interest was reported by the author(s).
Acknowledgements
I would like to thank the reviewers and the Associate Editor, Professor Taha Ouarda, for coordinating the review, as well as the co-editor of the Hydrological Sciences Journal, Professor Demetris Koutsoyiannis, for their comments which helped improve the manuscript.
I would like to thank Dr Tomasz Kossowski (Institute of Socio-Economic Geography and Spatial Management at Adam Mickiewicz University Poznan, Poland) for conducting the statistical analyses of the measurement series of groundwater levels, and the Institute of Meteorology and Water Management – the National Research Institute in Warsaw (Poland) – for providing access to its groundwater database for the period 1961–2000.
Additional information
Funding
REFERENCES
- Abraham, B. and Ledolter, J., 2005. Statistical methods for forecasting. New York: Wiley–Interscience Publication.
- Ali, G., et al., 2012. A comparison of similarity indices for catchment classification using a cross-regional dataset. Advances in Water Resources, 40, 11–22. doi:10.1016/j.advwatres.2012.01.008
- Aziz, O.I.A. and Burn, D.H., 2006. Trends and variability in the hydrological regime of the Mackenzie River Basin. Journal of Hydrology, 319 (1–4), 282–294. doi:10.1016/j.jhydrol.2005.06.039
- Batelaan, O., 2006. Phreatology. Characterizing groundwater recharge and discharge using remote sensing, GIS, ecology, hydrochemistry and groundwater modeling. Brussel: Department of Hydrology and Hydraulic Engineering Faculty of Engineering Vrije Universiteit.
- Batelaan, O., De Smedt, F., and Triest, L., 2003. Regional groundwater discharge: phreatophyte mapping, groundwater modelling and impact analysis of land-use change. Journal of Hydrology, 275, 86–108. doi:10.1016/S0022-1694(03)00018-0
- Bates, B.C., et al., Eds., 2008. Climate change and water-Technical paper of the intergovernmental panel on climate change. Geneva: IPCC Secretariat.
- Blöeschl, G., 2001. Scaling in hydrology. Hydrological Processes, 15 (4), 709–711. doi:10.1002/hyp.432
- Bogena, H., et al., 2005. Distributed modeling of groundwater recharge at the macroscale. Ecological Modelling - ECOL MODEL, 187 (1), 15–26. doi:10.1016/j.ecolmodel.2005.01.023
- Brockwell, P.J. and Davis, R.A., 2002. Introduction to time series and forecasting. 2nd ed. New York: Springer-Verlag.
- Buczyński, S. and Staśko, S., 2004. Changes and tendency occurring in Lower Silesia groundwater management based on example from Bystrzyca River basin. In: PIG, ed. Geological and environmental problems of husbanding and the protection of Upper and the Central Odra valley. Wrocław: Publishing House PIG, 165–176. (In Polish).
- Charemza, W.W. and Syczewska, E.M., 1998. Joint application of the Dickey-Fuller and KPSS tests. Economics Letters, 61 (1), 17–21. doi:10.1016/S0165-1765(98)00149-9
- Chatfield, C., 2004. The analysis of time series. An introduction. 6th ed. Boca Raton, FL: Chapman & Hall/CRC.
- Chełmicki, W., 1991. Regime of shallow groundwater in Poland. Cracow: Jagiellonian University (In Polish).
- Chen, Z., Grasby, S.E., and Osadetz, K.G., 2004. Relation between climate variability and groundwater levels in the upper carbonate aquifer, southern Manitoba, Canada. Journal of Hydrology, 290 (1–2), 43–62. doi:10.1016/j.jhydrol.2003.11.029
- Cohn, T.A. and Lins, H.F., 2005. Nature’s style: naturally trendy. Geophysical Research Letters, 32 (23), L23402. doi:10.1029/2005GL024476
- Dickey, D.A. and Fuller, W.A., 1981. Likelihood ratio statistics for autoregressive time series with a unit root. Econometrica, 49, 1057–1072. doi:10.2307/1912517
- Doglioni, A., et al., 2010. Inferring groundwater system dynamics from hydrological time-series data. Hydrological Sciences Journal, 55 (4), 593–608. doi:10.1080/02626661003747556
- Döll, P., 2009. Vulnerability to the impact of climate change on renewable groundwater resources: a global-scale assessment. Environmental Research Letters, 4 (3), 035006. doi:10.1088/1748-9326/4/3/035006
- EU Water Framework Directive, 2000. Directive 2000/60/EC of the European Parliament and of the Council of 23 October 2000 establishing a framework for Community action in the field of water policy [online]. European Commission. Available from:: http://ec.europa.eu/environment/water/water-framework/ [Accessed 20 July 2013].
- Fenicia, F., et al., 2005. Is the groundwater reservoir linear? Learning from data in hydrological modelling. Hydrology and Earth System Sciences Discussions, 2, 1717–1755. doi:10.5194/hessd-2-1717-2005
- Ferdowsian, R. and Pannell, D.J., 2001. Explaining trends in groundwater depths: distinguishing between atypical rainfall events, time trends, and the impacts of treatments, In: F. Ghassemi, P. Whetton, R. Little, and M. Littleboy, eds. MODSIM 2001, International congress on modelling and simulation, Proceedings, Volume 2: Natural Systems (Part Two), 10–13 December, The Australian National University, Canberra. Canberra: Modelling and Simulation Society of Australia and New Zealand, 549–554.
- Ferdowsian, R., et al., 2001. Explaining groundwater hydrographs: separating atypical rainfall events from time trends. Australian Journal of Soil Research, 39, 861–875. doi:10.1071/SR00037
- Ghile, Y., Schulze, R., and Brown, C., 2010. Evaluating the performance of ground-based and remotely sensed near real-time rainfall fields from a hydrological perspective. Hydrological Sciences Journal, 55 (4), 497–511. doi:10.1080/02626667.2010.481374
- Goulden, M., Conway, D., and Persechino, A., 2009. Adaptation to climate change in international river basins in Africa: a review / Adaptation au changement climatique dans les bassins fluviaux internationaux en Afrique: une revue. Hydrological Sciences Journal, 54 (5), 805–828. doi:10.1623/hysj.54.5.805
- Graf, R., 2010. Tendencies in the changes of shallow groundwater levels in the Wielkopolska Lowland in the years 1961-2000. In: R. Graf and M. Marciniak, eds. Groundwater resources, endangering and protection. Studies and Papers in Geography and Geology 11. Poznan: Bogucki Publishing House, 79–95. (In Polish).
- Graf, R., 2012. The structure and functioning of local groundwater circulation systems within the Poznan Plateau. Poznan: Bogucki Publishing House. (In Polish).
- Griffith, D.A., 2007. Advanced spatial statistics. Berlin: Springer-Verlag GmbH.
- Grönwall, J., 2011. Groundwater dependence among poor urban people: out of sight is out of mind? International Journal of Urban Sustainable Development, 3 (1), 26–39. doi:10.1080/19463138.2010.547042
- Gutry–Korycka, M., 1984. The analysis and the models of hydrological structure of Poland. Warsaw: The Publishing House of Warsaw University. (In Polish).
- Hamilton, J.D., 1994. Time series analysis. Princeton, NJ: Princeton University Press.
- Helsel, D.R. and Hirsch, R.M., 2002. Statistical methods in water resources, book 4, hydrologic analysis and interpretation. Virginia: US Geological Survey.
- Johnson, E., et al., 2010. Evaporation from shallow groundwater in closed basins in the Chilean Altiplano. Hydrological Sciences Journal, 55, 624–635. doi:10.1080/02626661003780458
- Kalf, F. and Woolley, D., 2005. Applicability and methodology of determining sustainable yield in groundwater systems. Hydrogeology Journal, 13, 295–312. doi:10.1007/s10040-004-0401-x
- Kasprowicz, T. and Mager, P., 2007. Observed climatically tendencies on Wielkopolska Lowland. Poznan: 1 Poland Conference ADAGIO (In Polish).
- Khaliq, M.N., et al., 2009. Identification of hydrological trends in the presence of serial and cross correlations: A review of selected methods and their application to annual flow regimes of Canadian rivers. Journal of Hydrology, 368, 117–130. doi:10.1016/j.jhydrol.2009.01.035
- Kishel, H.F. and Gerla, P.J., 2002. Characteristics of preferential flow and groundwater discharge to Shingobee Lake, Minnesota, USA. Hydrological Processes, 16, 1921–1934. doi:10.1002/hyp.363
- Knotters, M. and Bierkens, M.F.P., 2000. Physical basis of time series models for water table depths. Water Resources Research, 36, 181–188. doi:10.1029/1999WR900288
- Konoplancew, A.A. and Siemionow, S.M., 1979. The prognosis and the cartographical mapping of groundwater regime. Warsaw: Geological Publishing House. (In Polish).
- Koutsoyiannis, D., 2006. Nonstationarity versus scaling in hydrology. Journal of Hydrology, 324, 239–254. doi:10.1016/j.jhydrol.2005.09.022
- Koutsoyiannis, D., 2011. Scale of water resources development and sustainability: small is beautiful, large is great. Hydrological Sciences Journal, 56 (4), 553–575. doi:10.1080/02626667.2011.579076
- Koutsoyiannis, D., 2013. Hydrology and change. Hydrological Sciences Journal, 58 (6), 1177–1197. doi:10.1080/02626667.2013.804626
- Koutsoyiannis, D., Efstratiadis, A., and Georgakakos, K., 2007. Uncertainty assessment of future hydroclimatic predictions: a comparison of probabilistic and scenario-based approaches. Journal of Hydrometeorology, 8 (3), 261–281. doi:10.1175/JHM576.1
- Koutsoyiannis, D. and Montanari, A., 2007. Statistical analysis of hydroclimatic time series: uncertainty and insights. Water Resources Research, 43 (5), W05429. doi:10.1029/2006WR005592
- Kowalczak, P., Mager, P., and Kępińska-Kasprzak, M., 2007. An assessment of water resources in the context of predicted climate changes in the Wielkopolska District area. Climate changes - opportunities, risks, adaptations. Poznan: Materials of Conference (In Polish).
- Kożuchowski, K. and Żmudzka, E., 2001. Assessment of relations between the normalised difference vegetation index (NDVI), frequency of forest fires, air temperature, sunshine, precipitation in Poland. Geographia Polonica, 74 (2), 29–40.
- Kundzewicz, Z.W., 2011. Nonstationarity in water resources - Central European perspective. JAWRA Journal of the American Water Resources Association, 47, 550–562. doi:10.1111/j.1752-1688.2011.00549.x
- Kundzewicz, Z.W. and Döll, P., 2009. Will groundwater ease freshwater stress under climate change? Hydrological Sciences Journal, 54 (4), 665–675. doi:10.1623/hysj.54.4.665
- Kwiatkowski, D., et al., 1992. Testing the null hypothesis of stationarity against the alternative of a unit root. Journal of Econometrics, 54, 159–178. doi:10.1016/0304-4076(92)90104-Y
- Lamentowicz, M., Obremska, M., and Mitchell, E.A.D., 2008. Autogenic succession, land-use change, and climatic influences on the Holocene development of a kettle hole mire in Northern Poland (Northern Poland). Review of Palaeobotany and Palynology, 151, 21–40. doi:10.1016/j.revpalbo.2008.01.009
- Lamoreaux, P.E., et al., 2008. Environmental hydrogeology. 2nd ed. ed. United States: CRC Press Inc.
- Leblanc, M., 2007. An investigation of the risk to natural assets from groundwater salinisation. Thesis (Project: NAP272). Monash and Deakin universities and Glenelg-Hopkins Catchment Management Authority.
- Lin, H. and Rathbun, S., 2003. Hierarchical frameworks for multiscale bridging in hydropedology. In: Y. Pachepsky, D.E. Radcliffe, and H.M. Selim, eds Scaling methods in soil physics. London: CRC Press, 347–371.
- Lutkepol, H. and Kratzig, M., 2004. Applied Time Series Econometrics. New York: Cambridge University Press.
- Maddala, G.S., 2008. Introduction to econometrics. Warsaw: Publishing House of the PWN. (In Polish).
- Milly, P.C.D., et al., 2008. Climate Change: stationarity is dead: whither water management? Science, 319, 573–574. doi:10.1126/science.1151915
- Norman, H.G., et al., 2001. Impact of human activity on groundwater dynamics. In: H.P.N.E. Gehrels, E. Hoehn, K. Jensen, Ch. Leibundgut, J. Griffioen, B. Webb, and W.J. Zaadnoordijk (eds.). Proceedings of an international symposium, IAHS Publication 269, 23–25 July, Maastricht.
- Panda, D.K., Mishra, A., and Kumar, A., 2012. Quantification of trends in groundwater levels of Gujarat in western India. Hydrological Sciences Journal, 57 (7), 1325–1336. doi:10.1080/02626667.2012.705845
- Patil, A. and Deng, Z.-Q., 2012. Input data measurement-induced uncertainty in watershed modelling. Hydrological Sciences Journal, 57 (1), 118–133. doi:10.1080/02626667.2011.636044
- Perez-Valdivia, C. and Sauchyn, D., 2011. Tree-ring reconstruction of groundwater levels in Alberta, Canada: long term hydroclimatic variability. Dendrochronologia, 29 (1), 41–47. doi:10.1016/j.dendro.2010.09.001
- PIG–PIB, 2011. Report and Prognosis Polish [online]. Geological Institute, National Research Institute. Available from: http://www.pgi.gov.pl [Accessed 20 July 2013].
- Pillai, M., ed., 2003. Groundwater monitoring for environmental condition and salinity management in the Glenelg-Hopkins region. The state of Victoria: Department of primary Industries Research Victoria.
- Pirastru, M. and Niedda, M., 2013. Evaluation of the soil water balance in an alluvial flood plain with a shallow groundwater table. Hydrological Sciences Journal, 58 (4), 898–911. doi:10.1080/02626667.2013.783216
- Re, V. and Zuppi, G.M., 2011. Influence of precipitation and deep saline groundwater on the hydrological systems of Mediterranean coastal plains: a general overview. Hydrological Sciences Journal, 56 (6), 966–980. doi:10.1080/02626667.2011.597355
- Riis, T. and Hawes, I., 2002. Relationships between water level fluctuations and vegetation diversity in shallow water of New Zealand lakes. Aquatic Botany, 74, 133–148. doi:10.1016/S0304-3770(02)00074-8
- Salama, R.B., et al., 1993. Distribution of recharge and discharge areas in a first-order catchment as interpreted from water level patterns. Journal of Hydrology, 143 (3–4), 259–277. doi:10.1016/0022-1694(93)90195-F
- Salama, R.B., et al., 2003. Capture of more recharge and discharge is the only means of increasing the sustainable yield of the Gnangara Mound, Western Australia. London: Environmental Management Series of IWA Publications.
- Shamsudduha, M., et al., 2009. Recent trends in groundwater levels in a highly seasonal hydrological system: the Ganges-Brahmaputra-Meghna Delta. Hydrology and Earth System Sciences, 13, 2373–2385. doi:10.5194/hess-13-2373-2009
- Singh, P., Thakur, J.K., and Kumar, S., 2013. Delineating groundwater potential zones in a hard-rock terrain using geospatial tools. Hydrological Sciences Journal, 58 (1), 213–223. doi:10.1080/02626667.2012.745644
- Sveinsson, O., et al., 2003. Modeling the dynamics of long term variability of hydroclimatic processes. Journal of Hydrometeorology, 4, 489–505. doi:10.1175/1525-7541(2003)004<0489:MTDOLV>2.0.CO;2
- Taylor, C.J. and Alley, W.M., 2001. Groundwater level monitoring and the importance of long-term water-level data. Denver, Colorado: US Geological Survey, U.S.G.S. Circular 1217.
- Taylor, R.G., Koussis, A.D., and Tindimugaya, C., 2009. Groundwater and climate in Africa—a review. Hydrological Sciences Journal, 54 (4), 655–664. doi:10.1623/hysj.54.4.655
- Thangarajan, M., ed., 2007. Groundwater resource evaluation, augmentation, contamination, restoration, modeling and management. New Delhi: Capital Publishing Company.
- Tobolski, K., 1998. Peatlands and marsh ecosystems. In: K. Dobrowolski and K. Lewandowski, eds. The strategy of wetland protection in Poland. Dziekanów Leśny: Institute of Ecology PAS Publishing Office, 154–163.
- Tomalski, P., 2007. The extreme of groundwater levels in central Poland in the period 1951-2000. Acta Universitatis Lodziensis. Folia Geographica Physica, 8, 131–150, (In Polish).
- Toth, E., 2013. Catchment classification based on characterisation of streamflow and precipitation time-series. Hydrology and Earth System Sciences, 17, 1149–1159. doi:10.5194/hess-17-1149-2013
- Toth, J., 2009. Gravitational system of groundwater flow. Theory evaluation, utilization. Cambridge: Cambridge University Press.
- Van Camp, M., et al., 2010. Effects of multi-annual climate variability on the hydrodynamic evolution (1833 to present) in a shallow aquifer system in northern Belgium. Hydrological Sciences Journal, 55 (5), 763–779. doi:10.1080/02626667.2010.488075
- Varouchakis, E.A., Hristopulos, D.T., and Karatzas, G.P., 2012. Improving kriging of groundwater level data using nonlinear normalizing transformations—a field application. Hydrological Sciences Journal, 57 (7), 1404–1419. doi:10.1080/02626667.2012.717174
- Von Asmuth, J.R. and Knotters, M., 2004. Characterising groundwater dynamics based on a system identification approach. Journal of Hydrology, 296, 118–134. doi:10.1016/j.jhydrol.2004.03.015
- Von Asmuth, J.R. and Maas, C., 2001. The method of impulse response moments: a new method integrating time series, groundwater and eco-hydrological modeling. In: J.C. Geherls, et al., eds. Impact of human activity on groundwater dynamics. Wallingford: IAHS Publication, 51–58.
- Von Storch, H., 1995. Misuses of statistical analysis in climate research. In: H. Von Storch and A. Navarra, eds Analysis of Climate Variability: applications of Statistical Techniques. Berlin: Springer-Verlag, 11–26.
- Winter, T.C., et al., 1998. Ground water and surface water a single resource. Denver Colorado: U.S. Geological Survey Circular 1139.
- Wu, J., Zou, R., and Yu, S.L., 2006. Uncertainty analysis for coupled watershed and water quality modeling systems. Journal of Water Resources Planning and Management, 132 (5), 351–361. doi:10.1061/(ASCE)0733-9496(2006)132:5(351)
- Yihdego, Y. and Webb, J.A., 2010. Characterizing groundwater dynamics using transfer function-noise and auto-regressive modeling in Western Victoria, Australia. In: E.D. Schmitter and N. Mastorakis, eds. Proceedings of the 5th IASME/WSAS International Conference on water resources, hydraulics & hydrology, Proceedings of the 4th IASME/WSAS Int Conf on geology and seismology – water and geoscience, 23–25 February, University of Cambridge, Cambridge, 96–101.
- Zhang, G.P. and Savenije, H.H.G., 2005. Rainfall–runoff modelling in a catchment with a complex groundwater flow system: application of the Representative Elementary Watershed (REW) approach. Hydrology and Earth System Sciences, 9, 243–261. doi:10.5194/hess-9-243-2005
- Żmudzka, E., 2002. On the variability of precipitation in lowland Poland in the 2nd half of the 20th century. Institute of Meteorology and Water Management Messages, 25 (4), 23–38. (In Polish).