
Abstract
The annual water balance for 39 grid cells covering the savannah woodland region of Sudan (10–16°N; 21–36°E) was determined and regional maps produced. Long-term (1961–1990) mean monthly climate data, National Forest Inventory data and Harmonized World Soil Database data for arenosols and vertisols, the two dominant soil types in the region, were used. Model validation was performed using daily data from a site in one of the grid cells and inter-annual (1961–1990) variation examined for another grid cell. Rainfall varied from 147 to 732 mm and only exceeded evapotranspiration for 18 of the grid cells, resulting in a small increase in soil moisture and runoff. Evapotranspiration accounted for, on average, 96% of rainfall and there was little difference between soil types. Drainage only occurred from AR soils and for four of the grid cells. Runoff varied from 0 to 89 mm for arenosols and from 0 to 109 mm for vertisols. The study provided useful insights into the spatial variability in water balance components across the region.
Editor D. Koutsoyiannis; Associate editor D. Gerten
Résumé
Le bilan hydrologique annuel de 39 cellules couvrant la région des savanes boisées du Soudan (10–16°N; 21–36°E) a été calculé et des cartes régionales ont été établies. Les données utilisées sont : les données climatiques mensuelles (1961–1990), les données des inventaires nationaux des forêts et la base harmonisée mondiale de données sur les sols pour les arénosols et les vertisols, les deux types de sols dominants de la région. La validation du modèle a été réalisée en utilisant les données journalières à partir d’un site de l’une des cellules de la grille et la variation inter-annuelle (1961–1990) observée pour une autre cellule de la grille. Les précipitations varient de 147 à 732 mm et dépassent l’évapotranspiration pour seulement 18 des cellules de la grille, ce qui entraîne une légère augmentation de l’humidité du sol et du ruissellement. L’évapotranspiration moyenne représente 96% des précipitations et il y a peu de différence entre les types de sols. Le drainage ne se produit qu’à partir des arénosols et pour seulement quatre des cellules de la grille. Le ruissellement varie de 0 à 89 mm pour les arénosols et de 0 à 109 mm pour les vertisols. L’étude a fourni d’utiles indications sur la variabilité spatiale des composantes du bilan hydrologique dans la région.
1 INTRODUCTION
In arid and semi-arid regions (drylands), soil water availability is the main factor limiting plant growth, productivity and distribution (Fischer and Turner Citation1978, Webb et al. Citation1978, Stephenson Citation1990) and is strongly related to the amount of rainfall and evapotranspiration. Rainfall in dryland regions is not only low, but shows distinct seasonality and high spatial and temporal variation. The Sahel is currently experiencing a period of drought that began in the late 1960s (Le Houérou Citation1996), an increasing population growth and a decline in savannah woodland tree densities (Gonzalez Citation2001) threatening the health and livelihood of millions of people in the region.
Trees in the savannah woodlands of the Sahel are primarily Acacia species and occur as scattered individuals across the landscape (Griffith Citation1961, Bourliére and Hadley Citation1992). These trees protect against desertification and soil erosion, provide firewood, structural timber and non-timber products, and maintain habitats for plants, crops and animal production (Gonzalez Citation2001). Trees generally produce more litter and subsequently more soil organic matter than other types of vegetation, resulting in greater infiltration and retention of rainfall in the soil (Weltzin and Coughenour Citation1990, Githae et al. Citation2011). Planting trees in drylands can thus help restore degraded land and prevent desertification (FAO Citation2004). However, transpiration by the trees may exceed rainfall and so reduce the availability of soil water for growing crops and the flow of runoff to reservoirs (Malagnoux et al. Citation2007). Native trees are considered better than non-native species in this respect as they have been shown to conserve rather than deplete water resources (Ohte et al. Citation2003). Climate change in dryland regions may be expected to reduce tree densities and increase the extent of desertification (Hiernaux et al. Citation2009).
The water balance, in which rainfall is balanced against evapotranspiration, surface runoff, drainage and changes in soil water storage, is a useful way to assess and evaluate how rainfall is used in relation to soil type and vegetation. Evapotranspiration in arid and semi-arid regions is, by definition, greater than rainfall. Therefore, dryland regions are subject to a state of permanent evapotranspiration deficiency, a state to which native plants have adopted various strategies to allow them to cope (Fischer and Turner Citation1978). However, few water balance studies have been carried out for the savannah woodlands of the eastern Sahel region, an omission that is at least partly due to the lack of the necessary meteorological, vegetation and soil data.
In this paper we present the long-term (1961–1990) mean annual water balance for 39 grid cells covering the entire savannah woodland region of the Sudanese Sahel. This region is highly vulnerable to the availability of water resources (MEPD/HCENR Citation2003). The specific aims of the study were to determine how the water balance varies across the region in relation to rainfall, current woodland cover (above-ground biomass density) and soil type (arenosol vs vertisol). We hypothesized that evapotranspiration would be limited by the amount of rainfall and that soil moisture and runoff would be lower for sandy (AR) than for clay (VR) soils. A simple water balance model was used and maps of the resulting water balance components for the region produced using GIS mapping software. First, however, the model is described and validated using daily climate and soil moisture data that have been made available for a research site in one of the grids. As an example, the inter-annual variation in the water balance over the period 1961–1990 for one of the grid cells was also evaluated. The purpose of the study was to provide reference water balance information as part of a larger study dealing with carbon sequestration and impacts of climate change for the region (Alam and Starr Citation2013, Alam Citation2013, Alam et al. Citation2013).
2 MATERIALS AND METHODS
2.1 Study region and grid cells
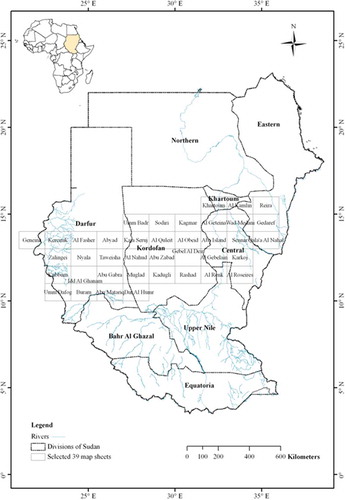
This study was carried out for the savannah woodland region (10–16°N; 21–36°E), referred to as the Acacia gum belt, of the former Sudan (now the Republic of the Sudan) (). We modelled the water balance for 39 1.0° latitude × 1.5° longitude grid cells (Haberlah Citation2005) that cover most of the savannah woodland region in Sudan. This grid size was used because it corresponds to the scale (1:250 000) at which National Forest Inventory (NFI) data are available (Glen Citation1996, FNC/MAF/FAO Citation1998). The NFI data enabled the woodland biomass to be estimated, and this was used to scale the crop coefficient parameter for calculating grid cell evapotranspiration (see Sections 2.2 and 2.4). The total area covered by the 39 grid cells is 0.8 × 10⁶ km2. The vegetation cover is savannah, mostly grasses with scattered shrubs and trees, the density of which generally increases southwards. Typical tree species present include Acacia senegal, A. raddiana, A. seyal and A. laeta, but species such as Commiphora africana occur, and woody shrubs, including Salvadora, Leptadenia and several species of Grewia, are also common (Griffith Citation1961, Obeid and Eldin Citation1970). The soils in the centre and west of the region are mainly sandy soils classified (FAO) as arenosols (AR, locally named “Qoz”), and those in the eastern part are mainly clay soils classified as vertisols (VR, locally named “Gradud”) (Ayoub Citation1998, FAO/IIASA/ISRIC/ISS-CAS/JRC Citation2009).
Fig. 1 Map shows administrative divisions (in bold letters) of Sudan and the 39 grid cells (1.0° latitude × 1.5° longitude) utilized in the study.
2.2 Water balance model description
A simple, single-layer, capacity type water balance model for freely draining soils, WATBAL (Starr Citation1999), was used to calculate the water balance for savannah woodland vegetation for each grid cell and soil type:
where P is rainfall, ET is actual evapotranspiration, R is surface runoff, D is drainage and ∆SM is the change in soil water storage; all units in mm. The model can be run at monthly or daily time steps and is based on that presented by Bonan (Citation1989). It requires climate data (temperature, precipitation and cloud cover) and data for a limited number of site, stand and soil parameters. Importantly, the relatively simple data input requirements means that the model, unlike more sophisticated and data demanding models, can be widely applied, and such simple models are more suited to arid and semi-arid regions than to humid regions (Pilgrim et al. Citation1988). The availability of data, particularly regional data, in dryland Africa is limited. Calculation of the modelled water balance components is described below.
2.2.1 Evapotranspiration
The Jensen-Haise alfalfa radiation equation (Jensen et al. Citation1990) was used to calculate reference crop evapotranspiration (ETo) values (mm):
where λ is the latent heat of vaporisation (MJ kg-1) (= 2.501 – 0.002 361T), CT and Tx are site-specific temperature constants (°C), T is the air temperature (°C), and Rs is the global radiation (MJ m-2 per day or month) for the site. The two site-specific temperature constants CT and Tx are calculated as follows:
where Elev is the elevation of the site (m a.s.l.); and e1 and e2 are the site saturation vapour pressure (eo kPa) at the mean daily maximum and minimum air temperatures, respectively, for the long-term warmest month of the year. The vapour pressures e1 and e2 were calculated using the Teten equation:
If global radiation data are available, then the values can be entered directly into the Jensen-Haise crop reference equation above (equation (2)). However, long-term global radiation data are not widely available, particularly for Africa, and Rs was therefore calculated from extraterrestrial solar radiation, Ra, and cloud cover, C, using an empirical equation developed by Black (Citation1956) based on data from 88 stations from around the world:
Solar radiation, Ra, was calculated from the solar constant, solar declination, latitude and sunrise/sunset hour angles for the centre of the grid cell and the time of year using the Milankovitch equation (e.g. Allen et al. Citation1998, equation 21). Note that in Black’s equation, Rs and Ra are expressed in units of cal cm-2 d-1 and so unit conversion of the resulting Rs values has to be carried out before use in the Jensen-Haise crop reference equation. For the monthly water balance model, which was used to calculate the long-term annual water balance for each grid cell in this study, a ‘representative-day-of-the-month’ approach was used to calculate monthly Rs values, i.e. Rs is calculated for the day representative of each month and then multiplied by the number of days in the month (Klein Citation1977).
The Jensen-Haise ETo values were converted into ET values in two steps: (a) taking into account the differences in plant and vegetation cover characteristics between the reference crop, alfalfa, and the savannah woodland; and (b) taking into account the availability of soil water that may be needed to meet any transpiration demand in excess of rainfall. The influence of the difference in plant and vegetation cover characteristics is accounted for by using a crop coefficient (Kc) (Allen et al. Citation1998):
where ETc is the evapotranspiration demand of the savannah woodland in each grid cell. The crop coefficient, Kc, is an empirical dimensionless value that integrates the differences in the morphological and physiological characteristics of the plant that affect transpiration: height, albedo, canopy resistance and evaporation from bare soil. In our water balance model, we also integrated the differences in vegetation cover among the grid cells by using woodland biomass density values (Mg ha-1) to scale Kc (as described in Section 2.4).
The evapotranspiration demand (ETc) is first met by the amount of effective rainfall, Peff (described below), but if the demand is not satisfied by Peff, then the unsatisfied part of the demand (ETc*) is transferred to the store of available moisture in the soil. The amount of ETc* that can then be satisfied by soil water (ETSM) is a function of the amount of available soil moisture:
where SM is the available soil moisture content of the rooting zone (mm). The available soil moisture content is limited by the amount of water that can be held by the soil when at field capacity (SMfc) and the amount of water that can be held when at permanent wilting point (SMpwp). The withdrawal of available soil moisture first takes place at the ETc* rate until a critical fraction of the available soil moisture content is reached (SMcrit); below this limit any further evapotranspiration demand on the soil moisture is met at a reduced rate (SMrate) until the SMpwp limit is reached. The SMcrit and SMrate parameter values (0→1) depend on soil texture. That is, the fraction of the plant-available water capacity of the soil and the degree to which it can be used to meet the evapotranspiration demand are less in coarse textured soils than in finer textured soils.
The actual evapotranspiration term in the water balance equation, ET, is therefore calculated as:
2.2.2 Runoff
Rainfall in arid and semi-arid environments tends to occur in high-intensity events and can produce Hortonian overland runoff, even on coarse textured soils (Bryan and Yair Citation1982). Although this runoff may infiltrate the soil further down slope, or in more vegetated areas within a grid cell (Lesschen et al. Citation2009), we wished to include runoff (R) generation in the water balance calculations. To do this we used a simple rainfall–runoff threshold approach (Kirkby et al. Citation2005), in which runoff, R, is calculated as the amount of rainfall in excess of a threshold amount of rainfall (Pcrit):
2.2.3 Drainage
Drainage, D, is the amount of water percolating from the soil layer of interest by gravity; that is, water held in the soil at tensions less than field capacity forms drainage and can contribute to groundwater recharge. Thus drainage only occurs when the soil moisture content is at or above field capacity (SMfc):
where Peff is the effective amount of rainfall (Peff = P if P ≤ Pcrit; Peff = P – Pcrit if P > Pcrit). If the soil is not at field capacity, then water entering the soil recharges the soil moisture store.
2.2.4 Changes in soil moisture
Changes in soil moisture are simply calculated as the difference in the soil store of water between consecutive months (or days). Obviously, during a month, water may enter the soil and recharge the store only to be reused later on, resulting in no net change in soil moisture content at the end of the month.
2.3 Climate input data
The long-term water balance of each grid cell was calculated using long-term (1961–1990) monthly mean temperature (°C), precipitation (mm month-1) and sunshine fraction (%) data generated for the centre of each grid cell. The climate estimator software tool, New_LocClim (FAO Citation2005, Grieser et al. Citation2006) was used to generate the data, including the long-term maximum and minimum air temperatures for the warmest month of the year. New_LocClim estimator was used in single point mode (grid cell centre) and Shepard’s inverse distance weighting interpolation method selected, which allows for up to 11 weather stations to be chosen for interpolation. Cloud cover in tenths was calculated from New_LocClim sunshine fraction values ((100 − sunshine fraction, %)/10).
For an assessment of the effects of inter-annual variation in climate on the water balance, the monthly water balance for one of the grid cells, Rashad, was determined for the 30-year period, 1961–1990. The Rashad grid cell was chosen because the long-term water balance had resulted in runoff, allowing us to assess the inter-annual variation in evapotranspiration, runoff and possibly also drainage components. In addition, it was one of eight grids selected for an assessment of climate change impacts on biomass and soil carbon (C) densities and evapotranspiration (Alam and Starr Citation2013). The climate data (monthly temperature, precipitation and cloud cover % for 1961–1990) were downloaded from the Climate Research Unit (CRU), University of East Anglia (CRU TS 2.1; Mitchell and Jones Citation2005). As the CRU TS 2.1 data are available in 0.5° × 0.5° grid cells, the data for the six CRU TS 2.1 grid cells corresponding to our 1° × 1.5° grid cell were averaged.
2.4 Model parameter values
The threshold value of rainfall at which surface runoff is generated (Pcrit) was set at 140 mm per month in the case of AR soils and 130 mm per month in the case of VR soils. These values were established through adjustment and repeated runs of WATBAL and comparing the resulting annual runoff values with Budyko model values provided as additional information by New_LocClim and with values on a map of annual runoff for Africa produced using 1° × 1° gridded data (Nicholson et al. Citation1997). The different Pcrit values used for AR and VR soil types were used to reflect the difference in infiltration and permeability between the textures of these two soil types.
Grid cell crop coefficient, Kc, values were scaled to range between values of 0.6 and 1.0 for VR soils and between 0.4 and 0.8 for AR soils using grid cell tree biomass density values (Mg ha-1) to reflect the density of vegetation cover and related variation in evapotranspiration. The grid cell tree biomass density values were derived from NFI stem volume (m3 ha-1) data and wood density values (Alam et al. Citation2013). The NFI dataset is based on an inventory of 6160 plots (20 × 100 m) forming a 10 × 10 km grid south of latitude 16°N, but is only available as mean values for the national 1:250 000 maps corresponding to the 1.0° latitude × 1.5° longitude grid cells used in this study (Glen Citation1996, FNC/MAF/FAO Citation1998). While Kc values are available for food crops, they are rarely available for trees. Because of their interception capacity, trees tend to exhibit higher evapotranspiration rates than low crops, and Kc values for trees can therefore be expected to be >1, at least for forest/woodland with high stocking density and canopy cover. However, because of the open nature of savannah woodlands, Kc values can be expected to be relatively low, particularly on sandy soils where tree densities are less than on clay soils (Gaafar et al. Citation2006; Raddad et al. Citation2006). Various minimum and maximum values for setting the range of Kc were tested by comparing annual ET values with a map of ET for Africa presented in Nicholson et al. (Citation1997) before deciding on the values given above. The Kc values used for each grid cell are presented in the Appendix ().
Grid cell mean values for the plant-available water storage capacity parameters SMfc and SMpwp for AR and VR soils were calculated from field capacity (θfc) and permanent wilting point (θpwp) volumetric moisture contents, soil bulk density and soil layer thickness values. Values for θfc and θpwp for each soil type were derived using soil texture data (% sand, % silt and % clay) and the pedotransfer function developed by Saxton et al. (Citation1986). The soil texture and bulk density (g cm-3) values for the 0–30 cm and 30–100 cm soil layers for the two soil types in each grid cell were extracted from the Harmonized World Soil Database, HWSD (FAO/IIASA/ISRIC/ISS-CAS/JRC Citation2009). The HWSD soil map and associated soil mapping unit (SMU) attribute database covering the study region were imported into ArcGIS (version 9.2) and cut into polygons corresponding to the 39 grid cells. Using ArcGIS, we were then able to determine the area and access the soil data for all the SMUs of the two soil types in each grid cell, and calculate area-weighted mean soil texture and bulk density values for the two soil layers and soil types for each grid cell. Using these area-weighted values, SMfc and SMpwp values for the two layers were calculated and then summed to give soil type values for the upper 1 m of soil for each grid cell (Appendix, ). As some grid cells did not have mapped soil units for AR and VR (areas of these soil types too small to be mapped), these grid cells were given the mean soil type values calculated from those grid cells that did have values. This was done so as to give a uniform spatial distribution of grid cell values for subsequent interpolation and mapping of the water balance components (see Section 2.6). Calculating the grid cell water balance using a constant soil depth, and for both soil types, facilitates the harmonized comparison of the water balance across the region in relation to the two major soil types and climate. Values for soil water parameters, SMcrit and SMrate, were taken from those presented in Zahner (Citation1967). Accordingly, SMcrit and SMrate values of 0.25 and 0.50, respectively, were used for AR, and a value of 0.67 for both SMcrit and SMrate for VR.
In the study of the inter-annual variation in the water balance for the Rashad grid cell, the same values were used for the parameters Pcrit, Kc, SMfc, SMpwp, SMcrit and SMrate as for modelling the long-term mean water balance of the Rashad grid cell for each year of the 30-year period. While it can be assumed that the soil hydraulic parameters will not have changed over this period, forest cover (and therefore Kc) may have done. However, there are no relevant data available to enable changes in forest cover to be taken into account and, in any case, the intention was to assess the effects of variation in climate on the water balance and not changes in vegetation.
2.5 Model validation
As grid cell scale empirical data for parameterizing WATBAL are not available, we sought to demonstrate the conceptual and operational validity (Rykiel Citation1996) of the model by comparing daily WATBAL soil moisture simulations with empirical measurements of soil moisture data from Demokeya in northern Kordofan (13.3°N, 30.5°E). Validating the model by examining soil moisture is considered particularly suitable because soil moisture integrates the effects of the other components of the water balance.
The Demokeya site, which falls within the Al Obeid grid cell (), is characterized as a sparse Acacia savannah with a tree canopy cover of 5–10%. The soil type is an arenosol, with 60–70% coarse sand, 20–30% fine sand and a small amount of clay, and has a reported field capacity of 15% and a permanent wilting point of 5% (Ardö Citation2013). Soil moisture and meteorological data were collected at the site during the period 2002–2012 as part of a long-term savannah woodland ecosystem study (Ardö Citation2013). The available dataset includes daily rainfall (mm), air temperature (°C), incoming global radiation (W m-2), and volumetric soil moisture content measured at depths of 5, 15, 30, 60 and 100 cm using time-domain reflectrometry (Ardö Citation2013). The volumetric soil moisture values for each of the five depths were multiplied by the thickness of the layer that they were taken to represent (0–10, 10–22.5, 22.5–45, 45–80 and 80–100 cm, respectively), summed and multiplied by 10 to give a depth of water in mm for the upper 1-m soil layer (SM in WATBAL). The global radiation data (converted into MJ m-2 d-1) were used directly in the Jensen-Haise ET equation. Because of gaps and errors in the original datasets, daily data for the two periods 1 February 2005–20 April 2007 and 6 July 2007–19 January 2010 were used for validating WATBAL. A daily Pcrit value of 40 mm (the two days with rainfall >40 mm were assumed to have generated surface runoff), SMfc and SMpwp values of 150 and 50 mm, respectively (as reported by Ardö Citation2013), SMcrit and SMrate values of 0.25 and 0.5, respectively (for sand textured soils), and a Kc value of 0.41 (for Al Obeid grid cell) were used.
2.6 Mapping of grid cell water balance components
Maps showing the long-term mean annual temperature (MAT), mean annual precipitation (MAP) and the annual water balance components, ET, surface runoff and drainage across the study region were made using the data attributed to the grid cell centre and ArcMAP software (version 9.3) with the kriging interpolation method.
3 RESULTS
3.1 Model validation
The modelled and measured values of daily soil moisture content of the 1-m soil layer at the Demokeya site for the two time periods are displayed as time series plots in . The results show that WATBAL captured well the dynamics and level of soil moisture during the two study periods. The measured and modelled values are plotted against each other in . The fitted linear regression line has a coefficient of determination (R2) value of 0.84 and index of agreement (D) value of 0.87 (Legates and McCabe Citation1999).
Fig. 2 Daily rainfall and measured (Ardö Citation2013) and modelled (WATBAL) soil moisture contents during two periods, 1/2/05–20/4/07 and 6/7/07–19/1/10, for the Demokeya site, in northern Kordofan (Al Obeid grid cell).
Fig. 3 Scatter plot of the measured (Ardö Citation2013) and modelled (WATBAL) soil moisture contents for 1/2/05–20/4/07 and 6/7/07–19/1/10 for the Demokeya site, in northern Kordofan (Al Obeid grid cell). Dotted line is the 1:1 line.
3.2 Long-term mean annual water balances
Grid cell specific MAT, MAP and annual values of the water balance components for AR and VR soil types are given in and the water balance components as percentages of MAP in . Grid-cell MAP values varied from 147 mm (Khartoum) to 732 mm (Al Roseires) and MAT from 24.2°C (Zalingei) to 29.2°C (Khartoum). MAT values were highest in the northeast and central-southern area of the study region, and MAP increased southwards across the study region ().
Table 1 Long-term mean annual temperature (MAT), mean annual precipitation (MAP) and modelled (WATBAL) water balance components for AR and VR soil types for each grid cell (see ).
Fig. 4 Grid cell modelled long-term annual water balance components as a percentage of mean annual precipitation (MAP) for AR and VR soil types. Grid cells are ranked according to MAP (increasing to the right).
Fig. 5 Map showing distribution of mean annual precipitation (MAP) and mean annual temperature (MAT) across the study region (see for location of study region in Sudan).
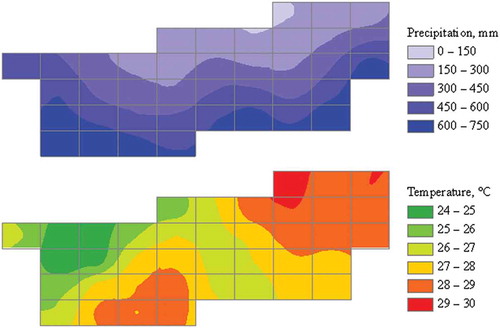
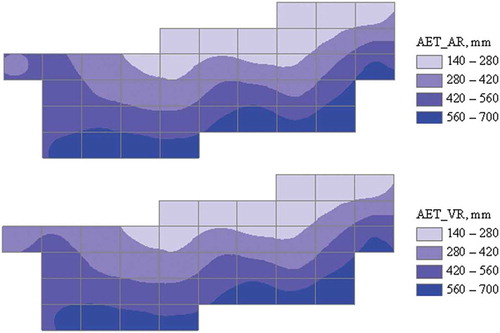
Grid cell mean annual ET for AR soils averaged 408 mm (95% of MAP) and varied from 147 mm (Khartoum) to 652 mm (Al Roseires) (). For VR soils, grid cell annual ET averaged 403 mm (94% of MAP) and ranged from 147 mm (Khartoum) to 669 mm (Al Roseires). Since ET is strongly limited by MAP in arid and semi-arid environments, the maps of ET for AR and VR soil types strongly resembled each other, and values increased southwards across the study region ().
Fig. 6 Map showing distribution of annual ET for AR and VR soil types across the study region (see for location of study region in Sudan).
Grid cell mean annual runoff (R) varied from 0 to 89 mm (Kubbum) for AR soils and from 0 to 109 mm (Kubbum) for VR (). Annual runoff averaged across the region was 17 mm for AR and 26 mm for VR, corresponding to 4% and 6% of MAP respectively. For VR soils, runoff was produced on 23 of the grid cells, but only 17 of the grid cells in the case of AR. Runoff generally increased southwards across the study region, but was clearly greater in the southwestern and eastern areas than in the south-central area ().
Fig. 7 Map showing distribution of annual runoff for AR and VR soil types across the study region (see for location of study region in Sudan).
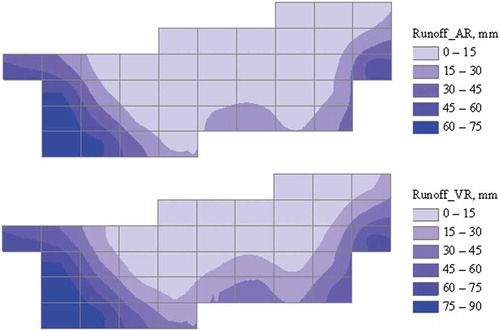
Fig. 8 Map showing distribution of annual drainage for AR soil type across the study region (see for location of study region in Sudan).
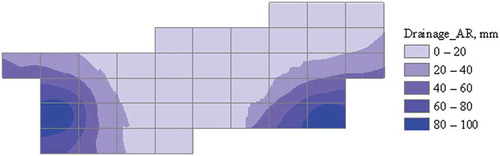
No drainage (D) was produced from VR soils for any of the grid cells and drainage from AR soils only occurred for four of the grid cells (). The highest annual drainage value was 68 mm (Kubbum), corresponding to 1% of MAP. The grid cells that produced drainage values for AR soils were located in the southeastern and western areas of the study region (Fig. 8).
3.3 Water balance inter-annual variation
The annual water balance components over the 30-year period 1961–1990 for the Rashad grid cell are presented in and . Annual rainfall ranged from 339 (1984) to 970 mm (1963), with a coefficient of variation (CV) of 20% (), and generally declined over the 30-year period (). The annual mean temperature ranged from 26.2 (1961) to 28.8°C (1987), with a CV of 2.8%, and increased over the period. Of the water balance components, ET showed the least inter-annual variation (CV: 13%) and no trend. Surface runoff showed the most inter-annual variation (CV: 92% for arenosols, 81% for vertisols), being zero in very dry years for both soil types. The inter-annual variation in drainage (percolation below 1 m) was relatively small for AR and large for VR (), but was zero in the driest years for both soil types. The mean end-of-month plant-available moisture content of the soil (SM – SMpwp) was generally higher for vertisols than for arenosols, but the inter-annual variation was similar for both soil types.
Table 2 Descriptive statistics of annual rainfall, temperature and WATBAL modelled water balance components for AR and VR soil types for the Rashad grid cell (11.5°N, 30.75°E) during 1961–1990.
Fig. 9 Annual rainfall and WATBAL modelled water balance components for AR and VR soil types for the Rashad grid cell (11.5°N, 30.75°E) during 1961–1990. Mean annual temperatures (MAT, °C) during the same period are given on the secondary y-axis.
3.4 Grid cell long-term mean monthly water balances
The monthly water balance averaged over the 39 grid cells is presented separately for AR and VR soil types in . The rainy season occurred between May and October; outside this period, rainfall was negligible. Rainfall was high enough for the soil to be recharged during the period July–January for AR soils (totalling 63 mm) but for a shorter period (July–October) for VR soils (totalling 6 mm); otherwise soil water contents at the end of the month were reduced to permanent wilting point values. However, there was a soil water deficit (SMfc – SM) for each month, averaging 69 mm for AR soils and 133 mm for VR soils, which reflected a monthly evapotranspiration deficit (ETc – ET) averaging 217 mm for both soil types. Surface runoff was generated during July and August for both soil types when rainfall was the highest and above Pcrit values, and drainage (percolation below 1 m) occurred during August and September, but only for AR soils. There was still soil moisture available to plants at the end of the month from July–October in the case of vertisols; for arenosols there were greater amounts that were available for longer. The greater soil moisture levels in the AR soils enabled greater ET during September and October compared to VR.
Fig. 10 Grid cell mean (n = 39) monthly water balances for AR and VR soil types.
4 DISCUSSION
Water scarcity in African drylands is projected to increase over time due to increasing population and changes in climate, land use and land cover (Hassan et al. Citation2005). A simple water balance model, such as described in this study, can be used for assessing how these factors are related and interact, and for planning mitigation against water scarcity. Unfortunately, appropriate climate data, particularly global radiation and evapotranspiration, and hydrological data (runoff, soil moisture) for running, validating and calibrating such models are rarely available for Africa. However, the soil hydraulic property and crop coefficient values used for the water balance modelling of each grid cell were derived using an objective methodology and based on HWSD soil data (FAO/IIASA/ISRIC/ISS-CAS/JRC Citation2009) and woodland inventory (FNC/MAF/FAO Citation1998) data. The input climate data generated from New_LocClim are also based on an extensive database of meteorological observations (FAO Citation2005). While perhaps not the best-performing method, the Jensen-Haise crop reference evapotranspiration equation has been shown to give reasonably accurate results compared to the FAO Penman-Monteith standard method and to have the advantage of requiring limited input data (Jensen et al. Citation1990). Nowadays, models using remote sensing techniques and data, such as the Surface Energy Balance Algorithm for Land (SEBAL) (Bastiaanssen et al. Citation2005), can be used to estimate the spatial and temporal variation in ET for use in water balance calculations. However, using such methods was beyond the scope of this study. Furthermore, the results of the model verification using the detailed and daily data from the Demokeya site demonstrated both the conceptual and operational validity of the model (Rykiel Citation1996) and its suitability for calculating the water balance of the grid cells. Undoubtedly, a better fit to the Demokeya measured soil moisture data could have been achieved through calibration of the soil water holding parameters. At least the SMpwp (parameter value, based on the permanent wilting-point moisture content reported by Ardö (Citation2013), appears to be too low (~10 mm) according to modelled soil moisture values. Nevertheless, given the availability of data for the region, we consider that the results from WATBAL are both reasonable, useful and fit for purpose.
The grid cell water balance results were characterized by evapotranspiration that was equal or almost equal to rainfall. As a result, soil moisture contents were brought close to permanent wilting point most of the time, with runoff and drainage only occurring for grid cells receiving the highest rainfall. Our regional map of annual ET values showed good agreement with that presented by Nicholson et al. (Citation1997) for the same region and grid cell, and the values were strongly correlated with Bodyko ET values produced by New_LocClim (r = 0.91 for both soil types). Evapotranspiration accounted for 75–100% of grid-cell MAP for AR soils and for 83–100% of grid cell MAP for VR soils. While vertisols clearly had larger available soil moisture storage capacities (SMfc – SMpwp) than arenosols ( = 134 mm for VR and 74 mm for AR), the generally equal or slightly lower annual ET values for vertisols can be attributed to the fact that proportionally more of the available soil water is held at greater tensions in clay (fine texture) than in sandy (coarse texture) soils. Also, infiltration during wet periods can be expected to be less for vertisols than for arenosols, because of low conductivity rates of clay and closure of cracks formed during dry periods. These differences in soil properties also explain why grid cell runoff is greater and drainage lower for vertisols than for arenosols. The parallel relationship between monthly ET and rainfall for both soil types clearly shows that ET in dryland environments is mainly determined by the amount of rainfall, and vegetation cover and soil type have little influence.
Evapotranspiration consists of interception, transpiration and evaporation from the soil. These separate components of ET are difficult to model without detailed data and complex modelling, and are not separated in WATBAL. Interception losses in dryland environments may be relatively more important than in humid environments, but it is highly variable and depends on rainfall intensity and duration, and canopy cover characteristics (Dunkerley Citation2000). Wilcox et al. (Citation2003) reported interception losses from rangeland (dryland) ecosystems in North America of between 1% and 80% of the annual water budget, but they were generally between 20% and 40%. Depending on the extent of bare soil, evaporation from bare soil can account for a significant proportion of ET in arid and semi-arid regions (Wilcox et al. Citation2003). Other studies, however, suggest that bare soil evaporation in dryland environments soon becomes negligible after rainfall (Williams and Albertson Citation2005).
We used a single Kc value based on grid cell mean tree biomass densities derived from forest inventory data to convert reference crop evapotranspiration (ETo) values into potential ET values appropriate for the tree cover present. While some savannah woodland species are evergreen, others shed their leaves during the dry season so that canopy cover varies during the year (Murphy and Lugo Citation1986, Sarmiento and Monasterio Citation1992, Timberlake et al. Citation2010). Changes in canopy cover may therefore be expected to affect ET, and using Kc values that change during the season in response to changes in canopy cover may be expected to produce more reliable ET estimates (Allen et al. Citation1998). We tested the effect of using seasonal Kc values by varying monthly Kc from 25% (during dry periods when deciduous species would have shed their leaves) to 100% (during wet periods when canopy would be at maximum cover) of the fixed Kc value for the Khartoum grid cell (low MAP) and the Rashad grid cell (relatively high MAP). The results showed that there was no difference in the annual ET (also runoff and drainage) values for the two grid cells using seasonal and fixed Kc values.
The plant-available soil moisture was calculated for the 1-m layer, this being the depth to which soil data were available. While the maximum depth of the tree roots in drylands may exceed 1 m (Canadell et al. Citation1996), and so increase the amount of available water for evapotranspiration (Zhang et al. Citation2001), studies have found that different types of dryland vegetation cover (varying combinations of grass and wood) have little or no significant effect on water use (Kabat et al. Citation1997, Williams and Albertson Citation2005). This is further confirmation that ET in dryland regions is limited by rainfall rather than by the characteristics of the vegetation and availability of soil water. That there is plant-available water at the end of some months, particularly in the case of AR soils, suggests that biomass production could potentially be increased during these months.
Savannah woodlands have canopies that are sparse and of mixed species, and a ground cover that is heterogeneous (grass and bare soil). This makes modelling infiltration, surface runoff and evapotranspiration in drylands difficult (Wallace et al. Citation1991). This difficulty is further increased by the stripped pattern of vegetation cover typical of drylands and its effects on runoff and run-on (Cornet et al. Citation1992, Dunkerley Citation2002), and by the soil crusting and sealing formed by the impact of rain drops during heavy rainfall events (Abu-Awwad Citation1997, Francis et al. Citation2007). Grid cell annual runoff accounted for up to 17% of MAP on VR soils and for up to 14% on AR soils, and was strongly correlated with the Bodyko runoff values produced by New_LocClim (r = 0.77 for AR and 0.83 for VR soils). Our regional map of annual runoff was also in good agreement with the high-resolution map of annual runoff for the region presented in Nicholson et al. (Citation1997). The WATBAL model uses a simple rainfall threshold approach to allocate an amount of rainfall to surface runoff. A more sophisticated approach to model surface runoff production based on rainfall amount, and distribution and surface morphology, such as described by Kirkby et al. (Citation2005), could be expected to improve the estimation of runoff.
Groundwater recharge is generally very small in drylands, commonly only a few millimetres or less per year (Wilcox et al. Citation2003). Across our study region, drainage from below 1 m depth only occurred for AR soils and then only from four of the grid cells. Drainage from VR soils was zero across the entire region. Although vertisols develop cracks, which would allow for greater infiltration than their soil texture suggests, these cracks only develop during prolonged dry periods and close during wet periods. Thus, contrary to what is reported by many researchers, there is no deep drainage from these soils as a result of cracking (Abdelhadi et al. Citation2000). Thus, the cracks are assumed to be closed when the monthly rainfall is at Pcrit values, the rainfall amount at which surface runoff is generated in WATBAL.
The variation in water balance components, exemplified by the Rashad grid cell, showed that ET had the lowest inter-annual variation and runoff the greatest. Evapotranspiration is known to be conservative and to show relatively little inter-annual variation because it is primarily driven by radiation, which does not vary greatly from year to year. The inter-annual variation in plant-available soil moisture content was also relatively low and similar for both soil types. However, the inter-annual variation in drainage did differ considerably between the two soil types, with the VR soils showing greater inter-annual variation than the AR soils. The greatest inter-annual variation was in runoff. Relatively small differences in rainfall therefore have a significant impact on runoff and formation of wadis across the region. Climate change is generally expected to increase the inter-annual variation in the water balance (Huntington Citation2006), posing a considerable challenge to water security in drylands.
5 CONCLUSIONS
Using a simple monthly water balance model, a programme for generating long-term climate data for any location, National Forest Inventory data, and soils data from a global database we were able to produce reliable and harmonized annual and monthly water balances for 39 1° × 1.5° grid cells covering the savannah woodland region of Sudan and for the two dominating soil types, arenosols and vertisols. The water balances provide useful insights into the spatial variability in evapotranspiration, runoff, drainage and changes in soil moisture across the region. The need for more empirical meteorological, hydrological and soil studies and data in the region is emphasized.
Disclosure statement
No potential conflict of interest was reported by the authors.
REFERENCES
- Abdelhadi, A.W., et al., 2000. Estimation of crop water requirements in arid region using Penman-Monteith equation with derived crop coefficients: a case study on Acala cotton in Sudan Gezira irrigated scheme. Agricultural Water Management, 45, 203–214. doi:10.1016/S0378-3774(99)00077-3
- Abu-Awwad, A.M., 1997. Water infiltration and redistribution within soils affected by a surface crust. Journal of Arid Environments, 37, 231–242. doi:10.1006/jare.1997.0280
- Alam, S.A., 2013. Carbon stocks, greenhouse gas emissions and water balance of Sudanese savannah woodlands in relation to climate change. Doctoral Dissertation. Univ. Helsinki Tropic. Forest. Report no. 42. Helsinki: Viikki Tropical Resources Institute (VITRI). Available from: http://urn.fi/URN:ISBN:978-952-10-8627-4 [Accessed 01 Nov 2013].
- Alam, S.A., et al., 2013. Tree biomass and soil organic carbon densities across the Sudanese woodland savannah: a regional carbon sequestration study. Journal of Arid Environments, 89, 67–76. doi:10.1016/j.jaridenv.2012.10.002
- Alam, S.A. and Starr, M., 2013. Impacts of climate change on savannah woodland biomass carbon density and water-use: a modelling study of the Sudanese gum belt region. Mitigation and Adaptation Strategies for Global Change, 18, 979–999. doi:10.1007/s11027-012-9403-5
- Allen, R.G., et al., 1998. Crop evapotranspiration: guidelines for computing crop water requirements. FAO irrigation and drainage paper number 56. Rome: FAO.
- Ardö, J., 2013. A 10-year dataset of basic meteorology and soil properties in Central Sudan. Dataset Papers in Geosciences. Article ID 297973. doi:10.7167/2013/297973.
- Ayoub, A.T., 1998. Extent, severity and causative factors of land degradation in the Sudan. Journal of Arid Environments, 38, 397–409. doi:10.1006/jare.1997.0346
- Bastiaanssen, W.G.M., et al., 2005. SEBAL model with remotely sensed data to improve water-resources management under actual field conditions. Journal of Irrigation and Drainage Engineering, 131 (1), 85–93. doi:10.1061/(ASCE)0733-9437(2005)131:1(85)
- Black, J.N., 1956. The distribution of solar radiation over the Earth’s surface. Theoretical and Applied Climatology, 7 (2), 165–189.
- Bonan, G.B., 1989. A computer model of the solar radiation, soil moisture, and soil thermal regimes in boreal forests. Ecological Modelling, 45, 275–306. doi:10.1016/0304-3800(89)90076-8
- Bourlière, F. and Hadley, M., 1992. Present-day savannas: an overview. In: F. Bourlière, ed. Ecosystems of the world 13: Tropical savannas. Amsterdam-Oxford-New York-Tokyo: Elsevier, 1–17.
- Bryan, R.B. and Yair, A., 1982. Badland geomorphology and piping. Norwich, UK: Geobooks.
- Canadell, J., et al., 1996. Maximum rooting depth of vegetation types at the global scale. Oecologia, 108, 583–595. doi:10.1007/BF00329030
- Cornet, A.F., et al., 1992. Water flows and the dynamics of desert vegetation stripes. In: A.J. Hansen and F. Di Castri, eds. Landscape boundaries: consequences of biotic diversity and ecological flows. New York: Springer-Verlag, 327–345.
- Dunkerley, D., 2000. Measuring interception loss and canopy storage in dryland vegetation: a brief review and evaluation of available research strategies. Hydrological Processes, 14, 669–678. doi:10.1002/(SICI)1099-1085(200003)14:4<669::AID-HYP965>3.0.CO;2-I
- Dunkerley, D., 2002. Systematic variation of soil infiltration rates within and between the components of the vegetation mosaic in an Australian desert landscape. Hydrological Processes, 16, 119–131. doi:10.1002/hyp.357
- FAO, 2004. Carbon sequestration in dryland soils. World soil resources reports, vol. 102. Rome: FAO.
- FAO, 2005. New_LocClim: Local Climate Estimator (Version 1.10). Environment and natural resources. Working paper no. 20 (CD-ROM). Rome: FAO.
- FAO/IIASA/ISRIC/ISS-CAS/JRC, 2009. Harmonized world soil database (version 1.1). Rome and Laxenburg: FAO and IIASA.
- Fischer, R.A. and Turner, N.C., 1978. Plant productivity in the arid and semiarid zones. Annual Review of Plant Physiology, 29, 277–317. doi:10.1146/annurev.pp.29.060178.001425
- FNC (Forests National Corporation)/MAF (Ministry of Agriculture and Forestry)/FAO, 1998. National Forest Inventory (NFI) for the Sudan. GCP/SUD/047/NET. Khartoum: FNC.
- Francis, M.L., et al., 2007. Soils of Namaqualand: compensations for aridity. Journal of Arid Environments, 70, 588–603. doi:10.1016/j.jaridenv.2006.12.028
- Gaafar, A.M., et al., 2006. Improving the traditional Acacia senegal-crop system in Sudan: the effect of tree density on water use, gum production and crop yields. Agroforestry Systems, 66, 1–11. doi:10.1007/s10457-005-2918-y
- Githae, E.W., et al., 2011. Soil physicochemical properties under Acacia senegal varieties in the dryland areas of Kenya. African Journal of Plant Science, 5 (8), 475–482.
- Glen, W.M., 1996. National forest inventory for the Sudan. FAO/GCP/SUD/047/NET. Khartoum: FNC.
- Gonzalez, P., 2001. Desertification and a shift of forest species in the West African Sahel. Climate Research, 17, 217–228. doi:10.3354/cr017217
- Grieser, J., et al., 2006. New LocClim—the local climate estimator of FAO. Geophysical Research Abstracts, 8 (08305), 1–2.
- Griffith, A.L., 1961. Dry woodlands of Africa South of the Sahara. Unasylva, 15 (1), 10–21.
- Haberlah, D., 2005. Satellite Worksheet Series 1:250 000 of Sudan. In: GRAS Annual Report 2004. Khartoum: Geological Research Authority of the Sudan, Ministry of Energy and Mining.
- Hassan, R., et al., 2005 Ecosystems and human well-being: current state and trends, volume 1. The Millennium Ecosystem Assessment Series. Washington, Covelo and London: Island Press.
- Hiernaux, P., et al., 2009. Woody plant population dynamics in response to climate changes from 1984 to 2006 in Sahel (Gourma, Mali). Journal of Hydrology, 375, 103–113. doi:10.1016/j.jhydrol.2009.01.043
- Huntington, T.G., 2006. Evidence for intensification of the global water cycle: review and synthesis. Journal of Hydrology, 319, 83–95. doi:10.1016/j.jhydrol.2005.07.003
- Jensen, M.E., et al., 1990. Evapotranspiration and irrigation water requirements. Manuals and Reports on Engineering Practice no. 70. New York: American Society of Civil Engineering (ASCE).
- Kabat, P., et al., 1997. Evaporation, sensible heat and canopy conductance of fallow savannah and patterned woodland in the Sahel. Journal of Hydrology, 188-189, 494–515. doi:10.1016/S0022-1694(96)03190-3
- Kirkby, M.J., et al., 2005. The influence of rainfall distribution and morphological factors on runoff delivery from dryland catchments in SE Spain. Catena, 62 (2–3), 136–156. doi:10.1016/j.catena.2005.05.002
- Klein, S.A., 1977. Calculation of monthly average insolation on tilted surface. Solar Energy, 19, 325–329. doi:10.1016/0038-092X(77)90001-9
- Le Houérou, H.N., 1996. Climate change, drought and desertification. Journal of Arid Environments, 34, 133–185. doi:10.1006/jare.1996.0099
- Legates, D.R. and McCabe, G.J., 1999. Evaluating the use of “goodness-of-fit” measures in hydrologic and hydroclimatic model validation. Water Resources Research, 35 (1), 233–241. doi:10.1029/1998WR900018
- Lesschen, J.P., et al., 2009. Modelling runoff and erosion for a semi-arid catchment using a multi-scale approach based on hydrological connectivity. Geomorphology, 109, 174–183. doi:10.1016/j.geomorph.2009.02.030
- Malagnoux, M., et al., 2007. Forests, trees and water in arid lands: a delicate balance. Unasylva, 229 (58), 24–29.
- MEPD (Ministry of Environment and Physical Development)/HCENR (Higher Council for Environment and Natural Resources), 2003. Sudan’s First National Communications under the United Nations Framework Convention on Climate Change, Volume I: Main Communications. Khartoum: MEPD and HCENR. Available from: http://unfccc.int/resource/docs/natc/sudnc1.pdf [Accessed 13 November 2011].
- Mitchell, T.D. and Jones, P.D., 2005. An improved method of constructing a database of monthly climate observations and associated high-resolution grids. International Journal of Climatology, 25, 693–712. doi:10.1002/joc.1181
- Murphy, P.G. and Lugo, A.E., 1986. Ecology of tropical dry forest. Annual Review of Ecology and Systematics, 17, 67–88. doi:10.1146/annurev.es.17.110186.000435
- Nicholson, S.E., et al., 1997. The mean surface water balance over Africa and its interannual variability. Journal of Climate, 10, 2981–3002. doi:10.1175/1520-0442(1997)010<2981:TMSWBO>2.0.CO;2
- Obeid, M. and Eldin, A.S., 1970. Ecological studies of the vegetation of the Sudan. Journal of Applied Ecology, 7 (3), 507–518. doi:10.2307/2401975
- Ohte, N., et al., 2003. Water utilization of natural and planted trees in the semiarid desert of Inner Mongolia, China. Ecological Applications, 13 (2), 337–351. doi:10.1890/1051-0761(2003)013[0337:WUONAP]2.0.CO;2
- Pilgrim, D.H., et al., 1988. Problems of rainfall-runoff modelling in arid and semiarid regions. Hydrological Sciences Journal, 33 (4), 379–400. doi:10.1080/02626668809491261
- Raddad, E.Y., et al., 2006. Productivity and nutrient cycling in young Acacia senegal farming systems on Vertisol in the Blue Nile region, Sudan. Agroforestry Systems, 68, 193–207. doi:10.1007/s10457-006-9009-6
- Rykiel, E.J., 1996. Testing ecological models: the meaning of validation. Ecological Modelling, 90, 229–244. doi:10.1016/0304-3800(95)00152-2
- Sarmiento, G. and Monasterio, M., 1992. Life forms and phenology. In: F. Bourlière, ed. Ecosystems of the world 13: tropical savannas. Amsterdam: Elsevier Science Publishers BV, 79–108.
- Saxton, K.E., et al., 1986. Estimating generalized soil-water characteristics from texture. Soil Science Society of America Journal, 50 (4), 1031–1036. doi:10.2136/sssaj1986.03615995005000040039x
- Starr, M., 1999. WATBAL: A model for estimating monthly water balance components, including soil water fluxes. In: S. Kleemola and M. Forsius, eds. 8th Annual report 1999, UN ECE Convention on long-range transboundary air pollution, International cooperative programme on integrated monitoring of air pollution effects on ecosystems. Helsinki: Finnish Environment Institute, 31–35.
- Stephenson, N.L., 1990. Climatic control of vegetation distribution: the role of the water balance. The American Naturalist, 135 (5), 649–670. doi:10.1086/285067
- Timberlake, J., et al., 2010. Distribution and characteristics of African dry forests and woodlands. In: E. Chidumayo and A.D. Gumbo, eds. The dry forests and woodlands of Africa: managing for products and services. London: Earthscan, 11–41.
- Wallace, J.S., 1991. The measurement and modelling of evaporation from semiarid land. In: M.V.K. Sivakumar, et al., eds. Soil water balance in the Sudano-Sahelian Zone (Proceedings of the Niamey Workshop, February 1991). The Hague: International Association of Hydrological Sciences, IAHS Publ. 199, 131–148. Available from: http://iahs.info/uploads/dms/iahs_199_0131.pdf [Accessed 12 February 2015].
- Webb, W., et al., 1978. Primary productivity and water use in native forest, grassland, and desert ecosystems. Ecology, 59 (6), 1239–1247. doi:10.2307/1938237
- Weltzin, J.F. and Coughenour, M.B., 1990. Savanna tree influence on understory vegetation and soil nutrients in northwestern Kenya. Journal of Vegetation Science, 1, 325–334. doi:10.2307/3235707
- Wilcox, B.P., et al., 2003. Rangelands, water balance on. In: T.A. Stewart and T. A. Howell, eds. Encyclopedia of water science. New York: Marcel Dekker, 791–794.
- Williams, C.A. and Albertson, J.D., 2005. Contrasting short- and long-timescale effects of vegetation dynamics on water and carbon fluxes in water-limited ecosystems. Water Resources Research, 41, W06005. doi:10.1029/2004WR003750
- Zahner, R., 1967. Refinement in empirical functions for realistic soil-moisture régimes under forest cover. In: W.E. Sopper and H.W. Lull, eds. Forest hydrology. Proceedings of a National Science Foundation Advanced Science Seminar, The Pennsylvania State University, Pennsylvania, USA, 29 Aug–10 Sept, 1965. Oxford: Pergamon Press, 261–273.
- Zhang, L., et al., 2001. Response of mean annual evapotranspiration to vegetation changes at catchment scale. Water Resources Research, 37, 701–708. doi:10.1029/2000WR900325
APPENDIX
Table A1 WATBAL parameter values for each grid cell (see for location of study region in Sudan).