
Abstract
The Nema is a river in western Senegal where only a minority of inhabitants has access to drinking water. Rainfall has been decreasing in this region since the 1960s. It is crucial to understand how this change affects groundwater recharge. The objective of this research is to determine the current proportions of groundwater recharge, runoff, subsurface runoff and evapotranspiration using a simulation approach. The Nash criterion and water balance error were used to evaluate the quality of the simulations. The following results were obtained: the Nash criterion was 0.73 for calibration (0.73 for validation), and the water balance error was −0.35% and 0.005%, respectively, for the hydrological years 1995/96 and 1997/98. Evapotranspiration and groundwater recharge are the main processes involved.
Editor Z.W. Kundzewicz; Associate editor D. Hughes
Résumé
La Néma est une rivière de l’Ouest du Sénégal où seule une minorité des habitants a accès à de l’eau potable. Les précipitations ont diminué dans cette région depuis les années soixante. L’objectif de cette recherche est de déterminer par simulation les proportions de la recharge en eau souterraine, des ruissellements de surface et hypodermiques, et de l’évapotranspiration. La qualité des résultats de simulation a été évaluée par le critère de Nash et une erreur du bilan hydrique. Les résultats obtenus sont les suivants: un critère de Nash de 0,73 lors des phases de calage et de validation, une erreur de bilan de –0,35% et 0,005% pour les années hydrologiques 1995/96 et 1997/98. Les termes principaux du bilan sont l’évapotranspiration et la recharge en eau souterraine.
1 INTRODUCTION
The Nema catchment is a rural and coastal area of approximately 43 km2, where more than half of the population does not have access to safe water (PEPAM-Sénégal Citation2010). Considerable seasonal fluctuations in the Continental Terminal groundwater-table level, which is the main water resource, have been shown in the Nema catchment (Lienou et al. Citation1999, Ngom et al. Citation2002). This unconfined aquifer constitutes an easily accessible resource and is the main source of drinking water for those living in the catchment, since the underlying Maastrichtian groundwater is not only difficult to reach using traditional methods, but could also have high salinity and excess fluoride (Pontié et al. Citation1996, Chippaux et al. Citation2007). Since the 1970s, rainfall has decreased by nearly 27% leading to serious droughts (Lienou et al. Citation1999). More recent trends have shown that dry conditions still prevail in the Western Sahel (Lebel and Ali Citation2009), including Senegal. In addition, there is a loss of agricultural land in this region: at the seashore, this loss is due to encroaching seawater (Camara et al. Citation2008), whereas inland it is due to decreasing rainfall (Malou Citation2004). As water is scarce and becoming scarcer, it is of the utmost importance to optimize its management. The efficient management of any resource requires good knowledge of its functioning, and water resource management requires an understanding of the hydrological processes that characterize the catchment. Likewise, an assessment of the inflows and outflows of a catchment (water balance) enables the water resource there to be better managed, which is extremely important because water is the basis of the population’s social and economic development. This research has a twofold aim: to evaluate the amount of water available in the Nema catchment during the dry and the wet seasons, and to better understand the hydrological processes involved. In order to deal with the complexity of hydrological processes at the catchment scale, numerical models are often used to formalize the processes and to quantify water flows. Many simulation tools of varying degrees of complexity exist, and the choice of tool to use in a particular study depends on the objectives of the study (Cosandey and Robinson Citation2007) and the resources available. In our case, there is not much data available. Ngom (Citation2000) used Flux-Net modelling (Malou Citation1992) to evaluate groundwater recharge, but this model is not designed to evaluate groundwater drainage by streamflow. However, Hydrosimul (Courbis et al. Citation2008) can be used to evaluate groundwater drainage by streamflow. This modelling tool considers the catchment as interacting modelling units, which are homogeneous from a hydrological point of view (same slope, same runoff coefficient and same land cover). Because Hydrosimul requires only a few parameters, we anticipated that it would be a good tool for simulating the Nema catchment.
This paper is structured in five sections. After the Introduction, Section 2 deals with the materials and methods and presents the field of study and Hydrosimul. Section 3 gives the simulation results, which are discussed in Section 4. The last section concludes this study and details future prospects.
2 MATERIALS AND METHODS
2.1 Nema catchment
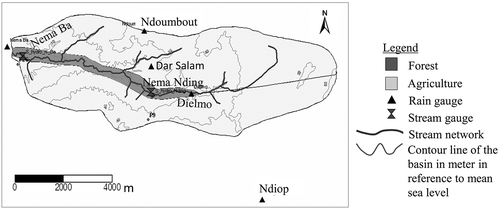
The Nema catchment is located in Central Western Senegal (latitude 13°42ʹ–13°45ʹN and longitude 16°22ʹ–16°29ʹW). It is drained by the Nema River, which flows from east to west and into the Atlantic Ocean ().
Fig. 1 Topography, hydrography and land use in the Nema catchment (Ngom Citation2000, modified).
The climate is Sudano-Sahelian, with a long dry season (November–June), and a short rainy season (June–October).
The Continental Terminal aquifer, which is the focus of this study, is formed of sandy clay on a limestone substratum (). The general groundwater flow converges at the Nema River except in the headslope area (). The surface runoff and subsurface runoff flow to the Nema River. However, in the headslope area, groundwater does not contribute to the Nema streamflow because it flows towards the Keur Layen Fatim well.
Fig. 2 Geological context of the Nema catchment (Ngom Citation2000).
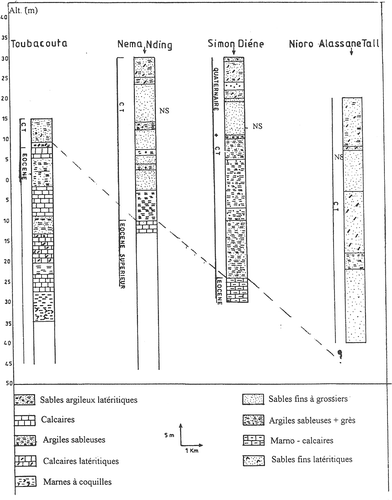
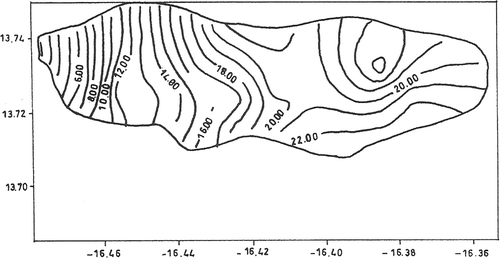
Fig. 3 The Continental Terminal groundwater flow in August 1996 at the Nema catchment.
The Nema catchment is home to nearly 5000 people, whose main activities are extensive farming, in which women play an important role, and cattle breeding. Market gardening, the main economic activity during the dry season, is sustained mainly by the groundwater of the Continental Terminal aquifer (Akpo et al. Citation2003).
2.2 Modelling and simulation of the Nema catchment with Hydrosimul
2.2.1 Overview of Hydrosimul
Hydrosimul is a tool for simulating streamflow and groundwater level, and used to evaluate water resources and make forecasts concerning the impact of land or weather changes on water over several years or several decades. It was developed during a European project devoted to groundwater resource protection in hard-rock mountain areas (Vayssade Citation2008). It has been applied to the study of several basins located in the south of France: Valescure (Courbis and Vayssade Citation2007) and La Sapine (Courbis et al. Citation2008). The main features of Hydrosimul are as follows: it is parsimonious in terms of data required, semi-distributed, the simulated time steps can be daily, weekly or monthly, and different evapotranspiration models are proposed, such as Penman (Citation1948), Turc (Citation1954) and Thornthwaite and Mather (Citation1957). For this study, a daily time step was chosen. The Thornthwaite and Mather (Citation1957) evapotranspiration model was used because it requires few parameters (Oudin et al. Citation2005).
The catchment to be simulated was broken down into three hillslopes: the left and right hillslopes, and the headslope, each of which contributes to the flow of the river by surface, subsurface and groundwater flows. For each hillslope, if land cover is different between two areas, there is a first partitioning according to the land cover. If the slope varies within these areas, another subdivision is made. After the partitioning step, each area is defined in terms of a single land cover and a uniform slope. This area is then referred to as a plot. Every plot is characterized by coefficients such as the runoff coefficient and subsurface runoff, which depend on the land cover and slope.
Water balance is calculated in three steps: plot, hillslope and catchment. At the plot scale, it is evaluated in terms of evapotranspiration, surface and subsurface runoff, and infiltration. The hillslope scale takes into account the interactions of the plots and evaluates the sum of surface and subsurface runoff, which feeds the river, and the sum of infiltration, which feeds the groundwater. If two plots are downstream, the amount of water from the upstream plot is shared between them in proportion to the length of their border with the upper plot. At the catchment scale, the outflow of the river is the sum of the contribution of the three slopes in terms of surface runoff, subsurface runoff and groundwater.
2.2.2 The Nema model
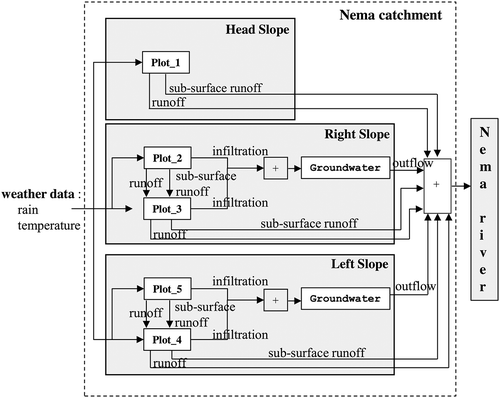
According to the Hydrosimul modelling principle, the Nema catchment was divided into three slopes (). The western boundary of the headslope (Plot 1) is the groundwater divide within the catchment (). Thus, only groundwater from the right slope (plots 2 and 3) and left slope (plots 4 and 5) contribute to Nema River flow. Plots 3 and 4 are defined taking into account the presence of the forest. Plots 1, 2, and 5 are used for farming. The Nema model is represented in , which highlights the interactions between the three slopes and the river, and gives details of the modelling of the slopes.
Fig. 4 The Nema catchment divided into hydrologically homogeneous plots.
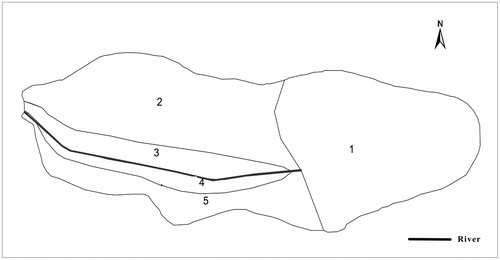
Fig. 5 Model of the Nema catchment using Hydrosimul methodology.
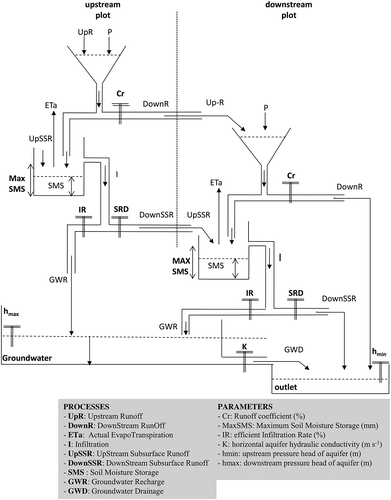
Plots are characterized by their dimensions (width and length), their slope, and their land cover. The interconnection of plots (for instance Plot 2 and Plot 3 in ) is automatically determined according to the gradient of the elevations in such a way that the higher plot is defined as upstream and the other(s) as downstream. Every plot is again broken down hierarchically into a network of interconnected models representing hydrological processes involved in the water balance. is a simplified representation of these processes at the plot scale. It highlights the interactions of hydrological processes between the plots and the interactions between surface and groundwater.
Fig. 6 Hydrological process modelling by Hydrosimul at the slope scale.
The derivation of potential evapotranspiration, ETp (mm), is based on the Thornthwaite method, because the data available for the catchment only allowed that kind of assessment:
where Ti is the mean temperature of month i (°C); IT is a seasonal heat index; α is an empirical exponent: α = (6.7 × 10⁻⁷ × IT3) – (7.72 × 10⁻⁵ × IT2) + (1.792 × 10⁻² × IT); and DL is a dimensionless coefficient depending on the latitude and the month.
Downstream runoff, DownR (mm; equation (2)), is computed from the precipitation (P) and the upstream runoff (UpR) with respect to a runoff coefficient, Cr (-), that defines overland flow and is determined according to the land cover and the nature of the soil. It varies from 0% (very pervious soil) to 100% (impervious soil):
The actual evapotranspiration, Eta (mm; equations (3) and (5)), is calculated according to the potential evapotranspiration (Etp) and the soil moisture storage (SMS). The recharge of SMS is calculated in mm (equations (4) and (6)) according to the upstream subsurface runoff, precipitation and the evapotranspiration. Its value cannot exceed MaxSMS which is the maximum amount of water, in mm, that the soil can store and release as evapotranspiration. If the SMS is below MaxSMS, the infiltration will be null.
else
Infiltration, I (mm), is computed according to the precipitation (P), runoff (DownR) and actual evapotranspiration (Eta):
Groundwater recharge, GWR (mm; equation (8)), depends on infiltration (I) and an infiltration rate (IR). The IR is dimensionless and determines the recharging infiltration to the groundwater. It ranges from 0 (impervious unsaturated zone) to 1 (very pervious unsaturated zone), and distributes the global infiltration between the subsurface runoff and aquifer recharging infiltration:
Subsurface runoff, DownSSR (mm), depends on infiltration (I), the infiltration rate (IR) and subsurface runoff delay (SRD):
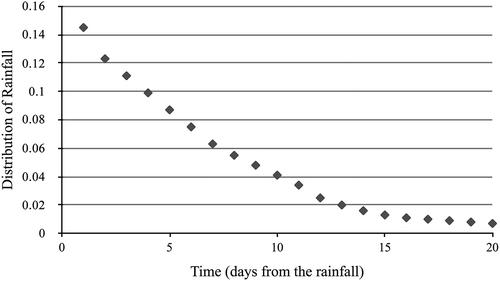
SRD, is dimensionless, and represents the ratio of the subsurface runoff which arrives at the outlet after each rainfall. The daily distribution is a continuously decreasing function over n days, the values of which are given in . The amount of rainfall on a precise day is partitioned into n daily subsurface flows running for n days after a rainy day:
Fig. 7 Distribution of rainfall over time.
The unconfined associated aquifer is characterized by its dimensions, piezometric head, and the hydraulic conductivity (K, m s-1). The initial piezometric surface mapping is based on the piezometer network consisting of 32 wells, the altitudes of which are obtained from a 1/50 000 scale IGN map (French National Geographic Institute). The groundwater drainage (GWD), which is based on Darcy’s Law, gives the contribution (in m3 d-1) of the groundwater to the river flow:
where l is the width (m) of the aquifer, and L its length (m), hmax (m) is the value of the piezometric head at the highest point of the hillslope, and hmin (m) the value of the piezometric head at the lowest point of the hillslope (at the river).
Parameters involved in the computation of the hydrological processes are set by field measurements and expertise. Parameters whose value is not known are adjusted during the calibration phase.
2.2.3 Weather data for running the Nema model
In this study, we used daily weather data. As we used Thornthwaite’s model, precipitation and temperature datasets were required. The rainfall data were measured by five raingauges in the catchment (). The local measurements of the raingauges were spatialized using Thiessen polygons. Temperature was measured by the National Department of Meteorology of Senegal at the Nioro Rip station, located about 60 km from the Nema catchment, at the same latitude and in the same climatic zone.
2.2.4 Criteria for analysing results
Two criteria were used for evaluating the accuracy of the results: the balance error and the Nash criterion (Nash and Sutcliffe Citation1970). The balance error (equation (11)) is evaluated as the difference between the volume of water inside the system before simulation (i.e. soil moisture storage, groundwater) including input (i.e. precipitation) and the volume of water inside the system after simulation (i.e. soil moisture storage, groundwater) including output (evapotranspiration, discharge). Relative error (equation (12)) is the percentage of error with respect to the precipitation over the simulated period, the volume of water inside the soil (SMS0) and the ground (GW0) at the beginning of simulation.
where dSMS/dt and dGWR/dt express the variation of soil moisture content and groundwater recharge, respectively, between the last and the first simulated days.
The accuracy of results concerning the discharge at the outlet is automatically computed, if measured data exist, according to the Nash criterion:
where QMi is the ith value of the daily measured flow at the outlet; GWDi the ith value of daily simulated flow at the outlet; and Q the average daily measured flow at the outlet.
3 SIMULATION AND RESULTS
3.1 Parameters
The parameters that had to be set for the simulation were as follows: the runoff coefficient found in equation (2), the maximum soil moisture storage (equation (4)), the infiltration rate (equations (8) and (9)), the hydraulic conductivity, and hmin and hmax, the value of the piezometric heads (equation (10)).
It was not possible to obtain measurements of these parameters in the Nema catchment. Therefore, an interval of the values was estimated by experts and a precise value set for each of them during the calibration phase. Note that the value set of each parameter was not modified after the calibration phase.
3.2 Calibration of the model
Calibration was performed for the 1995/96 hydrological year. Several simulations were conducted, based varying the parameters within the value intervals set by experts. For each simulation, the Nash criterion was calculated to estimate the accuracy of the simulated daily discharge of the river with respect to the measured discharge. The best Nash criterion value obtained was 0.73 for the parameters given in . The overall water balance error was −0.35%.
Table 1 Values of parameters chosen for modelling the Nema catchment.
We can make the following observations concerning these parameter values
The infiltration rate (IR) is 0.9 for the whole catchment, which means that 90% of the overall infiltration recharges the aquifer, and 10% goes to subsurface runoff.
The runoff coefficient (Cr) is low throughout Nema catchment, but it is slightly lower in plots 3 and 4, because of the low ground slope (Albergel and Dacosta Citation1995) and the land cover (forest), which facilitates the infiltration and reduces surface runoff.
The maximum soil water storage is slightly higher in plots 3 and 4, because these plots are close to the streambed and flooded in both the rainy and dry seasons. Therefore, water availability is not a limiting factor for evapotranspiration. Furthermore, plots 3 and 4 are forest areas where tree roots can extend deeper into the soil to draw water (Smith et al. Citation1997).
The value for horizontal hydraulic conductivity of the aquifer on the left and right slopes is almost the same as the 10-5 m s-1 obtained by Diluca (Citation1976) in Lienou et al. (Citation1999), and corresponds to sandy clay or clayey sand, as observed in the field. However, the hydraulic conductivity attributed to the headslope (10-9 m s-1) is very low and has no physical reality. It is comparable to the hydraulic conductivity of an impervious material (Batu Citation1998). This hydraulic conductivity value was chosen only for the purpose of modelling the non-contribution of the headslope groundwater to the Nema streamflow.
The daily measured and simulated discharges at the outlet are presented in for the rainy period, since discharge is null during the dry season.
Fig. 8 1995/96 hyetograph-hydrograph and comparison of the measured and simulated catchment outlet flows (details for the rainy period).
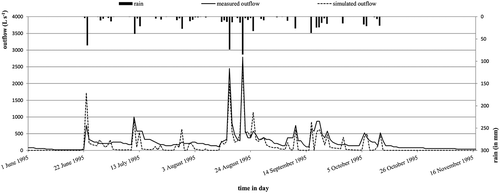
Some divergences exist between the computed and observed values; the peaks are synchronous, but the computed values can be very different to the measured ones, and outflow during the recession is systematically underestimated. The first flow peak is overestimated, while the subsequent peaks are either greater or smaller than what was observed.
Light rain (less than 10 mm) does not influence the observed flow, but appears as small peaks on the computed values. The rapid increase in flow is quite close to reality.
3.3 Model validation
Calibration was completed with a validation performed for the 1997/98 hydrological year. Results are presented in for the rainy period, since discharge is null during the dry season. Simulation was performed using the parameter values presented in . For this year, the Nash efficiency is 0.73, and the overall water balance error is 0.005%.
Fig. 9 1997/98 hyetograph-hydrograph and comparison of the measured and simulated catchment outlet flows (details for the rainy period).
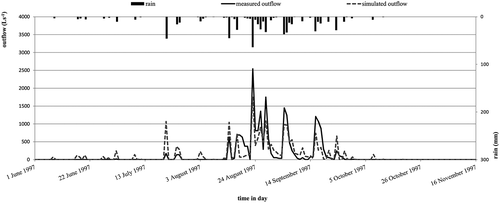
As before, the computed and measured peaks are synchronous but their values can be rather different. Again, light rain (less than 10 mm) causes simulation of peaks that do not exist in the measured data.
During the recession period, the flow is systematically higher in reality than the simulated values. Lack of data made it impossible to analyse the 1998 period.
4 DISCUSSION
The 1995/96 hydrological year was wetter than 1997/98, with 743 and 608 mm of rainfall, respectively. The water balance assessment () shows that evapotranspiration and infiltration are the most important hydrological processes in the Nema catchment. Evapotranspiration represents about 70% of the precipitation for both study years. Infiltration represents about 29% and 22% of the precipitation for the same period.
Fig. 10 Overall water balance for 1995 and 1997 at the catchment scale (ETa: actual evapotranspiration).
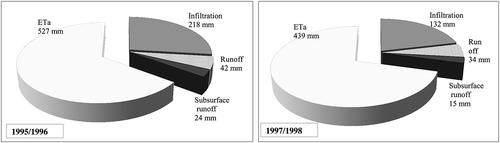
The actual evapotranspiration and infiltration data obtained with Hydrosimul modelling were compared with Ngom’s Flux-Net calculations (Ngom Citation2000) that also used the Thornthwaite equation (). Regarding infiltration, there is good corroboration with Ngom (Citation2000) for the 1997/98 hydrological year, but not for 1995/96. The differences are due to different assessments of soil moisture storage: it was set to 40 mm for Hydrosimul whereas the Flux-Net calculations used 100 mm.
Table 2 Comparison of actual evapotranspiration and infiltration for the Nema catchment, as calculated by Hydrosimul and by Flux-Net (Ngom Citation2000).
Runoff and subsurface runoff account the smallest parts of the water balance. If more water is needed, groundwater is the best reserve. By comparing the two hydrological years (1995/96 and 1997/98), we find that the sensitivity of groundwater to the amount of precipitation is high: the variation in precipitation is 135 mm (−22% of the annual cumulated total), which leads to the following variations: −20% for evapotranspiration, −35% for surface and subsurface runoff, and −65% for ground water. Thus, a decrease in precipitation leads to a considerable decrease in infiltration.
5 CONCLUSION
The objective of this study was to evaluate the amount of water available in the Nema catchment during the dry and the wet seasons, and to better understand the hydrological processes involved. For this purpose, we used the Hydrosimul modelling tool.
The first step was to select parameter values describing the catchment in order to optimize the Nash efficiency. The results show good agreement between measured and computed outflows, with Nash efficiency values of about 0.70. Hydrosimul describes the general behaviour of the stream, but also produces some artefacts and biases, mostly for light rains and the low streamflow period.
The second step involved the analysis of the results. The calculations provide information on the hydrological processes in the soil. This model shows that evapotranspiration is the main hydrological process in the Nema catchment. It represents about 70% of the precipitation. Recharging infiltration is the second hydrological process (about 25%). Only a small part of the total water input contributes to runoff. Our comparison of the two years studied shows that groundwater recharge is very sensitive to the total amount of precipitation. This work provides the opportunity to better evaluate the water in this catchment and better understand the underground hydrological processes in the region. It would be of great interest to collect data about precipitation, temperature, and discharge over 10 years in order to highlight the trend in the groundwater level. In depth research must be conducted to improve our knowledge of conductivity.
Disclosure statement
No potential conflict of interest was reported by the authors.
Additional information
Funding
REFERENCES
- Akpo, L.E. et al., 2003. Land use and the management of forest resources in the Sudanian zone of West Africa. The example of the river basin of Néma in Senegal. In: P. Dugue and P.H. Jouve, eds. Colloque International sur l’organisation spatiale et gestion des ressources et des territoires ruraux, 25–27 February 2007 Montpellier, 1–14.
- Albergel, J. and Dacosta, H., 1995. Les écoulements non pérennes sur les petits bassins du Sénégal. In: P. Chevallier and B. Pouyaud, eds. L’hydrologie tropicale: géoscience et outil pour le développement. (Proceedings of Paris conference, May 1995). Wallingford: International Association of Hydrological Sciences, IAHS Publ. 238, 139–156. http://iahs.info/uploads/dms/iahs_238_0139.pdf
- Batu, V., 1998. Aquifer hydraulic: comprehensive guide to hydrologic data analysis. New York: John Wiley & Son.
- Camara, M., Kébé, M., and Kouamé, M., 2008. Intensification de la riziculture de bas-fonds dans le Sine-Saloum (Sénégal). Cahiers Agricultures, 17 (5), 451–455.
- Chippaux, J.-P., et al., 2007. Évaluation de la potabilité de l’eau dans une zone peuplée du Sahel sénégalais : Niakhar. Environnement, Risques & Santé, 6 (5), 373–381.
- Cosandey, C. and Robinson, M., 2007. Hydrologie continentale. Paris: Armand Colin.
- Courbis, A.-L. and Vayssade, B., 2007. Simulation as a decision-support for evaluating effects of anthropogenic activities on water resources. In: 10th International Conference on Environmental Science and Technology (CEST), September 2007, Kos Island. Mytilene: University of the Aegean, 267–274.
- Courbis, A.-L., et al., 2008. Modelling and simulation of catchment in order to evaluate water resources. Global NEST Journal, 10 (3), 301–309.
- Diluca, C., 1976. Hydrogeology of the Continental terminal aquifer between the Sine and the Gambia. Orléans: BRGM, Technical report, BRGM-DKR 76 DK.
- Lebel, T. and Ali, A., 2009. Recent trends in the Central and Western Sahel rainfall regime (1990–2007). Journal of Hydrology, 375 (1–2), 52–64. doi:10.1016/j.jhydrol.2008.11.030
- Lienou, G., Sighomnou, D., and Sigha Nkamdjou, L., 1999. Caractérisation des relations eaux de surface-eaux souterraines en milieu tropical sec: exemple du bassin de la Nema (Sine Saloum, Sénégal). Sud Sciences & Technologies, 3, 39–46.
- Malou, R., 1992. Etude des aquifères superficiels en basse Casamance: un modèle de bilan hydrique. Thesis (PhD). Cheikh Anta Diop University, Dakar (Sénégal).
- Malou, R., 2004. Impact des changements climatiques sur les ressources en eau souterraine en zone soudano-sahélienne. Thesis (HdR). Cheikh Anta Diop University, Dakar (Sénégal).
- Nash, J.E. and Sutcliffe, J.V., 1970. River flow forecasting through conceptual models part I — a discussion of principles. Journal of Hydrology, 10 (3), 282–290. doi:10.1016/0022-1694(70)90255-6
- Ngom, D.F., 2000. Caractérisation des transferts hydriques dans le bassin versant de la Nema au Sud des régions de Sine et de Saloum. Thesis (PhD). Cheikh Anta Diop University, Dakar (Sénégal).
- Ngom, F.D., et al., 2002. Contrainte climatique des nappes d’eau souterraines en zone soudano-sehelienne: cas de la nappe phréatique du bassin de la Nema dans la région du Sine au Centre Ouest du Senegal. African Journal of Science and Technology, 3 (1), 44–50. doi:10.4314/ajst.v3i1.15286
- Oudin, L., Michel, C., and Anctil, F., 2005. Which potential evapotranspiration input for a lumped rainfall–runoff model ? Part 1—Can rainfall–runoff models effectively handle detailed potential evapotranspiration inputs? Journal of Hydrology, 303 (1–4), 275–289. doi:10.1016/j.jhydrol.2004.08.025
- Penman, H.L., 1948. Natural evaporation from open water, bare soil and grass. Proceedings of the Royal Society London, A, 193, 120–145. doi:10.1098/rspa.1948.0037
- PEPAM-Sénégal, 2010. Accès à l’eau et à l’assainissement: Communauté rurale de Toubacouta (Région de Fatick, Sénégal). Available from: http://www.pepam.gouv.sn/acces.php?idreg=09&idcr=09234 [ Accessed 14 March 2014].
- Pontié, M., et al., 1996. Sur le problème de fluorose au Sénégal: bilan des connaissances et présentation d’une nouvelle méthode de défluoration des eaux de boisson. Cahiers Santé, 6 (1), 27–36.
- Smith, D.M., Jarvis, P.G., and Odongo, J.C., 1997. Sources of water used by trees and millet in Sahelian windbreak systems. Journal of Hydrology, 198 (1–4), 140–153. doi:10.1016/S0022-1694(96)03311-2
- Thornthwaite, C.W. and Mather, J.R., 1957. Instructions and tables for computing potential evapotranspiration and water balance. Publications in Climatology, 10 (3), 185–311. Laboratory of Climatology, Drexel Institute of Technology, Centerton, NJ.
- Turc, L., 1954. Le bilan d’eau des sols: relations entre les précipitations, l’évaporation et l’écoulement. Annales Agronomiques, 4, 491–596, Paris: INRA.
- Vayssade, B., ed., 2008. LOWRGREP: landscape-use optimization with regards to the groundwater resources protection in mountain hardrock areas [online]. London: IWA Publishing. Available from: http://www.iwaponline.com/wio/2008/01/wio200801RF1843391937.htm