
Abstract
Climate change will likely have severe effects on water shortages, flood disasters and the deterioration of aquatic systems. In this study, the hydrological response to climate change was assessed in the Wei River basin (WRB), China. The statistical downscaling method (SDSM) was used to downscale regional climate change scenarios on the basis of the outputs of three general circulation models (GCMs) and two emissions scenarios. Driven by these scenarios, the Soil and Water Assessment Tool (SWAT) was set up, calibrated and validated to assess the impact of climate change on hydrological processes of the WRB. The results showed that the average annual runoff in the periods 2046–2065 and 2081–2100 would increase by 12.4% and 45%, respectively, relative to the baseline period 1961–2008. Low flows would be much lower, while high flows would be much higher, which means there would be more extreme events of droughts and floods. The results exhibited consistency in the spatial distribution of runoff change under most scenarios, with decreased runoff in the upstream regions, and increases in the mid- and lower reaches of the WRB.
Editor Z.W. Kundzewicz; Associate editor D. Yang
Résumé
Le changement climatique serait susceptible d’avoir des effets importants sur les pénuries en eau, les crues catastrophiques et l’altération des écosystèmes aquatiques. Dans le cadre de la présente recherche, la réponse hydrologique au changement climatique a été évaluée pour le bassin de la rivière Wei (BRW) en Chine. Une méthode de descente d’échelle statistique (Statistical Downscaling Method – SDSM) a été utilisée pour désagréger des scénarios régionaux de changement climatique, sur la base des sorties de trois modèles de circulation générale (MCG) et de deux scénarios d’émissions. Contraints par ces scénarios, l’outil d’évaluation pour les sols et les eaux (Soil and Water Assessment Tool – SWAT) a été mis en place, calé et validé pour évaluer l’impact du changement climatique sur les processus hydrologiques du BRW. Les résultats ont montré que la moyenne annuelle de l’écoulement lors des périodes 2046–2065 et 2081–2100 pourrait augmenter respectivement de 12,4% et 45%. Dans ce cas, les basses eaux seraient beaucoup plus faibles, tandis que les hautes eaux seraient beaucoup plus importantes, ce qui signifie qu’il y aurait des événements de sécheresses et de crues plus accusés. Cela a montré la cohérence des changements d’écoulements dans l’espace pour la plupart des scénarios, avec des diminutions pour les régions à l’amont du BRW, et des augmentations pour les zones au centre et à l’aval du bassin.
1 INTRODUCTION
Global climate change, which is attributed to the increase of greenhouse gas emissions, is likely to produce significant effects on the hydrological cycle (IPCC Citation2007). In China, many researchers have found that pervasive human interference, such as the construction of soil and water conservation projects, reservoirs and irrigation infrastructures, has contributed much to the reduction of water resources in the Yellow River Basin (Ringler et al. Citation2010). However, climate change, including the reduction of precipitation and increase of temperature, has also played an important role in runoff changes in the second largest river in China (Liu and Cui Citation2011). The hydrological cycle, as the key linkage of the atmosphere and biosphere, is inevitably influenced by the natural forces resulting from climate change (Xu et al. Citation2005). Investigation of hydrological response to climate change is becoming more and more important for present and future water resources management (Christensen et al. Citation2004).
The Wei River is the largest tributary of the Yellow River. It is the major source of water supply for the Guanzhong Plain, the economic hub of western China. The Wei River basin (WRB) plays an important role in the management and development of water resources in the Yellow River basin, and has great strategic significance in the regional economic development and the development of western China. Therefore, studies of climate change in the WRB are important for efficient and sustainable utilization of water resources and maintaining the good health of the river ecosystem in western China (Zuo et al. Citation2012).
At present, assessment of hydrological response to climate change basically follows the paradigm of: ‘climate scenario generation–hydrological simulation–hydrological response assessment’. Coupling general circulation models (GCMs) and hydrological models is considered the most promising way to assess the impact of climate change on water resources, since GCMs can provide more credible information about future climate, and hydrological modelling generates more knowledge of local hydrological processes and changes (Bronstert et al. Citation2002). Although distributed hydrological models with finer resolution are inherently incompatible with GCMs on spatial and temporal scales, statistical downscaling bridges two different scales by establishing empirical (statistical) relationships between large-scale features simulated by GCMs and regional/local climate variables (Xu et al. Citation2009a).
Many previous studies have investigated the response of watershed hydrological processes to climate change at different scales in China. For instance, Guo et al. (Citation2002) developed a macro-scale and semi-distributed monthly water balance model to assess the impact of climate change on hydrological processes in China, based on different GCM and RCM outputs. Liu et al. (Citation2010) assessed the impacts of climate change on hydrological processes in the headwater catchment of the Tarim River basin (China) using the variable infiltration capacity (VIC) macro-scale hydrological model and the Delta method for constructing regional climate change scenarios. Xu et al. (Citation2011) applied climate projections from GCMs to the SWAT model in two catchments of the Yangtze and Yellow river basins and assessed uncertainty in the impacts of climate change on river discharge in the two catchments. Chen et al. (Citation2012) coupled GCMs and two hydrological models (the Xinanjiang model and HBV model) to analyse the impacts of climate change on future runoff from Qingjiang watershed using a statistical downscaling method.
Among the aforementioned models, SWAT (the Soil and Water Assessment Tool) is one of the best choices for application to large ungauged basins for climate change impact assessment. SWAT was developed by the US Department of Agriculture, Agricultural Research Service (USDA-ARS) for assessing the impact of human activities and climate change on streamflow, sediment and agricultural chemical yields in large river basins (Arnold et al. Citation1998). The SWAT model has been used extensively worldwide in many fields, such as runoff and sediment simulations (Rostamian et al. Citation2008, Xu et al. Citation2009b, Maalim and Melesse Citation2013), non-point source pollution estimation (Narasimhan et al. Citation2010, Wang et al. Citation2011, Niraula et al. Citation2013), calibration and uncertainty analysis (van Griensven and Meixner Citation2007, Yang et al. Citation2008, Zhang et al. Citation2009), and also climate change impact assessment. Xu et al. (Citation2009c) used four GCMs (CGCM2, CCSR, CSIRO and HadCM3) to generate future possible local meteorological variables, which were then used as input to SWAT to simulate the corresponding future streamflow regime in the headwater catchment of the Yellow River basin. Li et al. (Citation2010) evaluated the possible impacts of climate change in the period 2010–2039 on water resources in the Heihe basin on the Loess Plateau of China and further explored adaptive measures to cope with the changes. Projections of four climate models (CCSR/NIES, CGCM2, CSIRO-Mk2 and HadCM3) and SWAT were employed to simulate the hydrological response to climate changes. Raneesh and Santosh (Citation2011) downscaled a RCM to project future climate scenarios, which were then used as inputs for SWAT to evaluate the effect of climate change on streamflow in a humid tropical watershed of India. Liu et al. (Citation2011) investigated the impacts of climate change on streamflow in the Yellow River basin by using SWAT, outputs from HadCM3 and the statistical downscaling model (SDSM). Ficklin et al. (Citation2012) assessed the impacts of expected 21st century climatic changes in the Sierra Nevada at the sub-basin scale by using SWAT for all the hydrological flow components, and a suite of 16 GCMs with two emissions scenarios. Wang et al. (Citation2012) used the output from the Providing Regional Climates for Impacts Studies (PRECIS) regional climate model in conjunction with SWAT to analyse the effects of climate change on streamflow of the Xiying and Zamu rivers in the Shiyang River basin. Dile et al. (Citation2013) assessed the impact of climate change on the Gilgel Abay River in the Upper Blue Nile Basin. The SDSM was used to downscale the HadCM3 GCM scenario data to provide input to SWAT. Kankam-Yeboah et al. (Citation2013) used SWAT and downscaled climate projections from the ensemble of two GCMs (ECHAM4 and CSIRO) to estimate the impact of climate change on streamflow in the White Volta and Pra river basins in Ghana. Few of the aforementioned studies have used multi-GCM outputs, downscaling methods and hydrological models to comprehensively assess the potential impacts of climate change on temporal characteristics of annual and daily runoff regimes and the spatial distribution of mean annual runoff at the sub-basin scale in western China.
In this study, a one-way coupling of GCMs and a hydrological modelling approach is adopted to evaluate hydrological response to future climate change scenarios in the WRB. A unidirectional linkage system, i.e. a GCM outputs–statistical downscaling method–distributed hydrological model (SWAT) coupling system, is developed in the WRB. Firstly, multi-GCM output and multi-emission scenarios were downscaled using a statistical downscaling method. Secondly, the distributed hydrological model SWAT was calibrated and validated to simulate monthly and daily runoff for a long time period at the sub-basin scale. Finally, the climate change scenarios were used to drive the SWAT model, and possible changes in the temporal characteristics of the flow regime and the spatial distribution of mean annual runoff were projected for future periods. The results obtained in this study could be used as a reference for water resources management by local water authorities.
2 STUDY AREA DESCRIPTION
The Wei River () originates from Niaoshu Mountain, flows through the provinces of Gansu, Ningxia and Shaanxi, and runs into the Yellow River at Tongguan. The basin is located between 104°00′E and 110°20′E, and 33°50′N and 37°18′N, with a length of 818 km and a drainage area of 1.35 × 10⁵ km2. The northern part of the basin is on the Loess Plateau and the southern part is in the Qinling Mountains; the western part is geographically high, while the eastern part is low. The Wei River has many tributaries: the largest is the Jing River, which is 455.1 km long and covers an area of approximately 45 400 km2, accounting for 33.7% of the total area of the WRB, while the second largest is the Beiluo River, which has a length of 680 km, with a catchment area of 26 900 km2 occupying 20% of the whole WRB.
Fig. 1 Sketch map of the Wei River basin.
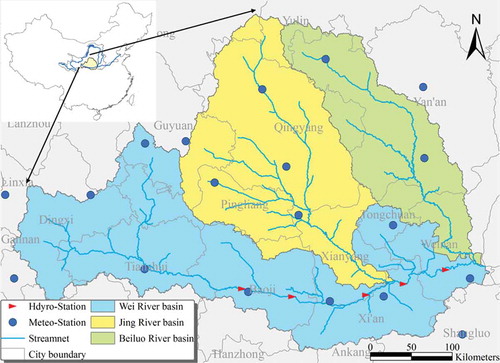
The WRB is located in a semi-arid area with temperate continental monsoon climate. In winter the climate is cold, dry and rainless, controlled by the Mongolia high pressure system, and it is hot and rainy in summer due to the effects of the West Pacific subtropical high pressure system. The precipitation, temperature, evaporation and runoff vary greatly at inter-annual and intra-annual time scales. The mean air temperature is 7.8−13.5°C (decreasing from the main channel towards the northern and southern tributaries), mean annual precipitation is 400−800 mm year-1 (decreasing from south to north), potential evapotranspiration is 800−1000 mm year-1 (decreasing from east to west), mean runoff is 195 m3 s-1, and the runoff coefficient varies within the range 0.1−0.2 (He et al. Citation2009).
3 HYDROLOGICAL SIMULATION
3.1 The hydrological model SWAT
The physically-based distributed hydrological model, SWAT (ver. 2009) developed within ArcGIS 9.3, was adopted in this study. The SWAT model is a continuous hydrological model developed by USDA-ARS in the early 1990s to assess the impact of land management practices on water, sediment and agricultural chemical yields in large complex watersheds with varying soils, land uses and management conditions over long periods of time. The main components of SWAT include hydrology, climate, nutrient cycling, soil temperature, sediment movement, crop growth, agricultural management and pesticide dynamics (Neitsch et al. Citation2005).
Spatial parameterization for the SWAT model is performed by dividing the basin into sub-basins on the basis of topography and subdividing sub-basins into a series of Hydrologic Response Units (HRU) based on unique soil, land-use and slope characteristics. The responses of each HRU in terms of water and nutrient transformations and losses are determined individually, aggregated at the sub-basin scale and routed to the associated reach and basin outlets through the channel network. The SWAT model represents the local water balance through four storage volumes: snow, soil profile, shallow aquifer and deep aquifer. The soil water balance equation is the basis of the hydrological modelling. The simulated processes include surface runoff, infiltration, evaporation, plant water uptake, lateral flow, and percolation to shallow and deep aquifers. Surface runoff is estimated by a modified Soil Conservation Service (SCS) curve number (CN) equation using daily precipitation data based on the soil hydrology group, land-use/land-cover characteristics and antecedent soil moisture. Further technical details of SWAT are given by Neitsch et al. (Citation2005).
3.2 The calibration and uncertainty analysis procedure, SUFI-2
The sequential uncertainty fitting algorithm (SUFI-2) procedure (Abbaspour Citation2007) was used for parameter optimization. In this procedure, all sources of uncertainties such as driving variables, conceptual model, parameters, and measured data are represented in the ranges of parameters, which are calibrated to bracket most of the measured data in the 95% prediction uncertainty. Overall uncertainty in the output is quantified by the 95% prediction uncertainty (95PPU) calculated at the 2.5% (L95PPU) and 97.5% (U95PPU) levels of the cumulative distribution of an output variable obtained through Latin hypercube sampling. The SUFI-2 procedure starts with large but physically meaningful parameter ranges that bracket most of the measured data within the 95PPU, and then decreases the parameter uncertainties iteratively. After each iteration, new and narrower parameter uncertainties are calculated where the more sensitive parameters find a larger uncertainty reduction than the less sensitive parameters. Two indices are used to quantify the goodness of calibration/uncertainty performance: the P factor, which is the percentage of measured data bracketed by the 95PPU band, and the R factor, which is the average width of the band divided by the standard deviation of the corresponding measured variable. Theoretically, the value of P factor ranges between 0 and 100%, while that of R factor ranges between 0 and infinity. A P factor of 1 and R factor of 0 would indicate a simulation that exactly corresponds to the measured data. As a larger P factor can be obtained at the expense of a larger R factor, a trade-off between the two indices must be sought (Abbaspour Citation2007).
3.3 Database description and model set-up
The input data needed in SWAT include a digital elevation model (DEM), land-use map, soil map, digital stream network, as well as meteorological and hydrological observed data. In this study, the DEM (1:250 000), land-use map (1:250 000) and soil map (1:1 000 000) were obtained from the Resources and Environmental Sciences Data Centre (RESDC) of the Chinese Academy of Sciences. Daily meteorological data series (precipitation, maximum and minimum air temperature, relative humidity, wind speed, etc.) for the period from 1961 to 2008 were obtained from the China Meteorological Data Sharing Services System Network for 21 stations. Daily runoff data series were obtained from the Yellow River Conservancy Commission (YRCC) for five gauging stations (Linjiacun, Weijiabao, Xianyang, Lintong, and Huaxian) for the same period (1961–2008), and were used to calibrate and validate the SWAT model.
On the basis of the DEM and digital stream network, a minimum drainage area of 8000 ha was chosen to discretize the WRB into 106 sub-basins. The geomorphology, stream parameterization and overlay of soil and land use were done automatically within SWAT. These 106 sub-basins were further subdivided into 565 HRUs based on unique combinations of soil and land use.
3.4 The hydrological simulation in the Wei River basin
Sensitivity analysis, calibration, validation and uncertainty analysis were performed for the hydrological model using monthly runoff data. The calibration period was 1990–2008, considering the first 3 years as the warm-up period. The validation period was 1961–1989; the first 3 years of the period were excluded from the analysis to mitigate the impact of the unknown initial conditions. Because the series of hydro-meteorological variables involved in this study start in the early 1960s when the hydro-meteorological measuring technology was still relatively poor, more errors in the input data could be expected and so larger input uncertainty. Therefore, a recent 19-year period, between 1990 and 2008, was adopted for calibration when the study area experienced wet, dry and average hydrological conditions, and more importantly, the quality of input data is good enough to satisfy the model calibration. Data prior to 1964–1989 were used to validate the calibrated model. For a similar reason, Van Liew et al. (Citation2005) used data for the period 1997–2002 for calibration, and data from 1972 to 1996 for validation of the model, and Sridhar and Nayak (Citation2010) adopted more recent data (1997–2006) to calibrate, and an earlier period (1967–1996) to validate the model.
As hydrology in SWAT involves a large number of parameters, a sensitivity analysis was performed to identify the key parameters across different regions. For the sensitivity analysis, 28 parameters related to hydrology were initially selected, and are referred to as ‘global’ parameters in this study. The results of the sensitivity analysis of parameters involved in calibration () show that most of the 28 global parameters related to hydrology were sensitive to runoff. As expected, parameters such as CN2 (SCS runoff curve number), ALPHA_BF (baseflow alpha factor) were the most sensitive. All parameters selected in this study were involved in the following calibration procedure.
Table 1 Results of sensitivity analysis of parameters involved in calibration.
To compare the observed and simulated runoff hydrograph, a modified version of the efficiency criterion was selected as an objective function in the calibration procedure, defined as (Krause et al. Citation2005):
The Nash and Sutcliffe (Citation1970) coefficient of efficiency (ENS), and the coefficient of determination (R2) were also used to measure the model performance. The closer the values of ENS, R2 and Φ are to 1, the more successful the model calibration/validation.
presents the calibration and validation results for Linjiacun, Weijiabao, Xianyang, Lintong and Huaxian stations. The R factor values for both calibration and validation at these five stations were quite small. However, the P factor values for the calibration at Linjiacun and Weijiabao were small, which indicates that the actual uncertainty is larger than expected. The validation period showed better agreement than that of the calibration period. This is probably because the model is more suitable for wetter conditions, and is in accordance with the findings of Xie and Cui (Citation2011). The other reason is that there is a general tendency for SWAT to underestimate spring peaks and to sometimes overestimate autumn streamflow (Arnold et al. Citation2000), which obviously occurred in the drier conditions of the calibration period.
Fig. 2 Comparison between observed and simulated prediction uncertainty band of monthly hydrographs at all stations for both calibration and validation periods.
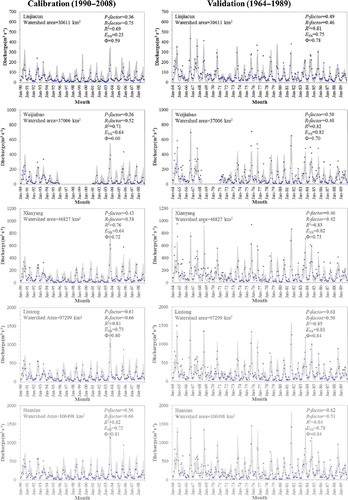
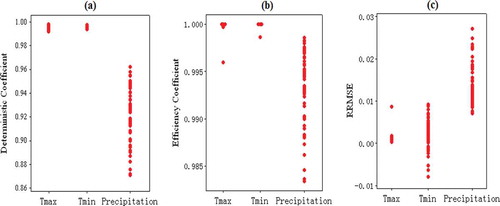
Fig. 3 Performance of the SDSM in this study.
In calibration (validation), the Φ and ENS values at most of the stations were higher than 0.6 (0.7), and R2 at all stations was higher than 0.7 (0.8). Stations with relatively poor simulation were Linjiacun and Weijiabao, located in the upstream region. Based on information from local experts and previous research in the study area (Shangguan et al. Citation2002, Wang et al. Citation2007), possible reasons for large uncertainties at these stations include the construction or operation of reservoirs and insufficient accounting for agricultural water usage. Generally speaking, the model performance criteria were quite satisfactory enough for further studies.
4 GENERATION OF CLIMATE CHANGE SCENARIOS
4.1 Statistical downscaling model, SDSM
Downscaling is necessary to generate information below the grid scale of GCMs. There are two main approaches to downscaling: dynamical and statistical methods (Fowler et al. Citation2007). Statistical downscaling was widely used in the present climate change impact study as this method offers considerable computational savings and can be applied relatively easily to different GCMs, parameters and regions (Wood et al. Citation2004).
The statistical downscaling model (SDSM) is a decision support tool for assessing local climate change impacts using a robust statistical downscaling technique. It facilitates the rapid development of multiple, low-cost, single-site scenarios of daily surface weather variables under current and future climate forcing (Wilby et al. Citation2002). The SDSM uses a hybrid of stochastic weather generator and multi-linear regression methods. Generally, the application of the SDSM requires five steps (Wilby et al. Citation2006): (1) selection of predictors; (2) model parameter calibration; (3) simulation; (4) model validation; and (5) generation of future series of climate variables. The detailed technical information about the SDSM can be found in Wilby et al. (Citation2002).
4.2 Climate change scenarios generated by SDSM
Precipitation and temperature are the main driving factors of runoff. Daily precipitation (P), maximum (Tmax) and minimum temperature (Tmin) are the preliminary inputs to the SWAT model. Therefore, these three variables the predictands in the SDSM. First, appropriate predictors were selected by the statistical relationship between predictands (observed station data) and predictors (ERA-40 reanalysis data). Then, SDSM was calibrated and validated based on these predictands and predictors. Finally, future time series from three climatic models: CSIRO: MK30, INM: CM30 and MRI-CGCM2.3.2 (abbreviated as CSIRO, INM and MRI, respectively), were input to the SDSM to simulate daily time series of each predictand under the A2 and B1 emissions scenarios.
In SDSM, the 1961–2000 time series were divided into two periods: 1961–1990 and 1991–2000, for model calibration and validation, respectively (Khan et al. Citation2006). The time series of station data and ERA-40 reanalysis data of the period 1961–2000 were divided similarly for model calibration and validation. The ERA-40 reanalysis data were from the European Centre for Medium-Range Weather Forecasts (ECMWF). The archive we used contains 12 daily predictors including air temperature, specific humidity, zonal velocity, and meridional velocity at 500, 700 and 850 hpa. The datasets had been processed to conform to the 2.5º × 2.5º grid resolution of the three GCMs: CSIRO, INM and MRI. The deterministic coefficient (DC), efficiency coefficient (EC) and relative root mean squared error (RRMSE) are used to show the performance of the SDSM in this study. The three statistics of daily precipitation, and maximum and minimum temperature in show that the daily maximum and minimum temperature are better generated by SDSM than daily precipitation, since DC and EC for daily precipitation are smaller than for temperature, while RRMSE for precipitation is larger than for temperature. Generally speaking, daily precipitation, maximum and minimum temperature generated in the SDSM are acceptable in this study.
Based on the calibrated SDSM model, the three GCMs data for the A2 and B1 emissions scenarios were input to the model, and future daily time series of maximum and minimum temperature and precipitation for each station in the Wei River basin were generated. In the analysis of future climate change, the World Meteorological Organization (WMO) recommends that it is better to use the period 1961–1990 as the baseline rather than 1971–2000, as the latter was greatly affected by climate change. Two periods, 2046–2065 and 2081–2100 were selected to analyse future climate change relative to 1961–1990.
5 SPATIO-TEMPORAL CHANGES OF RUNOFF UNDER CLIMATE CHANGE SCENARIOS
The climate change scenarios downscaled by SDSM from three GCMs were used to drive the SWAT model, and possible changes in temporal characteristics of runoff regime and spatial distribution of mean annual runoff in the Wei River basin were projected in the future periods of 2046–2065 and 2081–2100. These future periods were recommended by the Intergovernmental Panel on Climate Change (IPCC) as future simulation periods to represent the mid-century and late century, respectively. To reflect general hydrological conditions in the study area during recent decades, the average values of 48 years of observed data at Huaxian station and hydrological simulation results at sub-basin level were taken as the baseline condition. The temporal changes of runoff regime in the WRB were calculated based on the SWAT outputs of runoff generated by the climate change scenarios and observed runoff at Huaxian station, which is located near the outlet of the WRB. The values of runoff simulated by SWAT at each sub-basin of the WRB during the future periods and the baseline period were used to demonstrate the spatial changes in runoff.
5.1 Temporal characteristics
The mean values of annual runoff in the WRB for the periods 2046–2065 and 2081–2100 are shown in . The mean annual runoff for the baseline period was 72 × 108 m3. For the 2046–2065 period, the highest mean annual runoff would be 97.6 × 10⁸ m3, which is under the climate change scenario downscaled from CSIRO-B1; while the lowest mean annual runoff would be 68 × 108 m3, driven by the MRI-B1 scenario. For the period 2081–2100, the highest mean annual runoff would be 145.6 × 10⁸ m3 (INM-B1); while the lowest mean annual runoff would be 68.4 × 10⁸ m3 (CSIRO-B1). It is interesting that the highest and lowest mean annual runoff occur under B1 emmissions scenarios for 2046–2065 and 2081–2100. The average values of mean annual runoff under different scenarios for 2046–2065 and 2081–2100 were 80.4 and 104.3 × 10⁸ m3, respectively, i.e. increases by 12.4% and 45% relative to runoff in the baseline period. Overall, the results show an increasing trend for annual runoff from the WRB in the future, with the magnitude of that in 2081–2100 greater than that in 2046–2065.
Table 2 Quantile and mean values for annual runoff in the future periods 2046–2065 and 2081–2100 (108 m3 year-1).
also provides the 10th, 50th and 90th percentiles (described as R10, R50 and R90, respectively) of the annual runoff series in the two periods. The 10th and 90th percentiles of annual runoff indicate dry and wet years, respectively. The normal year can be described by the mean, or the 50th percentile values of annual runoff. The lowest R10 (37.6 × 10⁸ m3) was under the CSIRO-B1 scenario for 2081−2100, and the highest 100 × 108 m3, occurred under scenario INM-B1 for 2081−2100. It was noticed that the highest and lowest R10 occured under the INM-B1 and CSIRO-B1 scenarios for 2081−2100, consistent with the finding for mean annual runoff. The average values of R10 under all scenarios were 52.5 × 10⁸ and 64.7 × 10⁸ m3 for 2046−2065 and 2081−2100, respectively. shows that the highest R90 (188.4 × 10⁸ m3) was produced by the INM-B1 scenario for 2081−2100, and the lowest, 77.6 × 10⁸ m3, under INM-B1 for 2046−2065. Average values of R90 under all scenarios were 108.3 ×10⁸ and 138.3 ×10⁸ m3 for 2046−2065 and 2081−2100, respectively.
Further analysis to consider extreme events (floods and droughts) under future climate change scenarios was conducted using the extra SWAT simulation at daily intervals to calculate daily runoff percentiles. The 10th and 90th percentiles of daily runoff series (described as Q10 and Q90) in the baseline and future periods (2046–2065 and 2081–2100) are shown in . For 2046−2065, it showed decreasing trends (relative to baseline) for Q10 under all climate change scenarios except INM-A2, and increasing trends for Q90 under all climate change scenarios. This indicates that low flows would be much lower and high flows much higher in 2046−2065 than the baseline period. In other words, it is projected that there would be more extreme events of droughts and floods in the future. The lowest Q10 (11.5 m3 s-1) would decrease by 27.9% with respect to baseline period, was driven by the MRI-B1 scenario. The greatest Q90 in this period, 837.7 m3 s-1, an increase of 82%, occurred under scenario CSIRO-B1.
Table 3 Quantile values for daily runoff in the future periods 2046–2065 and 2081–2100.
For 2081−2100, Q90 showed increasing trends under all the climate change scenarios, but there was no obvious trend for Q10. This was partially consistent with the results for 2046−2065, and suggests that there would also be more extreme flood events in 2081−2100. The lowest Q10 value of 9.9 m3 s-1 (CSIRO-B1) in this period was a decrease by 38% from baseline. The greatest Q90 (964.9 m3 s-1, MRI-B1) is an increase of more than100% over baseline.
5.2 Spatial distribution of mean annual runoff
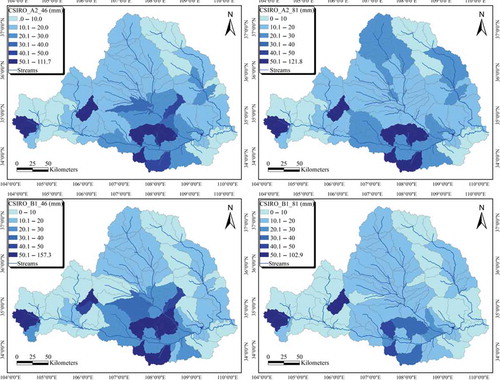
The spatial distribution of mean annual runoff in the WRB under the CSIRO scenarios for the future periods is shown in . The highest runoff occurs in parts of the upstream and midstream regions of the WRB, and the lowest runoff over most of the upstream region and the Beiluo River basin. Runoff under the B1 emissions scenario is less than under the A2 scenario in both periods (area with runoff >50 mm is smaller under B1 than under A2). The differences in runoff between the two periods are not as obvious as those between the two emissions scenarios.
Fig. 4 Spatial distribution of mean annual runoff under CSIRO scenarios.
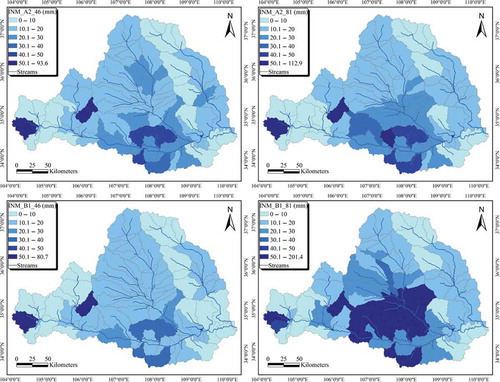
shows the spatial distribution of mean annual runoff under climate change scenarios downscaled from INM. As with CSIRO, the highest runoff occurs in parts of the upstream and midstream regions of the WRB, and the lowest runoff over most of the upstream region and the Beiluo River basin. Runoff was generally larger than 40 mm at the midstream of the WRB, and the highest runoff was about 200 mm. There is consistency in the spatial distribution among the A2 emissions scenarios in 2046−2065 and 2081−2100, and the B1 scenario in 2046−2065, but runoff under the B1 scenario in 2081−2100 is obviously greater, and the highest value in the midstream region was more than 200 mm.
Fig. 5 Spatial distribution of mean annual runoff under INM scenarios.
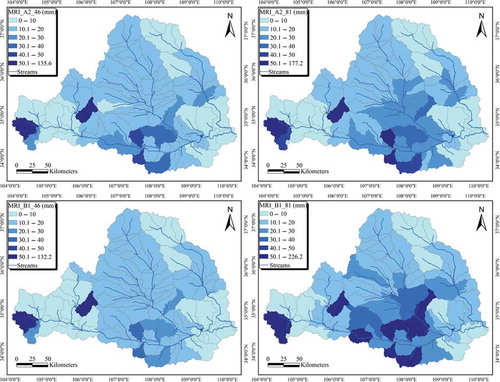
The spatial distribution of mean annual runoff under the MRI scenarios is shown in . Again, the highest runoff occurs in parts of the upstream and midstream regions of the WRB, and the lowest runoff over most of the upstream region and the Beiluo River basin. Under these climate change scenarios, runoff was generally larger than 50 mm at the midstream of the WRB, and the highest runoff reached about 200 mm. Under the A2 and B1 emissions scenarios, runoff for the 2081−2100 period was larger than for 2046−2065. The highest runoff was >220 mm in 2081−2100, driven by MRI-B1, and much larger than that in the baseline period, CSIRO and INM scenarios.
Fig. 6 Spatial distribution of mean annual runoff under MRI scenarios.
– show the spatial changes in runoff under climate change scenarios with respect to that in the baseline period. The magnitude of runoff changes was from –9 to 129.2 mm under the CSIRO scenarios (), and the changes in most regions showed positive trend. In general, changes in runoff are consistent between the different scenarios with runoff decrease in the headwater catchments of the WRB and upstream of the Beiluo River basin, and runoff increase in the middle and downstream regions of the WRB. The magnitude of the decreasing trend was less than 10 mm, while a significant increasing trend occurred in the midstream region of the WRB, with the largest magnitude of increasing trend reaching about 100 mm, especially for runoff under the B1 scenario for 2046−2065. Overall, shows decreasing trend in the headwaters and increasing trend in the midstream of WRB for runoff under the CSIRO scenarios, with the magnitude of increasing runoff greater under B1 than A2.
Fig. 7 Spatial changes of mean annual runoff under CSIRO scenarios.
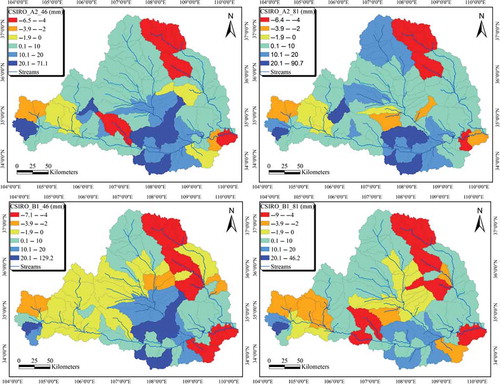
Fig. 8 Spatial changes of mean annual runoff under INM scenarios.
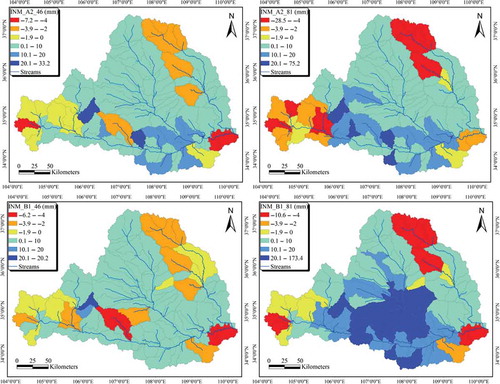
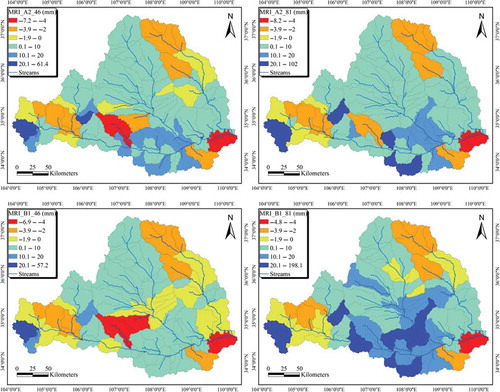
Fig. 9 Spatial changes of mean annual runoff under MRI scenarios.
Using INM, the magnitude of changes in runoff was from –28.5 mm to 173.4 mm, and most values were positive (). There is consistency for changes in runoff under different combined scenarios, with runoff decrease at some upstream region of the WRB and upstream of the Beiluo River basin, but increase at the mid-lower stream catchments. Where runoff decreased, the magnitude of negative trend was about –10 mm and up to about –30 mm. The increasing trends in the mid- and downstream WRB () are clear, with magnitudes of positive trend larger than 20 mm and up to about 173.4 mm.
The spatial results using MRI () generally also show consistency for changes in runoff under different combined scenarios, with runoff decrease in some upstream areas, and upstream of the Beiluo River basin, and runoff increase elsewhere. The magnitude of changes in runoff ranged from – 8.2 to 198.1 mm, with most of the values positive. The region with decreasing runoff has a negative trend of less than 10 mm. Overall, it showed greater increasing trends were projected with the MRI scenarios than under the CSIRO and INM scenarios for most parts of the basin.
6 CONCLUSIONS
In this study, the SWAT model was applied to simulate hydrological processes in the WRB for both the baseline and future periods, based on observed runoff data and climate change scenarios downscaled from three GCMs by virtue of the SDSM. Our conclusions can be summarized as follows:
The criteria of model performance of the calibrated SWAT model for runoff simulation in the WRB were sufficiently satisfactory for further climate change impact assessment to be carried out.
Average values of mean annual runoff in the periods 2046−2065 and 2081−2100 were 80.4 × 10⁸ m3 and 104.3 × 10⁸ m3, exceeding runoff in the baseline period by 12.4% and 45%, respectively. The results indicate an increasing trend for runoff in the WRB in the future.
In both of the future periods, decreasing trend for Q10, and increasing trend for Q90 were general under most scenarios. This indicates that low flows would be much lower, while high flows would be much higher than in the baseline period. In other words, there would be more extreme events of droughts and floods in the future.
The future spatial distribution of runoff over the WRB showed consistency for changes in runoff under most scenarios, with runoff decreased in some areas of the upstream of the WRB and the upstream of the Beiluo River basin, but increased in the mid- to downstream of the WRB. There was no significant difference between the decreasing trends under different scenarios (average value –10 mm), while the highest increased runoff, which occurred in the midstream region of the WRB, would reach at about 200 mm.
Acknowledgements
The authors would like to thank the editor and two anonymous reviewers for their useful and constructive comments and suggestions which have substantially improved the quality of this manuscript.
Additional information
Funding
REFERENCES
- Abbaspour, K.C., 2007. SWAT-CUP, SWAT calibration and uncertainty programs. Duebendorf, Switzerland: Swiss Federal Institute of Aquatic Science and Technology, Eawag.
- Arnold, J.G., et al., 1998. Large area hydrologic modeling and assessment Part I: model development. Journal of the American Water Resources Association, 34 (1), 73–89. doi:10.1111/j.1752-1688.1998.tb05961.x
- Arnold, J.G., et al., 2000. Regional estimation of base flow and groundwater recharge in the Upper Mississippi River basin. Journal of Hydrology, 227 (1–4), 21–40. doi:10.1016/S0022-1694(99)00139-0
- Bronstert, A., Niehoff, D., and Burger, G., 2002. Effects of climate and land-use change on storm runoff generation: present knowledge and modelling capabilities. Hydrological Processes, 16 (2), 509–529. doi:10.1002/hyp.326
- Chen, H., et al., 2012. Impacts of climate change on the Qingjiang watershed’s runoff change trend in China. Stochastic Environmental Research and Risk Assessment, 26 (6), 847–858. doi:10.1007/s00477-011-0524-2
- Christensen, N.S., et al., 2004. The effects of climate change on the hydrology and water resources of the Colorado River basin. Climatic Change, 62 (1–3), 337–363. doi:10.1023/B:CLIM.0000013684.13621.1f
- Dile, Y.T., Berndtsson, R., and Setegn, S.G., 2013. Hydrological response to climate change for Gilgel Abay River, in the Lake Tana Basin – Upper Blue Nile Basin of Ethiopia. PLoS ONE, 8 (10), e79296. doi:10.1371/journal.pone.0079296
- Ficklin, D.L., Stewart, I.T., and Maurer, E.P., 2012. Projections of 21st century Sierra Nevada local hydrologic flow components using an ensemble of general circulation models. Journal of the American Water Resources Association, 48 (6), 1104–1125. doi:10.1111/j.1752-1688.2012.00675.x
- Fowler, H.J., Blenkinsop, S., and Tebaldi, C., 2007. Linking climate change modelling to impacts studies: recent advances in downscaling techniques for hydrological modelling. International Journal of Climatology, 27 (12), 1547–1578. doi:10.1002/joc.1556
- Guo, S.L., et al., 2002. A macro-scale and semi-distributed monthly water balance model to predict climate change impacts in China. Journal of Hydrology, 268 (1–4), 1–15. doi:10.1016/S0022-1694(02)00075-6
- He, H.M., et al., 2009. Coupling climate change with hydrological dynamic in Qinling Mountains, China. Climatic Change, 94 (3–4), 409–427. doi:10.1007/s10584-008-9527-5
- IPCC, 2007. Climate change 2007: the physical science basis. Contribution of Working Group I to the Fourth Assessment Report of the Intergovernmental Panel on Climate Change. Cambridge: Cambridge University Press.
- Kankam-Yeboah, K., et al., 2013. Impact of climate change on streamflow in selected river basins in Ghana. Hydrological Sciences Journal, 58 (4), 773–788. doi:10.1080/02626667.2013.782101
- Khan, M.S., Coulibaly, P., and Dibike, Y., 2006. Uncertainty analysis of statistical downscaling methods. Journal of Hydrology, 319 (1–4), 357–382. doi:10.1016/j.jhydrol.2005.06.035
- Krause, P., Boyle, D.P., and Bäse, F., 2005. Comparison of different efficiency criteria for hydrological model assessment. Advances in Geosciences, 5, 89–97. doi:10.5194/adgeo-5-89-2005
- Li, Z., et al., 2010. Assessing and regulating the impacts of climate change on water resources in the Heihe watershed on the Loess Plateau of China. Science China – Earth Sciences, 53 (5), 710–720. doi:10.1007/s11430-009-0186-9
- Liu, Z.F., et al., 2010. Impacts of climate change on hydrological processes in the headwater catchment of the Tarim River basin, China. Hydrological Processes, 24 (2), 196–208.
- Liu, Q. and Cui, B.S., 2011. Impacts of climate change/variability on the streamflow in the Yellow River Basin, China. Ecological Modelling, 222 (2), 268–274. doi:10.1016/j.ecolmodel.2009.11.022
- Liu, L.L., et al., 2011. Hydrological impacts of climate change in the Yellow River Basin for the 21st century using hydrological model and statistical downscaling model. Quaternary International, 244 (2), 211–220. doi:10.1016/j.quaint.2010.12.001
- Maalim, F.K. and Melesse, A.M., 2013. Modelling the impacts of subsurface drainage on surface runoff and sediment yield in the Le Sueur Watershed, Minnesota, USA. Hydrological Sciences Journal, 58 (3), 570–586. doi:10.1080/02626667.2013.774088
- Narasimhan, B., et al., 2010. A comprehensive modeling approach for reservoir water quality assessment and management due to point and nonpoint source pollution. Transactions of the ASABE, 53 (5), 1605–1617. doi:10.13031/2013.34908
- Nash, J.E. and Sutcliffe, J.V., 1970. River flow forecasting through conceptual models, part I—a discussion of principles. Journal of Hydrology, 10 (3), 282–290. doi:10.1016/0022-1694(70)90255-6
- Neitsch, S.L., et al., 2005. Soil and water assessment tool theoretical documentation version 2005. Temple, TX: Grassland, Soil and Water Research Laboratory, US Department of Agriculture - Agricultural Research Service, Blackland Research Center, Texas Agricultural Experiment Station.
- Niraula, R., et al., 2013. Identifying critical source areas of nonpoint source pollution with SWAT and GWLF. Ecological Modelling, 268, 123–133. doi:10.1016/j.ecolmodel.2013.08.007
- Raneesh, K.Y. and Santosh, G.T., 2011. A study on the impact of climate change on streamflow at the watershed scale in the humid tropics. Hydrological Sciences Journal, 56 (6), 946–965. doi:10.1080/02626667.2011.595371
- Ringler, C., et al., 2010. Yellow River basin: living with scarcity. Water International, 35 (5), 681–701. doi:10.1080/02508060.2010.509857
- Rostamian, R., et al., 2008. Application of a SWAT model for estimating runoff and sediment in two mountainous basins in central Iran. Hydrological Sciences Journal, 53 (5), 977–988. doi:10.1623/hysj.53.5.977
- Shangguan, Z.P., et al., 2002. A model for regional optimal allocation of irrigation water resources under deficit irrigation and its applications. Agricultural Water Management, 52 (2), 139–154. doi:10.1016/S0378-3774(01)00116-0
- Sridhar, V. and Nayak, A., 2010. Implications of climate-driven variability and trends for the hydrologic assessment of the Reynolds Creek Experimental Watershed, Idaho. Journal of Hydrology, 385 (1–4), 183–202. doi:10.1016/j.jhydrol.2010.02.020
- van Griensven, A. and Meixner, T., 2007. A global and efficient multi-objective auto-calibration and uncertainty estimation method for water quality catchment models. Journal of Hydroinformatics, 9, 277–291. doi:10.2166/hydro.2007.104
- Van Liew, M.W., Arnold, J.G., and Bosch, D.D., 2005. Problems and potential of autocalibrating a hydrologic model. Transactions of the ASAE, 48 (3), 1025–1040. doi:10.13031/2013.18514
- Wang, Z.G., et al., 2012. Impact of climate change on streamflow in the arid Shiyang River basin of northwest China. Hydrological Processes, 26 (18), 2733–2744. doi:10.1002/hyp.8378
- Wang, X., et al., 2011. Estimating non-point source pollutant loads for the large-scale basin of the Yangtze River in China. Environmental Earth Sciences, 63 (5), 1079–1092. doi:10.1007/s12665-010-0783-0
- Wang, Z.Y., Wu, B.S., and Wang, G.Q., 2007. Fluvial processes and morphological response in the Yellow and Weihe Rivers to closure and operation of Sanmenxia Dam. Geomorphology, 91 (1–2), 65–79. doi:10.1016/j.geomorph.2007.01.022
- Wilby, R.L., Dawson, C.W., and Barrow, E.M., 2002. SDSM – a decision support tool for the assessment of regional climate change impacts. Environmental Modelling & Software, 17 (2), 145–157. doi:10.1016/S1364-8152(01)00060-3
- Wilby, R.L., et al., 2006. Integrated modelling of climate change impacts on water resources and quality in a lowland catchment: River Kennet, UK. Journal of Hydrology, 330 (1–2), 204–220. doi:10.1016/j.jhydrol.2006.04.033
- Wood, A.W., et al., 2004. Hydrologic implications of dynamical and statistical approaches to downscaling climate model outputs. Climatic Change, 62 (1–3), 189–216. doi:10.1023/B:CLIM.0000013685.99609.9e
- Xie, X.H. and Cui, Y.L., 2011. Development and test of SWAT for modeling hydrological processes in irrigation districts with paddy rice. Journal of Hydrology, 396 (1–2), 61–71. doi:10.1016/j.jhydrol.2010.10.032
- Xu, C.Y., Widén, E., and Halldin, S., 2005. Modelling hydrological consequences of climate change—progress and challenges. Advances in Atmospheric Sciences, 22 (6), 789–797. doi:10.1007/BF02918679
- Xu, H., Taylor, R.G., and Xu, Y., 2011. Quantifying uncertainty in the impacts of climate change on river discharge in sub-catchments of the Yangtze and Yellow river basins, China. Hydrology and Earth System Sciences, 15 (1), 333–344. doi:10.5194/hess-15-333-2011
- Xu, Y., et al., 2009a. A daily temperature dataset over China and its application in validating a RCM simulation. Advances in Atmospheric Sciences, 26 (4), 763–772. doi:10.1007/s00376-009-9029-z
- Xu, Z.X., et al., 2009b. Assessment of runoff and sediment yield in the Miyun Reservoir catchment by using SWAT model. Hydrological Processes, 23 (25), 3619–3630. doi:10.1002/hyp.7475
- Xu, Z.X., Zhao, F.F., and Li, J.Y., 2009c. Response of streamflow to climate change in the headwater catchment of the Yellow River basin. Quaternary International, 208 (1–2), 62–75. doi:10.1016/j.quaint.2008.09.001
- Yang, J., et al., 2008. Comparing uncertainty analysis techniques for a SWAT application to the Chaohe basin in China. Journal of Hydrology, 358 (1–2), 1–23. doi:10.1016/j.jhydrol.2008.05.012
- Zhang, X.S., Srinivasan, R., and Bosch, D., 2009. Calibration and uncertainty analysis of the SWAT model using Genetic Algorithms and Bayesian Model Averaging. Journal of Hydrology, 374 (3–4), 307–317. doi:10.1016/j.jhydrol.2009.06.023
- Zuo, D.P., et al., 2012. Spatiotemporal variations and abrupt changes of potential evapotranspiration and its sensitivity to key meteorological variables in the Wei River basin, China. Hydrological Processes, 26 (8), 1149–1160. doi:10.1002/hyp.8206