
Abstract
In this study, a hydrological model and spatial technologies have been employed to assess water availability in the Mat River basin, southern Mizoram, India. Furthermore, the results obtained from the SWAT (Soil and Water Assessment Tool) model, satellite data and GIS tools were utilized to identify the hydropower potential in the basin. Thirty three sites with hydropower potential were identified within 147 km2 of the Mat River basin. A total of 3039, 1127 and 805 kW can be harnessed with 50, 75 and 90% dependability, respectively. The study revealed that the hydropower potential of a river basin can be correctly assessed by employing a digital elevation model, stream network data and a hydrological model, such as the SWAT model, within a GIS framework.
Editor D. Koutsoyiannis
Résumé
Dans cette étude, un modèle hydrologique et des technologies spatiales ont été employés pour évaluer la disponibilité de l’eau dans le bassin de la rivière Mat, dans le sud Mizoram, Inde. En outre, les résultats obtenus à partir du modèle SWAT (Soil et Water Assessment Tool), les données satellitaires et des outils de SIG ont été utilisés pour identifier le potentiel hydroélectrique dans le bassin. Trente-trois sites à potentiel hydroélectrique ont été identifiés dans les 147 km2 du bassin de la rivière Mat. Un total de 3039, 1127 et 805 kW peut être exploitée avec respectivement 50, 75 et 90% de fiabilité, L’étude a révélé que le potentiel hydroélectrique du bassin de la rivière peut être correctement évalué en utilisant un modèle numérique de terrain, le réseau hydrographique et un modèle hydrologique, tel que le modèle SWAT, dans un système SIG.
INTRODUCTION
Hydropower has generated considerable interest because it is a renewable source of energy and is a convenient means of providing electricity to far-flung areas in hilly regions. The running costs of hydropower installations are very low compared to thermal or nuclear power stations (Dandekar and Sharma Citation1979), since the fuel (water) is virtually free.
Hydropower projects can be classified in many ways: by size (large, medium, small and mini-scale); by purpose (single or multi-purpose); and by the way incoming river flows are regulated to generate energy. Based on the regulation of river flows, there are two types of projects: run-of-river (ROR) and storage. A ROR project generates electricity from the available flow of the river. To create and harness a high head of water, in many ROR projects, river water is diverted through a tunnel or pipe to the power-house located at a distant lower elevation. Some ROR plants have a small storage pond to generate more energy during the peak hours and increase the benefits of the project. Flows in many rivers vary considerably during a year. In storage-based hydropower projects, a reservoir of water (or potential energy) created behind a dam is used to regulate the inflows and generate energy in accordance with demands. There can be opposition to storage projects from social and environmental groups, due to submergence of forests or places of importance, displacement of population, and adverse impacts on biotic life in rivers. However, ROR projects can generate energy with minimal or negligible damage to the environment, though they also have limited benefits.
Hydropower has immense benefits: generally it is environmentally friendly, cost-effective and, unlike oil and other commodities, independent from international trade. But, despite its many advantages, hydropower development is slow due to many constraints. Construction of a hydropower project requires proper planning and a detailed survey of the topography and flow availability within the watershed. Hydropower development in hilly terrain requires a thorough study of the geology, topography, land-use patterns, availability of resources, infrastructure and socio-economic activities. The feasibility study and baseline survey for hydropower are very difficult, time consuming and costly. Hilly regions with high annual precipitation have potential for hydropower development, but at the same time there are many problems in accessing the remote areas. Further, construction of dams may also lead to displacement of population and submergence of forests and such projects may face opposition.
Correct assessment of hydropower potential at a site requires realistic information on topography (particularly elevation) and flows followed by careful analysis of these data. Recent advances in remote-sensing (RS), geographic information system (GIS) and hydrological modelling provide realistic, up-to-date and useful information for the assessment of hydropower potential. The collection and analysis of accurate information on topography, land-use pattern, river morphology and geology is easier in the GIS environment than by conventional field survey, as GIS can manage all variables with reference to location, and can provide a clear picture about the hydropower project area and its impact zone.
Both GIS and RS techniques have been used in the past for the assessment of hydropower potential: Pokharel (Citation2000) performed spatial analysis using GIS to develop location-specific energy resource and consumption profiles in rural areas of Nepal; Ramachandra and Shruthi (Citation2007) applied GIS to map the renewable energy potential of taluks (sub-district administrative units) in Karnataka State, India; Belmonte et al. (2008) applied GIS in the territorial planning of Lerma Valley (Salta, Argentina) for mapping potential energy resources, taking into account environmental diversity and site conditions (topographic, natural resource, infrastructure and service availability, social and economic); Coskun et al. (Citation2010) determined the hydro-electric water potential of a poorly-gauged basin (Solakli) in the eastern Black Sea region of Turkey using RS and GIS; and Kusre et al. (Citation2010) assessed the hydropower potential of Kopili River basin in Assam, India using GIS and the Soil and Water Assessment Tool (SWAT) model. Ramchandra et al. (Citation2004) developed a spatial decision support system (DSS) for assessing the hydropower potential of micro-, mini-scale and small projects. Dudhani et al. (Citation2006) demonstrated a systematic and comprehensive computational approach to extract information for identification and assessment of water resources and associated sectors, such as habitation and settlement pattern, forest and vegetation coverage, and snow coverage. Subsequently this information was used to select probable sites (in a scientific manner) for small hydropower projects for the Ganga and Alaknanda rivers in India. Das and Paul (Citation2006) used GIS and RS to arrive at alternative sites for hydropower projects and select the technically most suitable site using the SCS curve number method to identify the monthly average runoff. The information, extracted from RS and other sources, can be stored as a georeferenced database in a GIS (Hammouri and El-Naqa Citation2007, Saraf and Kumar Citation2006). A combination of engineering, economic and environmental criteria, as well as social impact, was employed in their study. Yi et al. (Citation2010) demonstrated the criteria and methodology for searching for alternative locations, rather than selecting the most suitable site among the alternatives for the Upper Geum River basin, Korea, and found six potential small hydropower sites. Rojanamon et al. (Citation2009) proposed a new method for selecting feasible sites in the Upper Nan River basin, northern Thailand, for small ROR hydropower projects using GIS technology. Pandey et al. (Citation2011) employed remote sensing and GIS techniques for the identification of suitable sites for soil and water conservation structures for the Karso watershed, Hazaribagh, India.
The SWAT model has been used in numerous evaluation studies: Gassman et al. (Citation2007) and Krysanova and Arnold (Citation2008) have provided reviews of advances in ecohydrological modelling using SWAT; and Williams et al. (Citation2008) discussed the history of SWAT model development at Temple, Texas. Rostamian et al. (Citation2008) employed the SWAT model to estimate runoff and sediment loads in mountainous catchments in Iran; Lévesque et al. (Citation2008) evaluated the daily hydrological behaviour of the SWAT model under snowmelt and rainfall for two small watersheds in southeastern Canada; Schmalz et al. (Citation2008) employed the SWAT model in the Stör, Treene and Kielstau catchments in northern Germany for modelling hydrological processes in mesoscale lowland river basins; and Stehr et al. (Citation2008) carried out hydrological modelling of a Chilean basin using the SWAT model under conditions of limited data availability. Undoubtedly, the combination of GIS and RS techniques provides a powerful tool for studying hydrology in watersheds and also for the assessment of hydropower potential. Therefore, the aim of the present study was to explore the application of the SWAT hydrological model to assess the temporal and spatial variability of hydropower potential in the Mat River basin in India.
STUDY AREA
The source of the Mat River is located at an altitude of 1423 m a.m.s.l. near Baktawng in Aizawl District, Mizoram State, India (). The Mat River catchment lies within longitudes 92°30′–93°00′E and latitudes 22°30′–23°45′N, with a total area of 147 km2. The river is 127 km long; it finally joins the Tuipui River, also known as the Kolodyne River, at the catchment outlet at 497 m a.m.s.l. The river is joined by numerous small streams, locally known as ‘luis’, from the hills on both banks. Mawngping Lui and Mangang Lui are the main tributaries, joining the Mat River from the right and left banks, respectively. The Mat is a perennial river and is flashy and effluent; it provides an important natural resource for the economic development of the people of this region. The Mat River has so far remained untapped for any kind of hydropower and irrigation use.
Fig. 1 Location map of the study area.
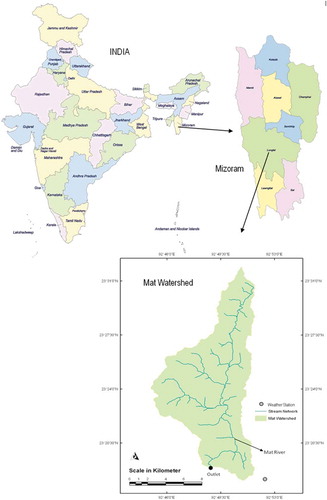
Rainfall in Mizoram State varies from 2000 to 4200 mm/year, with about 78% of the annual rainfall occurring during the monsoon season (May–September). The monthly temperatures vary from 8°C (minimum) to 32°C (maximum), and the relative humidity in monsoon months is in the range 79–94%.
METHODOLOGY
The hydraulic head and the availability of flow are the two major components of hydropower generation. The assessment of head, site selection and simulation of flow at each selected site was carried out using the Arc-SWAT model. The SWAT model generates stream network characteristics, the length of the river, and elevation difference for each stream within the watershed boundary. The model has provision for addition or deletion of outlets and inlets by user intervention, which affects the delineation and number of sub-watersheds created by the model, and this facility was utilized in assessing the head variation along the river, by placing sub-basin outlets at different locations.
Assessment of hydraulic head
To assess potential hydraulic head along the river, computations were started at the main outlet of the watershed and then proceeded in the upstream direction. A location is identified as a potential hydropower site when a head of 20 m or more is available in a stream and the distance between the current location and the site immediately downstream exceeds 500 m (Kusre et al. Citation2010). A low-head hydropower application uses river current or tidal flows falling through 20 m or less to produce energy. This is to ensure that the tail race of the upstream site is not influenced by the reservoir of the downstream site. The assessment for the next potential site is carried out from the last selected site and the process continues to the upstream end of the river. In this study, only the potential ROR sites where power could be generated without constructing a reservoir were identified. Run-of-river schemes do not require a dam or storage facility to be constructed; instead, they divert water from the stream or river, channel it into a valley and then into a turbine via a pipeline called a penstock. Such ROR schemes can generate power for use in homes, hospitals, schools and workshops, providing an environmentally friendly way of harnessing energy from the falling water of steep mountain rivers such as the Mats. Small hydropower schemes such as these do not cause damage to the environment, can make a sustainable contribution to the electricity crisis and help the economic development of hilly states like Mizoram in India.
A hydropower plant without pondage has no storage and is, therefore, subject to seasonal river flows and serves as a peaking power plant, whereas a plant with pondage can regulate water flow and serve either as a peaking plant or base-load power plant. Therefore, it is important to be able to estimate river flow.
Estimation of flow
The Arc-SWAT ArcGIS extension is a graphical user interface for the SWAT model (Arnold et al. Citation1998). The SWAT model is a river basin or watershed-scale model developed to predict the impact of land management practices on water, sediment and agricultural chemical yields in watersheds with varying soils, land use and management conditions over long periods of time. The SWAT model is physically based and computationally efficient, uses readily available inputs and enables users to study long-term impacts.
To simulate discharge from the Arc-SWAT model, spatial inputs relating to the DEM, land-use/land cover map and soil map are required for the study watershed. Other inputs required for the model are long-term weather data and soil properties.
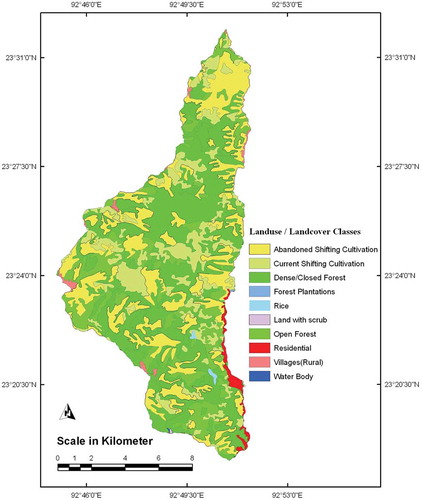
A 10-m resolution DEM and the land-use map for the area were supplied by the Mizoram Remote Sensing Application Centre and are presented in and , respectively. Forest area covers more than 50% of the Mat watershed, with dense/close and open forest types. As the Jhumming (slash-and-burn) system of cultivation is practiced in the region, considerable damage is caused to the watershed ecosystem. A soil map at 1:250 000 scale prepared by the Agricultural Department, Government of Mizoram was available for the study watershed and was used as model input after digitization. The SWAT model also requires long-term weather data (rainfall, temperature, humidity, solar radiation and wind velocity) of some representative weather stations located in the vicinity of the study watershed and these were obtained from two weather stations set up by the Department of Agriculture (Government of Mizoram) and Mizoram Science Centre to measure rainfall and temperature. Altogether 14 parameters concerning physical properties of soils of the study watershed are required as model input. These properties are specific to each category of soil. Eight parameters, namely number of soil layers, maximum rooting depth, depth of soil layer, organic carbon content, clay content, silt content, sand content and rock fragment content, were obtained from the Agricultural Department, Government of Mizoram. In addition, the model requires data regarding porosity fraction, moist bulk density, available water capacity, saturated hydraulic conductivity and soil erodibility which was obtained from the same source. Finally, the soils were regrouped into Hydrologic Soil Groups C and D: Group C soils are of moderately high runoff potential comprise shallow soils containing considerable clay and colloids, although less than Group D. Group C soils have below-average infiltration (1–4 mm/h) after pre-saturation and, in general, a slow rate of water transmission. The soils of Group D have the highest runoff potential and include mostly clays, with nearly impermeable sub-horizons near the surface and an average infiltration rate of 0–1 mm/h (SCS Citation1972).
Fig. 2 Digital elevation model of the Mat watershed.
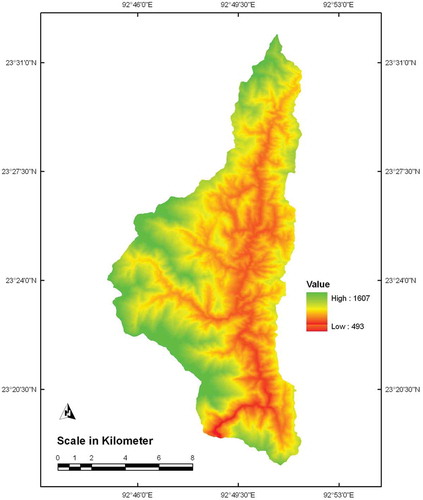
Fig. 3 Land-use/land cover map of the Mat watershed.
The observed discharge data were obtained from the local office of the Central Water Commission in Mizoram. The data of one gauging station, comprising discharge data for three years (10 measurements on a daily basis), were available for the study area. Discharge data recorded during 1988, 1991 and 1994 at the watershed outlet were used for evaluation of the SWAT model. Due to its completeness and consistency, the 1988 discharge dataset was used for calibration, and 1991 and 1994 datasets were used for validation purposes.
Criteria for identification of sites
For selection of the potential sites for a hydropower project, the following criteria were adopted:
Availability of flow
The availability of adequate flow is to be ensured:
by considering only streams that have flow accumulation of 12 000 cells or more, as ascertained from the flow accumulation map; and
as two second-order streams join to become a third-order stream, this will have sufficient runoff for installation of a powerhouse; thus the flow accumulation map was examined along with the digitized drainage map to make sure that only streams of third-order or more are considered.
Site spacing
The minimum distance between two consecutive sites should not be less than 500 m (Kusre et al. Citation2010). This will ensure that there is sufficient gap between the tailrace of one site and the diversion arrangement of the next, so that the river ecosystem will have sufficient opportunity to rejuvenate. This will also ensure that the tailrace of the upstream site is not influenced by the reservoir/pondage of the downstream site.
The maximum distance of river considered to find the head should not be more than 3000 m.
Head availability
The head availability is assessed starting from the main outlet of the watershed.
A project should have at least 20 m of head.
If the 500 m criterion is not satisfied, the hydraulic head is repeatedly raised until the interval constraint is met. However, in this study other criteria such as access to sites for construction, demand and ability to pay for power were not considered.
Estimation of hydropower potential
The amount of power generated when a discharge Q is allowed to fall through a head difference of H is given by:
where P is power, ρ is the density of water (1000 kg/m3), g is the gravity acceleration (9.81 m/s2) and η is the overall efficiency of the turbine or generator. The amount of power generated will increase with the increase in Q and H. Only theoretical power is estimated in this study.
Selection of potential hydropower sites
The stream network generated by the SWAT model using a 10-m DEM and threshold value of 12 000 closely follows the stream network extracted from the topographic map. The smaller the threshold value, the more detailed is the stream network generated by the SWAT interface. The model generates the stream network giving details of stream length and elevation difference for every stream in the watershed. By default the model generates sub-basins for every stream and a sub-basin outlet at each confluence point.
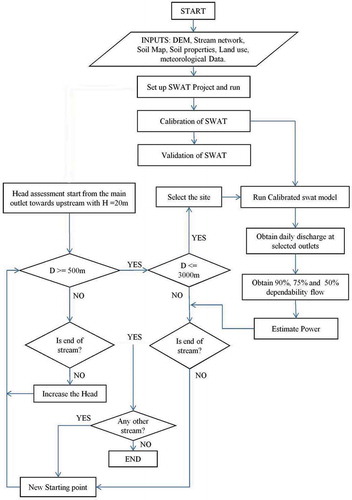
With information on each stream, their lengths, and elevation difference, the sub-basin outlets were edited (added or deleted) to assess river bed elevation; once the outlets are added to the stream network the model calculates the stream length and elevation difference for each sub-basin using the input DEM. The methodology for assessment of potential hydropower sites using the SWAT model is presented in .
Fig. 4 Methodology for assessment of potential hydropower sites using the SWAT model.
Model calibration and validation
Model calibration is the adjustment of model parameters within a recommended range so that the model output matches the observed data as closely as possible. The calibration tool of Arc-SWAT enables adjustment of different parameters through user intervention. These parameters can be adjusted manually or automatically. The calibrated parameters of the SWAT model are presented in . In this study, the discharge data for 1988 were used for manual calibration of the model. Six parameters of the SWAT model were manually adjusted and, after each change, simulated flow was compared with the observed flow.
Table 1 Parameters of the SWAT model used for calibration for the Mat watershed.
Validation is the process of determining the degree to which a model or simulation is a correct representation of the observed behaviour from the perspective of the intended uses. The values of simulated discharge at a specified location are compared with the observed discharge for validation of the model (Gassman et. al. Citation2007). The calibrated SWAT model was validated using discharge data for 1991 and 1994.
The model performance was evaluated from a comparison of simulated and observed discharge data in terms of mean, standard deviation, maximum daily discharge and total discharge using commonly-used indices (Krause et al. Citation2005, Gassman et al. Citation2007). Four statistical indices were used to evaluate model performance, as follows.
Coefficient of determination, R2 (Willmott Citation1981, Leagates and McCabe Citation1999):
Nash-Sutcliffe coefficient, ENS (Nash and Sutcliffe Citation1970):
Index of agreement, d (Willmott Citation1981):
Relative error, RE:
where Qmod is the model simulated discharge, Qobs is observed discharge, and n is the number of data being considered. The range of RE is –1 to ∞, where zero is the perfect match; the closer RE is to 0, the more acceptable is the model prediction.
RESULTS AND DISCUSSION
Calibration and validation of SWAT for the Mat catchment
shows the observed and computed discharge for the calibration (1988) and validation (1991 and 1994) periods of the SWAT model. For 1988, there was a close match between the observed and computed discharges, as demonstrated by a high value of coefficient of R2 (0.91). During the year, the model slightly under-predicted the discharge during the monsoon (), and the flow in September was not properly modelled. The scatter plot obtained by plotting the simulated and observed values of discharge () shows that the points are evenly distributed about the 1:1 line.
Fig. 5 Observed and simulated discharge for calibration (1988) and validation (1991 and 1994) of the SWAT model.
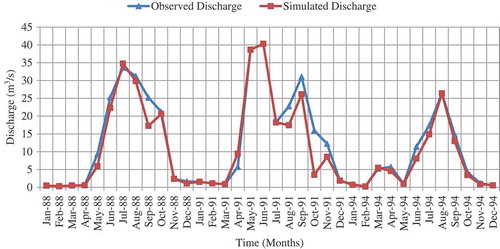
Fig. 6 Comparison between simulated and observed discharge for all years (1988, 1991 and 1994).
For statistical evaluation of the model calibration/validation, the values of the indices are given in . A high value of ENS (0.903) shows that there is a good agreement between the simulated and observed discharge during the calibration period. The under- or over-prediction limits for the model simulation are within ±20% from the measured values and are considered acceptable levels of accuracy for the simulations (Bingner et al. Citation1989).
Table 2 Statistical analysis of simulated and observed 10-day discharge (m3/s) for model calibration and validation. SD: standard deviation.
Comparison of discharges for 1991 and 1994
For 1991, the simulated discharge () closely matches the observed discharge for the first half of the year. During the monsoon, the model slightly under-predicts the flow, except for the month of October, when the under-prediction is quite high. However, during the dry season the computed discharge closely matches the observed discharge.
The performance of the model was checked by statistical analysis (): the values of ENS (0.72), R2 (0.73) and d (0.92) indicate that there is a reasonable agreement between the observed and simulated discharge. Moderate overall deviation of 17.31% between simulated and observed values supports the satisfactory performance of the model for 1991.
For 1994, the simulated discharge provides a good match to the observed values (). Reasonably high ENS (0.89) and R2 (0.88) indicate that there is a very good agreement between the observed and simulated discharge (). A reasonably low value of percent deviation (9.6) indicates that the overall predicted discharge by the SWAT model is well within the acceptable limit (Bingner et al. Citation1989).
Combined statistics for all years
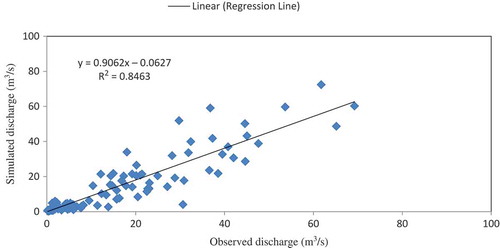
The overall performance of the SWAT model was judged by statistical analysis of the discharge data for years 1988, 1991 and 1994 (). In the scatter plot, the points are nearly evenly distributed across the 1:1 line with slightly more points below the line indicating a small under-prediction of runoff for the Mat watershed (). High values of R2 (0.85) ENS (0.84) indicate a close relationship between the observed and modelled discharge, while low percent deviation (9.93) indicates that the overall predicted discharge by the model is well within the acceptable limit. A close match between the mean and standard deviation (SD) of the observed and simulated data shows that the statistical behaviour of the two is similar.
Table 3 Statistical analysis of simulated and observed 10-day discharge (m3/s) for the combined period, dry period and rainy period for the years 1988, 1991 and 1994.
Performance of the model during dry period
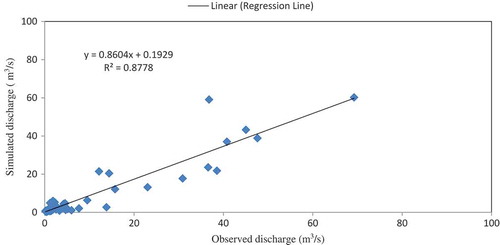
The dry season flow of perennial rivers is most important for water availability of a river system: in the dry season, water availability in the river will be at a minimum, so dry season analysis is important for the design and operation of hydropower projects. Hence, the performance of the model was evaluated for dry period data and the results are presented in . In , a few more points are located below the 1:1 line, indicating slight under-prediction of runoff by the SWAT model in the dry season (). High values of R2 (0.877) ENS (0.897) indicate very good agreement between the observed and simulated discharge, while low percent deviation (10.631) indicates that the overall predicted discharge by the model is well within the acceptable limit. The results clearly show that model performance is good during the dry period.
Fig. 7 Comparison between simulated and observed discharge for the dry period.
Performance of the model during monsoon period
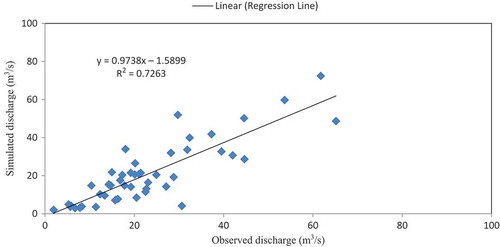
The model performance was also evaluated for the monsoon season (). The scatter plots shows that the points are fairly evenly located around the 1:1 line (). A high value of ENS (0.769) indicates that there is a reasonably good agreement between the observed and simulated discharge, and low percent deviation (9.569) indicates that the overall predicted discharge by the model is well within the acceptable limit (Bingner et al. Citation1989).
Fig. 8 Comparison between simulated and observed discharge for the rainy period.
Sensitivity analysis
Sensitivity analysis is carried out to examine the relative changes in the model output with respect to changes in model input variables. From the sensitivity analysis, it is possible to determine which variables need to be precisely estimated to make an accurate prediction of watershed yields. Sensitivity analysis provides a method for examining the response of a model in a way that eliminates the influence of errors related to the natural variation of the model input parameters (McCuen and Snyder Citation1983).
For sensitivity analysis, the calibrated value of each parameter was selected as the base value, and this base value was increased or decreased by a certain percentage (+10%, +20%, +25%, +50%, –10%, –20%, –25%, –50%). The following parameters were considered for sensitivity analysis: available water capacity of soil layer (Sol_Awc), threshold depth of water in shallow aquifer required for return flow to occur (Gwqmn), soil evaporation compensation factor (Esco), baseflow recession alpha (Alpha_Bf), threshold depth of water in shallow aquifer for percolation to the deep aquifer to occur (Revapmn), and Manning’s coefficient n for channel (Ch_N2).
The SWAT parameters with the ranges considered for sensitivity analysis are presented in . It is noted that Esco (the soil evaporation compensation factor) is the most sensitive parameter, and the two least sensitive parameters are Ch_N2 (Manning’s n) and Alpha_Bf (baseflow recession alpha). The analysis reveals that the Esco parameter is sensitive to runoff and ranges between 1.16 and 4.67%. The Sol_Awc parameter (available water capacity of soil layer) is also very sensitive to runoff and ranges between 0.14 and 1.51%; the Gwqmn has a sensitivity of 0.008–0.426%, and the Revapmn has a sensitivity of 0.016–0.104%.
Table 4 Sensitivity analysis of calibrated parameters of SWAT model.
Identification of potential sites and estimation of hydropower potential
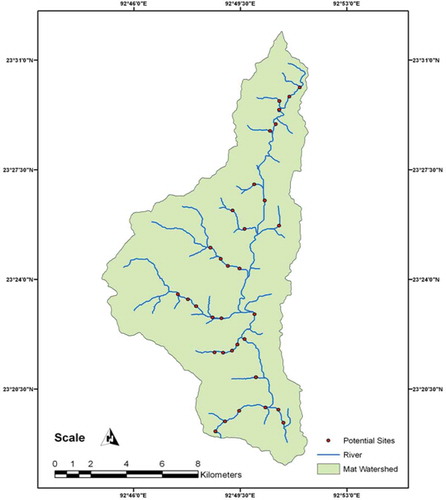
A 10-m DEM was used to identify potential sites in the Mat River basin. A site is identified as a potential site when a head of 20 m or more is available in the stream, with a separation of at least 500 m between two sites. The assessment for the next potential site is carried out from the last selected site and the process continued until the stream end; thus 33 potential sites were identified in the Mat watershed and their locations along with the stream network are presented in . It needs to be highlighted that, as well as hydrological, many other criteria (e.g. geological suitability, vicinity to important places) have to be met to finalize the site of hydropower projects. The methodology presented here is a systematic way to identify potential sites from a hydrological angle and these sites could be further examined using other criteria to arrive at a different list. An optimization study could also be carried out by varying the norm for the head (20 m in the present case) and spacing (500 m) to develop an optimal basin development plan.
Fig. 9 Selected hydropower potential sites in the Mat watershed.
In India, the flow for a 90% dependable year (the year when flow has a 90% probability of exceedence) is used in the design of hydropower projects. The SWAT model was used to generate the flow for 10 years from 1988 to 1997 (). The runoff was simulated for the main watershed outlet to identify the 90% dependable year, which was calculated by rearranging the annual runoff data in descending order and applying the Weibull formula (MNRE Citation2008). This ensures that enough flow is available 90% of the time for hydropower generation.
Table 5 Calculation of discharge (m3/s) for 90% dependable years in the Mat watershed.
Once the 90% dependable year is found, the flow is generated separately for each selected potential site in the 90% dependable year. This makes it possible to have a more realistic knowledge of the potential flow, as both spatial and temporal changes in catchment features and inputs are taken into consideration by the model.
The hydropower generation was estimated considering three levels of dependability, 90%, 75% and 50% (MNRE Citation2008), resulting in a total hydropower generation capacity of 3039, 1127 and 805 kW, respectively.
CONCLUSIONS
A methodology has been proposed for the identification of potential hydropower sites using a distributed hydrological model (SWAT). Calibration and validation of the SWAT model for the Mat River basin have shown that the model is able to give realistic output for assessment of hydropower potential by generating flow at selected potential sites. The study area has only one river gauging site, which is a hindrance in correctly assessing hydropower potential of the catchment. A well-calibrated distributed model can be used to assess the flows at various locations in the catchment. The results of the sensitivity analysis reveal that the important parameters of the SWAT model in respect of their sensitivity for the Mat watershed are: (a) the soil evaporation compensation factor (Esco); (b) the available water capacity of the soil layer (Sol_Awc); (c) the threshold depth of water in the shallow aquifer for percolation to the deep aquifer to occur (Revapmn); (d) the threshold depth of water in the shallow aquifer required for return flow to occur (Gwqmn); (e) Manning’s n for the channel (Ch_N2); and (f) the baseflow recession alpha (Alpha_Bf). Thirty three potential hydropower sites were identified within the 147-km2 Mat watershed, from which a total of 3039, 1127 and 804 kW of hydropower could be harnessed, with 50%, 75% and 90% dependability, respectively. Run-of-river (ROR) hydropower plants, utilizing instantaneous river flow and having no pondage at the upstream headworks, were suggested for the study area. When the analysis is performed using a GIS, the potential hydropower sites and the hydropower potential can be effectively assessed and presented. Further analysis to determine the suitability of the identified sites can be carried out by using the GIS database. Such information can be used to develop an optimal river basin plan for hydropower generation.
Disclosure statement
No potential conflict of interest was reported by the author(s).
REFERENCES
- Arnold, J.G., et al., 1998. Large area hydrologic modeling and assessment, part I: model development. Journal of the American Water Resources Association, 34 (1), 73–89. doi:10.1111/j.1752-1688.1998.tb05961.x
- Belmonte, S., et al., 2009. Potential renewable energy resources of the Lerma Valley, Salta, Argentina for its strategic territorial planning. Renewable and Sustainable Energy Reviews, 13, 1475–1484. doi:10.1016/j.rser.2008.09.014
- Bingner, R.L., Murphree, C.E., and Mutchler, C.K., 1989. Comparison of sediment yield models on watersheds in Mississippi. Transactions of the ASAE, 32 (2), 529–534. doi:10.13031/2013.31035
- Coskun, H.G., et al., 2010. Remote sensing and GIS innovation with hydrologic modelling for Hydroelectric Power Plant (HPP) in poorly gauged basins. Water Resource Management. doi:10.1007/s11269-010-9632-x
- Dandekar, M.M. and Sharma, K.N., 1979. Water power engineering. New Delhi: Vikas Publishing House Pvt. Ltd. ISBN 0706986369. Reprinted in 2013
- Das, S. and Paul, P.K., 2006. Selection of site for small hydel using GIS in the Himalayan region of India. Journal of Spatial Hydrology, 6 (1), 18–28.
- Dudhani, S., Sinha, A.K., and Inamdar, S.S., 2006. Assessment of small hydropower potential using remote sensing data for sustainable development in India. Energy Policy, 34, 3195–3205. doi:10.1016/j.enpol.2005.06.011
- Gassman, P.W., et al., 2007. The soil and water assessment tool: historical development, applications, and future research directions. Transactions of the ASABE, 50 (4), 1211–1250. doi:10.13031/2013.23637
- Hammouri, N. and El-Naqa, A., 2007. Hydrological modeling of ungauged wadis in arid environments using GIS: a case study of Wadi Madoneh in Jordan. Revista Mexicana de Ciencias Geológicas, 24 (2), 185–193.
- Krause, P., Boyle, D.P., and Bäse, F., 2005. Comparison of different efficiency criteria for hydrological model assessment. Advances in Geosciences, 5, 89–97. doi:10.5194/adgeo-5-89-2005
- Krysanova, V. and Arnold, J.G., 2008. Advances in ecohydrological modelling with SWAT—a review. Hydrological Sciences Journal, 53 (5), 939–947. doi:10.1623/hysj.53.5.939
- Kusre, B.C., et al., 2010. Assessment of hydropower potential using GIS and hydrological modeling technique in Kopili River basin in Assam (India). Applied Energy, 87, 298–309. doi:10.1016/j.apenergy.2009.07.019
- Legates, D.R. and McCabe, G.J., 1999. Evaluating the use of goodness-of-fit measures in hydrologic and hydroclimatic model validation. Water Resources Research, 35 (1), 233–241. doi:10.1029/1998WR900018
- Lévesque, É., et al., 2008. Evaluation of streamflow simulation by SWAT model for two small watersheds under snowmelt and rainfall. Hydrological Sciences Journal, 53 (5), 961–976. doi:10.1623/hysj.53.5.961
- McCuen, M.A. and Snyder, W.M., 1983. Hydrologic modeling: statistical methods and applications. Englewood Cliffs, NJ: Prentice-Hall.
- MNRE (Ministry of New and Renewable Energy), 2008. Government of India standards/manuals/Guidelines for small hydro development: manual on project Hydrology and installed capacity. Available from: http://www.iitr.ac.in/PageUploads/files/2_3_GUIDELINES_FOR_STRUCTURAL_DESIGN_OF_SHP_PROJECTS.pdf [Accessed 1 June 2010].
- Nash, J.E. and Sutcliffe, J.V., 1970. River flow forecasting through conceptual models part I—A discussion of principles. Journal of Hydrology, 10 (3), 282–290. doi:10.1016/0022-1694(70)90255-6
- Pandey, A., et al., 2011. Application of remote sensing and GIS for identification of suitable sites for soil and water conservation structures. Land Degradation & Development, 22 (3), 359–372. doi:10.1002/ldr.1012
- Pokharel, S., 2000. Spatial analysis of rural energy system. International Journal of Geographical Information Science, 14 (8), 855–873. doi:10.1080/136588100750022822
- Ramachandra, T.V., et al., 2004. Spatial decision support system for assessing micro, mini and small hydel potential. Journal of Applied Sciences, 4 (4), 596–604. doi:10.3923/jas.2004.596.604
- Ramachandra, T.V. and Shruthi, B.V., 2007. Spatial mapping of renewable energy potential. Renewable and Sustainable Energy Reviews, 11, 1460–1480. doi:10.1016/j.rser.2005.12.002
- Rojanamon, P., Chaisomphob, T., and Bureekul, T., 2009. Application of geographical information system to site selection of small run-of-river hydropower project by considering engineering/economic/environmental criteria and social impact. Renewable and Sustainable Energy Reviews, 13, 2336–2348. doi:10.1016/j.rser.2009.07.003
- Rostamian, R., et al., 2008. Application of a SWAT model for estimating runoff and sediment in two mountainous basins in central Iran. Hydrological Sciences Journal, 53 (5), 977–988. doi:10.1623/hysj.53.5.977
- Saraf, A.K. and Kumar, A., 2006. Spatial technologies in Himalayan small hydropower development. In: International Himalayan small hydropower Summit, 12–13 October 2006, Dehradun, India.
- Schmalz, B., Tavares, F., and Fohrer, N., 2008. Modelling hydrological processes in mesoscale lowland river basins with SWAT—capabilities and challenges. Hydrological Sciences Journal, 53 (5), 989–1000. doi:10.1623/hysj.53.5.989
- SCS (Soil Conservation Service), 1972. National engineering handbook, Section 4, Hydrology. Washington, DC: US Department of Agriculture.
- Stehr, A., et al., 2008. Hydrological modelling with SWAT under conditions of limited data availability: evaluation of results from a Chilean case study. Hydrological Sciences Journal, 53 (5), 588–601. doi:10.1623/hysj.53.3.588
- Williams, J.R., et al., 2008. History of model development at Temple, Texas. Hydrological Sciences Journal, 53 (5), 948–960. doi:10.1623/hysj.53.5.948
- Willmott, C.J., 1981. On the validation of models. Physical Geography, 2, 184–194.
- Yi, C.-S., Lee, J.-H., and Shim, M.-P., 2010. Site location analysis for small hydropower using geo-spatial information system. Renewable Energy, 35, 852–861. doi:10.1016/j.renene.2009.08.003