
Abstract
This study analysed 130-year-long river flow and 58-year-long meteorological records, the volume capacity of reservoirs and water consumption records over the last 60 years of the Changjiang (Yangtze River) basin. The results show that there are strong periodicities in the river discharge at seasonal, and at 3-, 7-, 11- and 14.6-year cycles. The results also show that the river discharge has decreased noticeably, and the discrepancy between flood and dry-season flows has also decreased in the last 130 years. However, the basin-wide water discharge also showed spatial and temporal variability. In the 70-year period prior to 1949, the water discharge in the middle and lower reaches of the Changjiang did not show declining trends. Between 1949 and 2011, the water discharge in the upper and middle reaches of the river showed apparent decreasing trends. Yet, because of the modulation by large lakes in the middle reaches, the water discharge to the sea did not show any noticeable changes. The primary causes of the changes in water discharge in the Changjiang basin were basin-wide dam construction and water consumption. Therefore, a regulated index (RI) is proposed to quantify human activities in the river basin. Based on RI, the Changjiang basin was weakly regulated between 1950 and 1980, intermediately regulated between 1980 and 2010, and is highly regulated at present. This is expected to worsen by 2030.
Résumé
Cette étude analyse 130 ans de débits et 58 ans d’enregistrements météorologiques, le volume des réservoirs et les consommations d’eau au cours des 60 dernières années dans le bassin du Changjiang (Yangtsé). Les résultats montrent que le débit de la rivière présente de fortes périodicités saisonnières, et selon des cycles de 3, 7, 11 et 14,6 années. Les résultats montrent également qu’au cours des 130 dernières années le débit a sensiblement diminué, ainsi que l’écart entre les débits de crue et de saison sèche. Le débit présente également une variabilité spatiale et temporelle à l’échelle du bassin. Dans la période de 70 ans précédant 1949, le débit des cours moyen et inférieur du Changjiang n’a pas montré de tendance à la baisse. Entre 1949 et 2011, le débit dans les cours supérieur et moyen du fleuve a montré une tendance à la baisse. Cependant, en raison de la modulation par les grands lacs sur le cours moyen, le débit atteignant la mer n’a pas montré de changements notables. Les principales causes de changement des débits dans le bassin du Changjiang ont été la construction de barrages et le prélèvement d’eau dans l’ensemble du bassin. Par conséquent, nous proposons un indice d’impact (II) afin de quantifier les activités humaines dans le bassin. Sur la base de cet indice, le bassin du Changjiang a été faiblement impacté entre 1950 et 1980, moyennement impacté entre 1980 et 2010, et est très fortement impacté à l’heure actuelle. La situation devrait empirer à l’horizon 2030.
1 INTRODUCTION
Since the Industrial Revolution in the 18th century, human activities such as dam construction, flow diversion and unregulated agricultural and domestic consumption have deeply affected the natural behaviour of rivers (Nilsson et al. Citation2005, Steffen et al. Citation2007, Lin and Wei Citation2008, Brázdil et al. Citation2011, Genz and Luz Citation2012). In the course of global climate change and human interference, many major rivers have shown declining runoff (Walling and Fang Citation2003). The world faces severe challenges of water shortage and, consequently, enormous environmental dilemmas (Wiegel Citation1996, Vörösmarty et al. Citation2010, Estrela et al. Citation2012). For example, the declining river flow in the Colorado River, USA, induced the transformation of a deltaic basin from an estuarine setting to a hypersaline and inverse-estuarine environment in the northern Gulf of California (Kowalewski et al. Citation2000, Carriquiry et al. Citation2001, Mujumdar Citation2013). The declining discharge of the Huanghe (Yellow River) in China has affected the economy of its delta region and the ecology of the adjacent seas (Cu Citation2002). Furthermore, the reduced runoff also reduced the sediment supply, which leads to coastal erosion in many river dispersal systems (Jay and Simenstad Citation1996, Wiegel Citation1996, Guillén and Palanques Citation1997, Milliman and Farnsworth Citation2011, Yang et al. Citation2011). Therefore, understanding the variability, trends, and degree of human interference and regulation of the river flow is crucial for understanding of the behaviour of the river as a dispersal system and the management of its ecological environment and water resources.
The Changjiang (Yangtze) is the largest river on the Eurasian continent, and its water discharge is ranked the third largest in the world (Nilsson et al. Citation2005). The river is divided into upper, middle and lower reaches at Yichang, Hukou and Datong, respectively (). The Changjiang basin is 1.8 × 10⁶ km2 in area, and has 440 million inhabitants (Yang et al. Citation2005). The river is 6400 km long, and has a mean yearly water discharge of 895 × 109 m3 (1950–2011), mean yearly sediment load of 414 × 106 t, and the mean suspended sediment content of 0.461 kg/m3 (1950–2005). The Changjiang basin has become the most developed and populated region of China. The demand for water is ever increasing and the outlook on reaching sustainable water resources is bleak.
Fig. 1 (a) map of China showing the Changjiang basin and locations where water diversions occur; (b) enlarged map of the Changjiang basin showing locations where data are acquired.
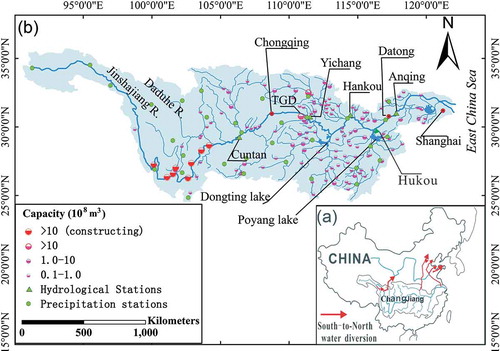
In addition to the well-known Three Gorges Dam (TGD), a series of dams is being constructed in the upper and middle reaches (). The expected capacity of these new reservoirs will exceed 60 × 109 m3 (PRCHR Citation2004). There is also heavy pumping in the delta region. All types of water usage are noticeably increasing (Dai et al. Citation2010). To make it worse, a huge South-to-North (S-N) water diversion project is underway to alleviate the water shortage in northern China (), which is expected to divert 44.8 × 10⁹ m3 of Changjiang water to the north (Chen et al. Citation2001).
There is no doubt that new trends in Changjiang river flow will emerge. Past Changjiang research has focused on the sediment load exported to the sea (Yang et al. Citation2011, Dai et al. Citation2011a, Citation2011b, Dai et al. Citation2013); the variability of runoff in the past 50 years and under extreme drought conditions (Dai et al. Citation2008); impacts of dams on Changjiang runoff (Zhang et al. Citation2012, Dai et al. Citation2013); and the relationship between precipitation, river flow and associated links to atmospheric circulations (Zhang et al. Citation2005, Xu et al. Citation2008a, Citation2008b, Citation2010, Zhang et al. Citation2011, Guo et al. Citation2012). Little attention has been given to river-wide catchment dynamics on the spatial variability of river flow and human interferences. Furthermore, there have been no studies of Changjiang water discharge at the centennial scale, with little attention paid to human interference and regulation of the water discharge. Therefore, this study systematically examines the trends and variability in water discharge of the Changjiang in the past 130 years, as a result of the combined influences of climate (precipitation, air temperature), damming, water consumption and water diversion projects. The ultimate goal is to characterize the human interferences and degree of regulation on the hydrological behaviour of the third largest river in the world.
2 MATERIAL AND METHODS
2.1 Data collection
This study collected river flow records for four reference gauging stations along the main course of the Changjiang (data provided by the Changjiang Hydrology Committee, www.cjh.com.cn). These are located at Cuntan (controlling basin area 0.86 × 10⁶ km2), Yichang (1.1 × 10⁶ km2), Hankou (1.48 × 10⁶ km2) and Datong (1.71 × 10⁶ km2). The latter three stations represent the lower end of the upper reaches, the middle part of the middle reaches, and the middle part of the lower reaches of the river, respectively (). The type, frequency and duration of the record at each station are tabulated in . We also collected monthly mean temperature data between 1952 and 2010 at Yichang, Hankou and Anqing, and precipitation records at 33 stations of the Changjiang catchment (). Meteorological data were obtained from the Weather Information Centre, Weather Bureau of China. Additionally, the capacity of all reservoirs since the 1950s, and water usage in the period 1980–2010 throughout the entire Changjiang basin, were included in this study ().
Table 1 Related data specifications.
2.2 Methods
We needed to reconstruct missing monthly runoff data at the Datong station for the period 1880–1949 without any precipitation measurements. Linear regression is a useful tool to reconstruct missing data points in a record. Based on the linear relationship between the synoptic river flows at Datong and Hankou in the period 1950–2011 (), the original record length at Datong (1950–2011) was extrapolated to include the period 1880–1949 (). This enabled the long-term water discharge to be evaluated at the decadal scale. Compared to the exponential regression method, linear regression is more straightforward and applicable (Yang et al. Citation2010). The results of our linear regression all achieved the threshold for statistical significance (p < 0.001), and R greater than 0.8, and can therefore be considered robust and reliable. We then proceeded to reconstruct the missing runoff data between 1880 and 1949 (). Subsequently, the wavelet technique (Morlet et al. Citation1982, Torrence and Compo Citation1998, Sang Citation2013) was used to analyse the periodicities in the monthly flow data for the period 1880–2011 at the four reference gauging stations (each has 1584 data points).
Some studies use models based on the rainfall-runoff relationship to analyse and predict changes in river runoff (Niehoff et al. Citation2002, Bronstert Citation2004). Here, we used a simple scheme to analyse the relationship between river runoff and precipitation. We first obtain the annual average precipitation within the sub-basin at each reference gauging station, Yichang, Hankou, and Datong. Then, the yearly sub-basin-wide precipitation was linearly regressed against the yearly runoff at four reference gauging stations to obtain the linear model between the two variables.
To examine the long-term trends, the running-mean method was applied to the yearly mean records for the period 1880–2011 at Cuntan, Yichang, Hankou, and Datong, with a window width of 14 years to remove the influences of El Niño and La Niña (Hossain et al. Citation2010). The Mann-Kendall method (Mann Citation1945, Kendall Citation1975, Memarian et al. Citation2012) was also used to analyse the trend in river flows of flood and dry seasons, precipitation, and temperature at the different stations and corresponding catchments. These methods are frequently encountered in hydroclimatic time series analyses with the calculation procedure explained in Smith (Citation2000) and Xu et al. (Citation2010). Assuming a normal distribution at the significance level of p = 0.05, a positive Mann-Kendall statistic Z > 1.96 indicates a statistically significant increasing trend; while a negative Z < –1.96 represents a statistically significant decreasing trend. Meanwhile, in order to diagnose the abrupt changes in river flow records, the Mann-Kendall abrupt change test was performed following the procedures described by Gerstengarbe and Werner (Citation1999). Here UF is the statistic calculated with the progressive series, and UB is calculated with the retrograde series. The intersection point of the two series between the significance level thresholds of ±1.96 (p < 0.05) indicates the time that abrupt change takes place (Gerstengarbe and Werner Citation1999).
Moreover, based on the idea of Nilsson et al. (Citation2005), a regulation index (RI) is devised:
where, in a given year, i, Capacity is the reservoir capacity; Consump is the total water consumed, i.e. water that is not returned to river flow and is therefore consumed, generally about 45% (CSRWRB Citation2008–2010); SN diverision is the loss to the S-N water diversion and MeanDischarge is the multiple-year mean water discharge for the period 1950–2011. When the values of RI fall into the ranges 0–0.25, 0.25–0.5, 0.5–0.75 and 0.75–1.0, the degree of regulation is defined, respectively, as slightly affected, moderately affected, strongly affected and regulated. The percentage of river runoff of total reservoir capacity and total water used was also calculated.
3 RESULTS
3.1 Changes in temperature and precipitation
Temperature records at all stations between 2001 and 2010 showed a noticeable increase compared to those in the 1950s. The rise of annual mean temperature at Yichang was 0.78°C, at Hankou 0.77°C and at Anqin 0.77°C. At these three stations, the increasing trends in atmospheric temperature at annual, flood season and dry season time scales are all statistically significant, reaching p = 0.001, based on the Mann-Kendall trend analysis (). These trends are consistent with the global pattern (Hansen et al. 2006). The temperature trend over the entire Changjiang catchment showed similar changes (Zhang et al. Citation2005).
Table 2 Mann-Kendall trend analyses of runoff, precipitation and temperature over different periods at different control stations.
In contrast, the Mann-Kendall trend analysis results on precipitation in the period 1956–2010 showed no statistically significant trends (Z score between –1.14 and 1.90, p > 0.01), while trends were found at Yichang, Hankou and Datong for the dry and flood seasons and for the entire year. The results corroborate, to some extent, the findings of Zhang et al. (Citation2005), based on 51 raingauges in the Changjiang basin ().
3.2 Periodicities in Changjiang water discharge
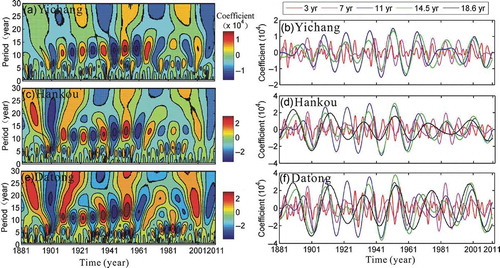
There is a close relationship between Hankou and Datong monthly discharge records (), which was the basis for the reconstruction of monthly water discharge in the period 1880–1949 at Datong (). Furthermore, the results of the wavelet analysis of monthly flow records show that there are common spectral characteristics at Yichang, Hankou and Datong in the period 1880–2011 ((a)–(f)). All three stations have seasonal flood and dry cycles and periodicities at 3, 7, 11, 14.5 and 18.6 years (except for Yichang) ((b), (d) and (f)). This suggests that the hydrological behaviour of the main course of the Changjiang is coherent except at the 18.6-year cycle in the upper reaches. Furthermore, the high values correspond to the historical floods in 1905, 1931, 1954 and 1998, and droughts in 1900, 1940, 1960, 1968, 1978 and 2006 (), (), and ()). These periodicities indicate that, historically (in the past 130 years), the flow patterns of the Changjiang have always been oscillating. At present, the Changjiang is in a period of low flow.
Fig. 2 Plots of monthly discharge at Hankou versus corresponding discharge at Datong for the period of 1950–2011.
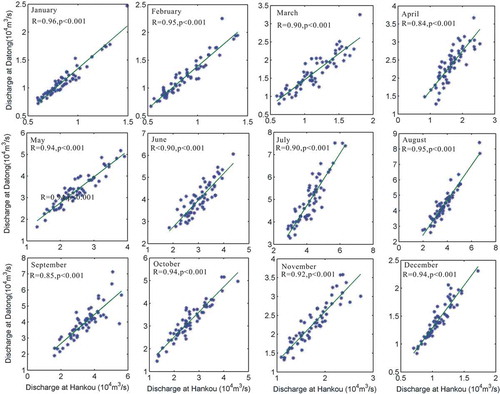
Fig. 3 Reconstructed monthly discharge at Datong.
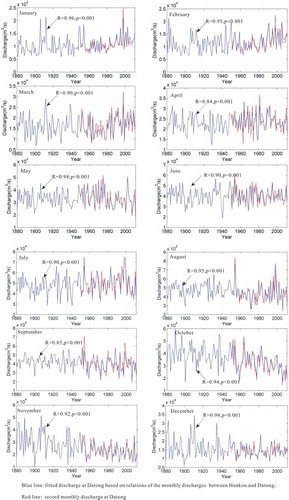
Fig. 4 Runoff characteristics along the Changjiang based on wavelet analysis: (a), (c), (d) contoured coefficient, and (b), (d), (f) time series of periods extracted from corresponding contours at Yichang, Hankou and Datong, respectively.
3.3 Trends in water discharge variability
In river catchment analysis it is important to distinguish between the annual mean flow, mean flow of the flood season and the mean flow of the dry season, all of which reflect the variability of the river hydrology. The Mann-Kendall statistics of the three mean flow values at Yichang, Hankou and Datong are shown in . These numbers indicate that, since 1880, the reduction trends in the annual mean and in the means of the flood and dry seasons are all significant (p < 0.001). In the period 1880–1949, at Cuntan the Z score is less than–2.04 (p = 0.05), meaning that the annual flow decreased significantly. However, at Yichang, Hankou and Datong, the Z scores were between –1.40 and 0.83 (not statistically significant), which means no trend was apparent in the annual mean flow records at these stations. However, the flow in the dry season at these three stations did show statistically significant (p < 0.001) decreasing trends, despite the absence of decreasing trends in the flood season ().
Since 1950, the flood-season flow records at the three gauging stations have shown decreasing trends and the flow in the dry season increasing trends, suggesting de-coupled flood-dry seasonality in the water discharge. In the period 1950–2011, the river flow showed a significant decrease only at Cuntan and Yichang. Decreasing trends also appeared in records at Hankou and Datong, but these were not statistically significant.
Furthermore, the anomaly and the maximum/minimum river flow ratio have been decreasing at the three stations (). These trends also correspond to decreasing trends in the smoothed river flows after the 14-year running mean averaging (). It is clear that in the past 130 years the river flows at the three stations have been decreasing ( (a), (c) and (e)). In the meantime, the degree of fluctuation in the river flow has also been decreasing ( (b), (d) and (e)). This suggests that the naturally fluctuating river runoff is being ‘constrained’ in such a way that there were no droughts in the dry season and no floods in the wet season in 2006 (Dai et al. Citation2008). It is even more evident that the yearly water discharge at the three stations has drastically dropped since 2000 compared to the mean yearly water discharge between 1880 and 2010. Additionally, the abrupt tests on the runoff showed that abrupt changes took place simultaneously around 2000 at Yichang, Hankou and Datong (). At Yichang, more abrupt changes occurred in the period between 1970 and 1990. In the 1950s, abrupt changes occurred at Hankou and Datong.
Fig. 5 (a), (c), (e) The annual water discharge anomaly and (b), (d), (f) ratio of maximum/ minimum discharges at Cuntan, Yichang and Datong, respectively. The dashed (blue) line represents the linear regression trend; the solid (red) curve is the 14-year running mean.
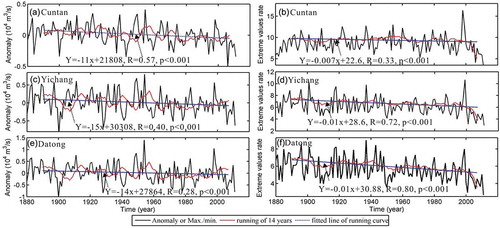
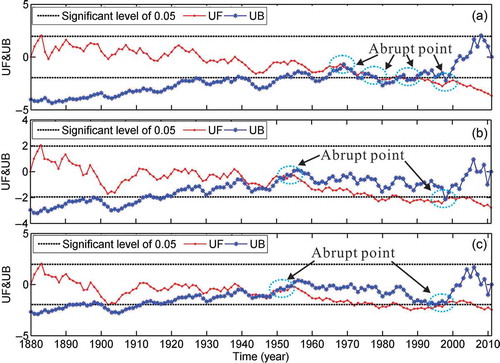
Fig. 6 Abrupt changes in annual mean discharge at (a) Yichang, (b) Hankou and (c) Datong calculated by Mann-Kendall abrupt change test. UF is the statistic calculated with the progressive series, and UB is calculated with the retrograde series. The intersection point of the two series between the significance level thresholds of ±1.96 (p < 0.05) indicates the time that abrupt change takes place.
When the multi-year mean river flows are compared, the water discharge decrease per century at Cuntan was 34 × 109 m3, which is equivalent to a 10% reduction. At Yichang it was 36 × 109 m3, or 7% reduction, at Hankou it was 51 × 109 m3, or 8% reduction, and at Datong it was 51 × 109 m3, or 6% reduction ().
Fig. 7 Mean decadal river discharge at Cuntan, Yichang, Hankou and Datong between 1880 and 2009. The diagonal (green) line indicates linear regression at each station (p = 0.05) with slopes of –3.4 × 10⁹ at Cuntan; –3.6 × 10⁹ at Yichang; –5.1 × 10⁹ at Hankou; and –5.1 × 10⁹ at Datong. The horizontal (red) line indicates annual mean discharge for the period 1880–2009 with values of 352 × 109 m3 at Cuntan; 439 × 109 m3 at Yichang; 732 × 109 m3 at Hankou; and 919 × 109 m3 at Datong.
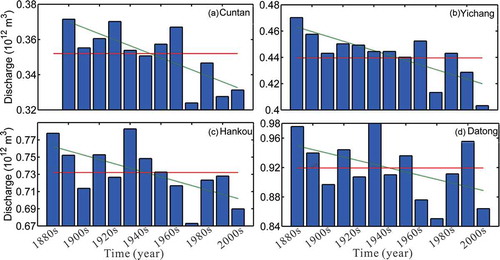
Fig. 8 Temporal relationship between precipitation in the sub-basin and river runoff at controlling stations: (a) Yichang; (b) Hankou; and (c) Datong.
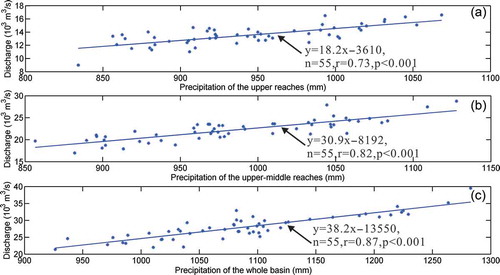
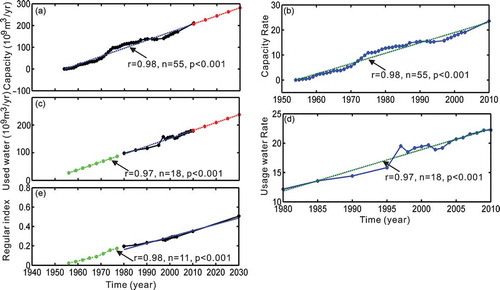
Fig. 9 Human impacts on the Changjiang basin showing: (a) changes in reservoir capacity in Changjiang basin (black dots: observations, red dots projected values based on linear regression); (b) percentage equivalent of the total reservoir capacity of runoff at Datong; (c) changes in water consumption in the Changjiang basin (black dots: observations, green and red dots: extrapolated values based on linear regression); (d) percentage equivalent of the total water consumption to river runoff at Datong; (e) changes in the RI values between 1956–1979 (green); 1980–2010 (black), 2011–2030 (blue, projected based on the linear regression of the green and black values).
4 DISCUSSION
4.1 Natural influences
Using power spectral analysis Shen et al. (Citation2000) identified periodicities of 2–3 and 7 years in the river flow record at Datong from 1946 to 1989. More recently, Yang et al. (Citation2010) identified periodicities of 7, 14 and 38 years in the record from 1865 to 2006. Since the wavelet analysis technique is better at resolving the time-varying spectra in hydrological time series data, it was applied to our river flow records from 1880 to 2011 at Datong, Yichang and Hankou, which has not been done before ((b), (d) and (f)).
The different periodicities in water discharge are most likely related to the fluctuations of intra-annual monsoon influences, related to the 2–7-year cycle of the El Niño and La Niña; the 9–11-year cycle of sun spot activity; and the 18.6-year cycle of the eccentricity of the Earth’s orbit around the Sun (Sun and Yang Citation1992, Zhang et al. Citation2005, Tong et al. Citation2006, Xu et al. Citation2008b, Wang et al. Citation2000).
The entire Changjiang basin is under the influence of the Asian monsoons (in the Indian and Pacific Oceans) that greatly control the regional precipitation pattern. The precipitation, in turn, dictates surface runoff and river water discharge (Zhang et al. Citation2005, Wei et al. Citation2013). In our study, we used a simple linear regression model to show the close precipitation–runoff relationship at the three reference stations (). The results show statistically significant correlation between precipitation in the sub-basins and the corresponding runoff in the upper, middle and lower reaches of Changjiang, which highly suggests that precipitation is the dominant controlling factor on river runoff.
However, the Mann-Kendall trend analysis shows no significant trends in mean, dry season and flood season precipitation between 1956 and 2010, which corroborates with previous results in the Changjiang basin (Zhang et al. Citation2005). Recently, Xu et al. (Citation2010) analysed the precipitation time series of the Changjiang basin over the last 50 years and found little change. Despite the lack of precipitation trends, there were noticeable trends of runoff reduction in the annual mean and flood seasons, in the upper and lower reaches of Changjiang River between 1950 and 2010. Conversely, the runoff in the dry seasons for the entire basin showed increasing trends. The disparity between the flood and dry season trends indicates other factors, such as human interference.
In the past 30 years, global temperature has risen by approx. 0.2°C (Hansen et al. Citation2006). The temperature over the Changjiang basin has shown similar changes (Zhang et al. Citation2005). The annual temperature and the temperature in the dry and flood seasons all show statistically significant increases. Due to the effect of the ‘pan evaporation paradox’ (Brutsaert and Parlange Citation1998) and of urbanization in China (Zhang et al. Citation2011), as the temperature increased, the net solar radiation and wind speed decreased, leading to a decrease in evaporation (Wang et al. Citation2005, Liu et al. Citation2011). However, the decreased evaporation did not cause river discharge to increase in the Changjiang.
4.2 Human influences
Although there is a connection between long-term trends in precipitation and evaporation and river water discharge in the Changjiang basin (Wang et al. Citation2000), human influence might be a major factor. Human activities in the Changjiang basin include damming, river water diversions, and domestic, agricultural and industrial water consumption. Based on the records of 1865–2004 and 1865–2006 from Datong, Yang et al. (Citation2005, Citation2010) found that dam construction caused long-term decreasing trends in river flow. Moreover, dammed reservoirs are mainly located in the upper and middle reaches of the Changjiang basin, whose total capacity has risen between 1954 and 2010. However, there was a relatively rapid increase in reservoir capacity between 1970 and 1990, with reservoir volume increasing by 100 × 109 m3 ((a). Another peak period of dam construction came after 2000.
The years of abrupt changes in the Changjiang basin based on the Mann-Kendall test () coincided with the times of impoundment and storage release by the Three Gorges Dam (TGD). This points to the influence of the TGD on the variability of river flow. Between 1970–1999, a series of dams (reservoirs) were built in the upper reaches of the river, causing the abrupt changes observed at Yichang ().
The impoundment of TGD began in 2003. In 2010, the TGD became fully operational retaining 39.3 × 10⁹ m3 of water. In the next 15 years, new reservoirs added an additional capacity of 60 × 109 m3. By 2030, the projected reservoir capacity will reach 300 × 109 m3 (PRCHR Citation2004), which will be equivalent to 34% of the annual water discharge measured at Datong (the average water discharge in the period 1950–2011 was 895 × 109 m3). The reservoirs will mainly affect the upper and middle reaches of the river basin ((a)). As the reservoir capacity increased, the proportion of runoff compared to the runoff measured at Datong also increased from less than 5% in 1970 to over 20% in 2010 ((b)).
These reservoirs retain the river discharge in the flood seasons and release part of the storage in the dry seasons (Chen et al. Citation2001), which would undoubtedly modulate the intra-annual variability in river flow. However, the modulation of the Poyang and Dongting Lakes on Changjiang river flow also buffers the impact of dams in the upper reaches (Dai et al. Citation2010). Therefore, the changes in the long-term trend of Changjiang water discharge into the estuary are not obvious, when compared to those in the upper and middle reaches ().
The rapid and huge economic development in the Changjiang basin has led to an increase in water usage of 100 × 109 m3/year between 1980 and 2010 ((c)). The total usage was equivalent to 15% of the runoff in 1990, and in 2010 it was close to 25% ((d)).
By 2030, the projected basin-wide annual water usage will be 260 × 109 m3/year ((c)), which would be about 29% of the water discharge. The S-N Water Diversion Projects would reach 36.8 × 10⁹ m3/year by 2030 (http://news.xinhuanet.com/ziliao/2002-12/27/content_672194.htm), which is another drain on water discharge. Therefore, human activities will greatly affect the hydrological behaviour of the entire Changjiang basin.
4.3 Degree of interference and regulation
The long-term trend in water discharge is decreasing and yet human interference is on the rise. To solve the conflict between demand and supply, it is urgent that we understand and quantify the degree of human regulation on the river water discharge.
Before the 1980s, the Changjiang was slightly affected by human activities (RI < 0.25). The post-1980 era marked the beginning of modernization and development in China, which caused the RI value to increase to the moderately affected category (0.25–0.5) from 1980–2010 ((e)). The projected RI values for 2010–2030 were based on linear regression of the historical RIs up to 2010 (green and black dots in (e)), which predict that the level of human activity in the Changjiang basin will gradually increase. The projected RI will be 0.52 in 2030, which suggests that human interference on the hydraulic behaviour of Changjiang will increase from moderately affected in 2010 to strongly affected in 2030.
5 CONCLUSIONS
Most rivers in the world have been subject to human interference and regulation, to a varying degree. Global warming and human activities pose two major threats to sustainable global water resources. Our study is the first to systematically show and quantify the degree of regulation as a result of human interference in the Changjiang basin and the historical progression of this process. Our findings show that:
There are periodicities at intra-seasonal, and 3, 7, 14.5-year cycles in the water discharge records along the upper, middle, and lower reaches of the Changjiang.
Even though in the past 130 years, the water discharge in the Changjiang basin showed decreasing trends, there was noticeable basin-wide spatial and temporal variability. In the 70 years prior to 1949, the water discharge in the middle and lower reaches of the basin did not show any noticeable decrease. In 1949–2011, a clear decrease in water discharge appeared in the upper and middle reaches of the basin. Yet, the total water discharge to the sea showed no obvious change.
The contrast in the river flow between dry and flood seasons is decreasing, which is mainly affected by the basin-wide damming, water diversions, and water consumptions.
There are three stages of the human interference between 1950 and 2030. Changjiang was slightly affected from 1950–1980; moderately affected between 1980 and 2010; while at present, the level of human interference is rapidly rising. By 2030, human influence on the hydrological behaviour of the Changjiang is expected to be severe.
Disclosure statement
No potential conflict of interest was reported by the author(s).
Acknowledgements
Associate Editor Q. Zhang, and S.L. Yang, and an anonymous reviewer are thanked for their comments to improve the manuscript. We would like to thank the Weather Information Centre, Weather Bureau of China for providing the necessary data for analyses in this paper.
Additional information
Funding
REFERENCES
- Brázdil, R., et al., 2011. Fluctuations of floods of the River Morava (Czech Republic) in the 1691–2009 period: interactions of natural and anthropogenic factors. Hydrological Sciences Journal, 56 (3), 468–485. doi:10.1080/02626667.2011.564175
- Bronstert, A., 2004. Rainfall-runoff modelling for assessing impacts of climate and land-use change. Hydrological Processes, 18, 567–570. doi:10.1002/hyp.5500
- Brutsaert, W. and Parlange, M.B., 1998. Hydrologic cycle explains the evaporation paradox. Nature, 396, 30. doi:10.1038/23845
- Carriquiry, J.D., Sánchez, A., and Camacho-Ibar, V.F., 2001. Sedimentation in the northern Gulf of California after cessation of the Colorado River discharge. Sedimentary Geology, 144 (1–2), 37–62. doi:10.1016/S0037-0738(01)00134-8
- Chen, X., et al., 2001. Human impacts on the Changjiang (Yangtze) River basin, China, with special reference to the impacts on the dry season water discharges into the sea. Geomorphology, 41, 111–123. doi:10.1016/S0169-555X(01)00109-X
- CSRWRB (Changjiang and Southwest Rivers water Resources Bulletin), 2008–2010. Wuhan: Changjiang Press.
- Cu, S.Q., 2002. Influence of water discharge cut-off of Huanghe on environment of its Delta. Marine Science, 26 (7), 42–46. ( In Chinese with an English abstract.)
- Dai, Z.J., et al., 2008. Runoff characteristics of the Changjiang River during 2006: effect of extreme drought and the impounding of the Three Gorges Dam. Geophysical Research Letters, doi:10.1029/2008GL033456
- Dai, Z.J., et al., 2010. Assessment of extreme drought and human interference on baseflow of the Yangtze River. Hydrological Processes, 24, 749–757. doi:10.1002/hyp.7505
- Dai, Z.J., et al., 2011a. Variation of Riverine Material Loads and Environmental Consequences on the Changjiang (Yangtze) Estuary in Recent Decades (1955−2008). Environmental Science and Technology, 45, 223–227. doi:10.1021/es103026a
- Dai, Z.J., et al., 2011b. Is the Three Gorges Dam the cause behind the extremely low suspended sediment discharge into the Yangtze (Changjiang) Estuary of 2006? Hydrological Sciences Journal, 56 (7), 1280–1288. doi:10.1080/02626667.2011.585136
- Dai, Z.J. and Liu, J.T., 2013. Impacts of large dams on downstream fluvial sedimentation: An example of the Three Gorges Dam (TGD) on the Changjiang (Yangtze River). Journal of Hydrology, 480, 10–18. doi:10.1016/j.jhydrol.2012.12.003
- Estrela, T., Pérez-Martin, M.A., and Vargas, E., 2012. Impacts of climate change on water resources in Spain. Hydrological Sciences Journal, 57 (6), 1154–1167. doi:10.1080/02626667.2012.702213
- Genz, F. and Luz, L.D., 2012. Distinguishing the effects of climate on discharge in a tropical river highly impacted by large dams. Hydrological Sciences Journal, 57 (5), 1020–1034. doi:10.1080/02626667.2012.690880
- Gerstengarbe, F.W. and Werner, P.C., 1999. Estimation of the beginning and end of recurrent events within a climate regime. Climate Research, 11, 97–107. doi:10.3354/cr011097
- Guillén, J. and Palanques, A., 1997. A historical perspective of the morphological evolution in the lower Ebro river. Environmental Geology, 30, 174–180. doi:10.1007/s002540050144
- Guo, H., et al., 2012. Effects of the Three Gorges dam on Yangtze river flow and river interaction with Poyang Lake, China: 2003–2008. Journal of Hydrology, 416–417, 19–27. doi:10.1016/j.jhydrol.2011.11.027
- Hansen, J.M., et al., 2006. Global temperature change. Proceedings of the National Academy of Sciences, 103, 14288–14293. doi:10.1073/pnas.0606291103
- Hossain, F., Jeyachandran, I., and Pielke, Sr. R., 2010. Dam safety effects due to human alteration of extreme precipitation. Water Resources Research, 46, W03301. doi:10.1029/2009WR007704
- Jay, D.A. and Simenstad, C.A., 1996. Downstream effects of water withdrawal in a small, high-gradient basin: erosion and deposition on the Skokomish River Delta. Estuaries, 19 (3), 501–516. doi:10.2307/1352513
- Kendall, M.G., 1975. Rank correlation measures. London: Charles Griffin.
- Kowalewski, M., et al., 2000. Dead delta’s former productivity: two trillion shells at the mouth of the Colorado River. Geology, 28 (12), 1059–1062. doi:10.1130/0091-7613(2000)28<1059:DDFPTT>2.0.CO;2
- Lin, Y. and Wei, X.H., 2008. The impact of large-scale forest harvesting on hydrology in the Willow watershed of Central British Columbia. Journal of Hydrology, 359 (1–2), 141–149. doi:10.1016/j.jhydrol.2008.06.023
- Liu, X.M., et al., 2011. Recent changes in pan-evaporation dynamics in China. Geophysical Research Letters, 38, L13404. doi:10.1029/2011GL047929
- Mann, H.B., 1945. Non-parametric tests against trend. Econometrica, 13, 245–259. doi:10.2307/1907187
- Memarian, H., et al., 2012. Trend analysis of water discharge and sediment load during the past three decades of development in the Langat basin, Malaysia. Hydrological Sciences Journal, 57 (6), 1207–1222. doi:10.1080/02626667.2012.695073
- Milliman, J.D. and Farnsworth, K.L., 2011. River discharge to the coastal ocean – a global synthesis. Cambridge: Cambridge University Press.
- Morlet, J., et al., 1982. Wave propagation and sampling theory-part 2: sampling theory and complex waves. Geophysics, 47 (2), 222–236.
- Mujumdar, P.P., 2013. Climate change: a growing challenge for water management in developing countries. Water Resources Management, 27, 953–954. doi:10.1007/s11269-012-0223-x
- Niehoff, D., Fritsch, U., and Bronstert, A., 2002. Land-use impacts on storm-runoff generation: scenarios of land-use change and simulation of hydrological response in a meso-scale catchment in SW-Germany. Journal of Hydrology, 267 (1–2), 80–93. doi:10.1016/S0022-1694(02)00142-7
- Nilsson, C., et al., 2005. Fragmentation and flow regulation of the world’s large river systems. Science, 308, 405–408. doi:10.1126/science.1107887
- PRCHR, 2004. The People’s Republic of China hydraulic re-investigations report (PRCHR). Beijing: Chinese Electrical Power Press.
- Sang, Y.F., 2013. Improved wavelet modeling framework for hydrologic time series forecasting. Water Resources Management, 27, 2807–2821. doi:10.1007/s11269-013-0316-1
- Shen, H.T., Wang, X., and Yang, Q.S., 2000. The spectrum analysis of discharge and salinity in the Changjiang estuary. Acta Oceanlology Sinica, 22 (4), 17–23. (In Chinese with English abstract.)
- Smith, L.C., 2000. Trends in Russian Arctic river-ice formation and breakup, 1917 to 1994. Physical Geography, 20 (1), 46–56.
- Steffen, W., Crutzen, P.J., and McNeill, J.R., 2007. The Anthropocene: are humans now overwhelming the great forces of nature. AMBIO: A Journal of the Human Environment, 36 (8), 614–621. doi:10.1579/0044-7447(2007)36[614:TAAHNO]2.0.CO;2
- Sun, C.A. and Yang, B.Y., 1992. The solar activity and the regularities of droughts and water loggings in the middle and lower reaches of the Yangtze River. Acta Astronomica Sinica, 33 (2), 179–185.
- Tong, J., et al., 2006. Yangtze floods and droughts (China) and teleconnections with ENSO activities (1470–2003). Quaternary International, 144 (1), 29–37. doi:10.1016/j.quaint.2005.05.010
- Torrence, C. and Compo, G.P., 1998. A practical guide to wavelet analysis. Bulletin of the American Meteorological Society, 79, 61–78. doi:10.1175/1520-0477(1998)079<0061:APGTWA>2.0.CO;2
- Vörösmarty, C.J., et al., 2010. Global threats to human water security and river biodiversity. Nature, doi:10.1038/nature09440
- Walling, D.E. and Fang, D., 2003. Recent trends in the suspended sediment loads of the world’s rivers. Global and Planetary Change, 39, 111–126. doi:10.1016/S0921-8181(03)00020-1
- Wang, S.W., et al., 2000. Seasonal precipitation series of eastern China since 1880 and the variability. Acta Geographica Sinica, 55 (3), 281–293. ( In Chinese with English abstract.)
- Wang, Y.J., Jiang, T., and Xu, C.Y., 2005. Observed trends of Pan evaporation and its impact factors over the Yangtze River basin between 1961 and 2000. Journal of Natural Resources, 20 (6), 864–870. ( In Chinese with English abstract.)
- Wei, W., Chang, Y.P., and Dai, Z.J., 2013. Streamflow changes of the Changjiang (Yangtze) River in the recent 60 years: impacts of the East Asian summer monsoon, ENSO, and human activities. Quaternary International, doi:10.1016/j.quaint2013.10.064
- Wiegel, R.L., 1996. Nile delta erosion. Science, 272, 338–340.
- Xu, J.J., et al., 2008a. Spatial and temporal variation of runoff in the Yangtze River basin during the past 40 years. Quaternary International, 186, 32–42. doi:10.1016/j.quaint.2007.10.014
- Xu, K.H., et al., 2008b. Climatic and anthropogenic impacts on the water and sediment discharge from the Yangtze River (Changjiang), 1950–2005. In: A. Gupta, ed. Large rivers: geomorphology and management. Hoboken, NJ: John Wiley, 609–626.
- Xu, K.H., Milliman, J.D., and Xu, H., 2010. Temporal trend of precipitation and runoff in major Chinese Rivers since 1951. Global and Planetary Change, 73, 219–232. doi:10.1016/j.gloplacha.2010.07.002
- Yang, S.L., et al., 2005. Trends in annual discharge from the Yangtze River to the sea (1865–2004). Hydrological Sciences-Journal-des Sciences Hydrologiques, 50 (5), 825–836.
- Yang, S.L., et al., 2010. Temporal variations in water resources in the Yangtze River (Changjiang) over the Industrial Period based on reconstruction of missing monthly discharges. Water Resources Research, 46, W10516. doi:10.1029/2009WR008589
- Yang, S.L., et al., 2011. 50,000 dams later: erosion of the Yangtze River and its delta. Global and Planetary Change, 75, 14–20. doi:10.1016/j.gloplacha.2010.09.006
- Zhang, Q., et al., 2005. Precipitation, temperature and discharge analysis from 1951 to 2002 in the Yangtze River Basin, China. Hydrological Sciences Journal, 50 (1), 65–80.
- Zhang, Q., et al., 2012. The influence of dam and lakes on the Yangtze River streamflow: long-range correlation and complexity analyses. Hydrological Processes, 26, 436–444. doi:10.1002/hyp.8148
- Zhang, Q., Xu, C.Y., and Chen, X.H., 2011. Reference evapotranspiration changes in China: natural processes or human influences? Theoretical and Applied Climatology, 103, 479–488. doi:10.1007/s00704-010-0315-6