
Abstract
A long-term dataset of reported flooding based on reports from the UK Met Office and the UK Centre for Ecology and Hydrology is described. This is possibly a unique dataset as the authors are unaware of any other 100+ year records of flood events and their consequences on a national scale. Flood events are classified by severity based upon qualitative descriptions. There is an increase in the number of reported flood events over time associated with an increased exposure to flooding as floodplain areas were developed. The data was de-trended for exposure, using population and dwelling house data. The adjusted record shows no trend in reported flooding over time, but there is significant decade to decade variability. This study opens a new approach to considering flood occurrence over a long time scale using reported information (and thus likely effects on society) rather than just considering trends in extreme hydrological conditions.
Editor Z.W. Kundzewicz Associate editor Not assigned
Introduction
Flooding has always been a feature in the British Isles and a number of major flood events in the 20th/21st century have caused significant damage and sometimes significant loss of life. They have also left an important legacy in how we manage flooding. The 1947, 1953, 1998/2000 and 2007 floods are examples, with the winter 2013/14 floods also likely to leave an important mark. Recently, the connection between flooding and climate change has been raised both in the UK (e.g. Wilby et al. Citation2008) and more widely (IPCC Citation2012, Jongman et al. Citation2012), and a linkage between climate change and flooding is often mentioned in the media. This raises questions about both historic trends and future prognosis of damaging floods. Growth in exposure to flooding is a major driver of flood risk (Evans et al. Citation2004, Merz et al. Citation2010, IPCC Citation2012) and hence increasing flood consequences may not be linked to just changes in hydrological regime. Detecting and understanding trends in flood consequences and all the relevant drivers is important, as this informs decision makers how best to allocate scarce resources for flood management (Pielke Jr Citation2000).
In this paper, we describe the historic trends in flooding in the UK by analysing a national dataset of over 125 years of reported flood events. This dataset is based on reporting systems that describe damaging terrestrial and tidal floods. National population and housing data are also considered to scale reported flooding by exposure. These datasets provide an unusual and possibly unique opportunity to evaluate any changes in the occurrence of damaging floods.
Flooding is often analysed using the Source-Pathway-Receptor-Consequence (SPRC) model (Thorne et al. Citation2007, FloodSite Citation2009, Narayan et al. Citation2014). Most historic studies focus on trends in flood sources, be it high river flows, extreme sea-level events and coastal storms (e.g. Robson et al. Citation1998, Haigh et al. Citation2010, Menéndez and Woodworth Citation2010, Marsh and Harvey Citation2012, Murphy et al. Citation2013, Wilby and Quinn Citation2013). Anticipated climate change suggests that in many areas of Europe summers are likely to be drier, but winters may be wetter, with a potential for a greater frequency of fluvial winter floods (Hulme et al. Citation2002, IPCC Citation2007). Coastal areas are likely to be more vulnerable than inland areas due to changes in sea level, wave heights and accelerated erosion (Zsamboky et al. Citation2011). However, an analysis in trends in consequences also needs to consider changes to the pathways and receptors. Changes in pathways may include degradation of natural protection, but they also include the provision of new and upgraded flood defences and other improvements in flood management over time. It is recognized that many flood defences have improved substantially over the last 100 years, as exemplified by London’s flood defences, including the Thames Barrier. This has reduced flood consequences over time. In contrast, the number of receptors in the flood plain has increased significantly due to population growth and an increase in the number of buildings. This increases the potential consequences of a flood event (Evans et al. Citation2004, Hooijer et al. Citation2004).
Flood events have typically been evaluated using river flow data and the analysis of the frequency of peak flows (Robson et al. Citation1998, Robson Citation2002, Macdonald Citation2006, Petrow and Merz Citation2009, Delgado et al. Citation2010, Macdonald et al. Citation2010, Kjeldsen et al. Citation2012, Marsh and Harvey Citation2012). Long flow series are rare, with few records extending over 70 years (Macdonald and Black Citation2010). In the UK only the Thames and the Lee have flow records longer than 100 years (CEH Citation2013). There is much more data available for the last 50 years. For example, Petrow and Merz (Citation2009) evaluated flow data for 145 sites in Germany between 1951 and 2002. Some studies have supplemented the hydrometric flow data with historical sources such as flood marks and descriptions (Macdonald Citation2006), documentary records (Macdonald and Black Citation2010), or palaeoflood hydrology such as geological records (Costa Citation1986). More local studies into the frequency and distribution of coastal flooding have used extreme sea-level data combined with local records (newspaper reports) to judge when tidal floods have occurred and consider their consequences (Ruocco et al. Citation2011).
Evaluations of trends in flood sources suggest there is variation spatially (IPCC Citation2007, Citation2013). Barredo (Citation2009) assessed European flood losses in 31 countries between 1970 and 2006. The study shows no evidence of any trend in normalized flood losses. Delgado et al. (Citation2010) found an increasing likelihood of extreme events in the Mekong River, whilst the probability of an “average flood” has decreased. Significant trends (both positive and negative) have been detected in a “considerable fraction” of basins in Germany (Petrow and Merz Citation2009). There is high year-to-year climate-led variation in the UK, with no significant long-term trends in flood frequency (Robson et al. Citation1998, Macdonald Citation2006, Marsh and Harvey Citation2012). There is evidence for a shorter-term (40–50 year) trend in the UK (Robson Citation2002) and significant trends were found in the UK in recent decades (Kjeldsen et al. Citation2012). Hannaford and Marsh (Citation2008) found significant positive trends in the frequency and magnitude of flood events in ‘relatively undisturbed’ catchments in the UK in the last four decades of the 20th century. However, differing methodologies and the time scale of these studies make them difficult to compare with climate change scenarios that typically consider time scales of 30–100 years (Hulme et al. Citation2002, IPCC Citation2007, Ramsbottom et al. Citation2012).
Whilst historic sources can be used to extend records, these are not always consistent or reliable. Robson et al. (Citation1998) state that long datasets are needed to identify trends, yet older data can be ‘sketchy’. For instance, in European studies it was found that minor flood events were reported more widely in recent times (Barredo Citation2009). Journalistic evidence of flooding, however, may suffer from its ephemeral nature and potential lack of scientific rationale. It is clear that a trade-off exists between increasing the length of record with multiple data sources and maintaining consistency and quality of the record.
This paper develops and analyses a dataset of reported flood events covering the whole of the UK from 1884 to 2013, a period of 129 years. We are unaware of any other records longer than 100 years in the world that describe flood events for rivers and coasts on a national scale. The data record was used to explore trends in flooding over the 20th century. The effectiveness of the analysis framework used was evaluated to determine the ability to extract consistent knowledge in a changing social and physical world.
The reported datasets are described and critiqued, and limitations discussed. Validation of the dataset using independent flood impact data is then undertaken. The full time series is presented, and the data is de-trended for exposure and the implications of the findings are discussed.
Methodology
Datasets used for the long-term study of UK flood impacts
Macdonald and Black (Citation2010) state “the suitability and value of historical data in flood frequency analysis is determined by availability of records, their level of detail and their reliability”. There is a difference between a hydrological flood in terms of water level and a damaging flood which impacts on society. In this study only floods that have been reported as having an impact on society are considered. These are listed in the UK Meteorological Office (henceforth Met Office) Monthly Weather Reports (MET-WR; Met Office Citation2012a) and UK Climate Summaries (MET-CS; Met Office Citation2012b) (© Crown Copyright). These records span the period 1884 to present () and are probably one of the longest regular sets of national reported flood consequences in the world.
Figure 1. Lengths of the datasets used within this study.
The Met Office monthly weather summaries ended in 1993 and the UK Climate Summaries start in 2001. Hence, in this paper these reports are supplemented with the CEH (Centre for Ecology and Hydrology) monthly Hydrological Summaries (CEH-HS; CEH Citation2012) for 1988–2012 (© NERC – Centre for Ecology & Hydrology). These consider flood events (with limited descriptions of impacts), and they overlap with the Met Office reports for 18 years, allowing comparison.
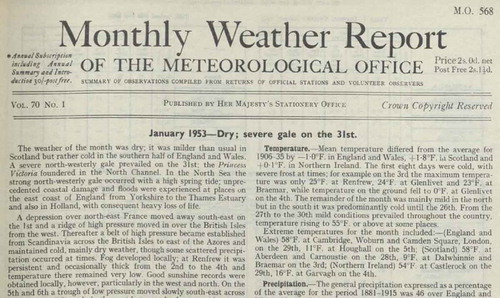
The Met Office monthly weather summaries report on the meteorological ‘highlights’ for the UK each month (). Where flood impacts occur as a result of meteorological processes (such as rainfall, storm surges, high tides and gales), these are reported in the summaries as both terrestrial flooding (pluvial and fluvial) and tidal flooding.
Figure 2. Extract from the January 1953 Monthly Weather Report. This includes the extreme coastal flood event that caused over 2000 deaths in norhtwest Europe. (Source: Met Office Monthly Weather Reports © Crown Copyright. Contains public sector information licensed under the Open Government Licence v1.0).
This paper appraises the sources and methodology for producing a single unified record to provide an unbroken time series of reported flood events in the UK from 1884 to 2013.
Flood reporting terminology
The Monthly Weather Reports provide the following information about flood events:
Place(s) affected
Description
Cause (flood type)
The terminology used is often only descriptive; flow values or tide levels were rarely reported. Phrases used included ‘Disastrous’, ‘Destructive’ or ‘Severe’, which are difficult to quantify but nevertheless are useful indicators of the perceived scale of the event. The distribution of words used to describe flood events in the reports is shown in . The terms ‘Widespread’, ‘Severe’ and ‘Extensive’ have similar frequency of use in the two datasets, but CEH tends to use ‘Significant’ in place of a wider range of terms used by the Met Office.
Table 1. Number of times terminology used within the Met Office and CEH flood reports.
Consistency of reporting terminology through time
The consistency of terminology through time is an important consideration. The use of the five most commonly used terms in the datasets (‘Severe’, ‘Widespread’, ‘Serious’, ‘Extensive’ and ‘Considerable’ – see ) was analysed. shows that the majority of terms (‘Severe’, ‘Serious’, ‘Extensive’ and ‘Considerable’) are used continuously through time in the Met Office datasets and may be good indicators of the scale of event. The use of the term ‘Widespread’ is much more sporadic, first being used in the 1920s and with heightened use in the 1960s and 1980s. However, it is used more consistently toward the end of the record and so it may also be an indicator of scale. In the CEH dataset ‘Serious’ and ‘Considerable’ are used infrequently, however ‘Widespread’, ‘Severe’ and ‘Extensive’ are used continuously (the dataset starts in 1989 and so the 1980s data is only based upon one year and therefore is not comprehensive).
Figure 3. Frequency of commonly used terms over time in (a) the Met Office Monthly Weather Reports (1884–1993) and UK Climate Summaries (2001–2013) and (b) the CEH Hydrological Summaries (1988–2013).
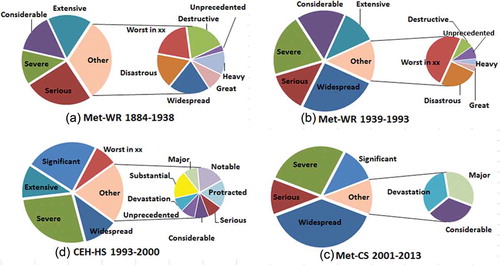
The evolution of use of the terms was explored for all of the datasets. The Monthly Weather Reports (Met-WR, and ) used a wide array of descriptive terms, which evolved into a smaller number of terms in the Climate Summaries (Met-CS, ). The proportion of records using the terms ‘Considerable’ (6%), ‘Severe’ (9%) and ‘Widespread’ (9%) has remained relatively consistent throughout time. The term ‘Serious’ is used continuously throughout the record (to describe an average of 7% of flood events). The term ‘Heavy’ is seen at the start of the record only. ‘Extensive’ is used consistently throughout the Met-WR and also in the CEH-HS. ‘Widespread’ and ‘Severe’ appear throughout all the datasets.
Figure 4. Descriptive terms in the Met Office Monthly Weather Reports (Met-WR) and UK Climate Summaries (Met-CS) and the CEH Hydrological Summaries (CEH-HS).
Validation of descriptive terms
The descriptive terms used were compared to the Dartmouth Flood Observatory (DFO) records for the common period in the data (1985–2013). The DFO uses news, governmental, instrumental and remote sensing sources to compile a global database of large flood events (Brakenridge Citation2014). The dataset contains quantitative information such as number of fatalities, people displaced, estimated damage and area affected. These are used to assign a logarithmic flood magnitude score, similar to the Richter scale for earthquakes. Events with a flood magnitude score of 7, 8 or 9 can be reached for truly large events (Kundzewicz et al. Citation2013).
The flood events from the Met Office and CEH reports were compared to the DFO floods. Floods from each dataset were matched by consideration of start dates, places affected and flood type. 69% of the events in the Met Office record and 81% of the CEH events were reported in the DFO records. Flood events described in the Met Office and CEH reports that are not present in the DFO record were excluded from the validation exercise.
The magnitude of events from the DFO record was matched to the descriptive terms used in the Met Office and CEH records ( and , respectively). Where several descriptive terms were used for a single flood event, each term was considered separately.
In the Met Office data () the term ‘Widespread’ is used frequently to describe high-magnitude flood events. ‘Serious’, ‘Extensive’ or ‘Disastrous’ also describe high magnitude events from the DFO record, although the terms are used infrequently and therefore there is less certainty that they can be good indicators of scale. However, they still offer insight into the scale of the events they describe. Floods described as ‘Severe’, or that offer an estimated recurrence interval (or give assertions as to when the last flood of that magnitude was, e.g. “worst flooding seen in xx years”), are associated with mid-interval floods and are more frequently used in the dataset. The term ‘Devastation’ correlates to a low-magnitude event in the DFO (flood magnitude score 2.7); however, this refers to the locally significant event in Boscastle in 2004. This was a destructive event (Miller et al. Citation2013) that required a major airborne rescue operation to rescue victims (HR Wallingford et al. Citation2006). This is likely to have been underplayed in the global DFO dataset. Floods described in the Met Office reports as ‘Localised’ frequently correlated to intermediate to large floods from the DFO record. This highlights the limitation that locally significant events may be underplayed in the reports.
Figure 5. DFO magnitude vs descriptive terms used in the Met Office reports (star shows average magnitude, points show the spread).
Some events described in the Met Office dataset that were considered to be ‘Significant’ on a UK scale have been missed in the global DFO data. For example the Met Office describes “significant” flooding in Aberystwyth on 9 June 2012 with hundreds of people rescued, costly damage to infrastructure and described as not seen in over 50 years (e.g. BBC Citation2012). This event is not present in the DFO, perhaps due to more severe flooding in the USA and Thailand occurring on the same date.
The CEH data () uses 13 descriptive terms compared with the eight used by the Met Office. These tend to have a lower average DFO magnitude than Met Office data. Floods described as ‘Devastating’, ‘Substantial’ or ‘Protracted’ are associated with the highest magnitude DFO floods, and are used infrequently within the CEH data. However, the relationship is not strong because we are comparing reported issues of space, scale, rarity, duration and impact (DFO scoring system) with a single descriptive term that summarizes a flood event (CEH and Met Office). These terms are more difficult to quantify than information such as maximum water levels or peak flows. Nevertheless and show that it is feasible to categorize these reports into classes, albeit not rank them in order of magnitude as for the DFO events. The comparison with the Dartmouth Flood Observatory dataset shows that descriptive terms used in the Met Office and CEH datasets can be related to an independent assessment of the magnitude of a flood event.
Figure 6. DFO magnitude vs descriptive terms used in the CEH reports (star shows average magnitude, points show the spread).
Reported impacts
shows the proportion of reports in which flood impacts were described either qualitatively (e.g. descriptively) or quantitatively (more substantially, such as spatial extent of flooding or specific impacts). The number of reports including information on impacts in the Met Office Weather Reports (Met-WR) varies through time; the number of quantitative records increased over the first part of the 20th century, falling towards the middle of the century before rising into the 1980s and 1990s. Between 20% and 40% of early reports record qualitative information on impacts; this proportion falls into the middle and end of the 20th century (being mostly replaced by quantitative descriptions). Of the total records, 21% provide quantitative information on flood impacts, with a further 8% providing qualitative descriptions. Only a small proportion (<10%) of Met Office Climate Summaries (Met-CS) provide information on flood impacts in the 2000s; however, the limited data for the 2010s shows almost half of the reports record quantitative information on flood impacts.
Figure 7. Percentage of flood records that described flood impacts (qualitative or quantitative).
The CEH Hydrological Summaries (CEH-HS) provide limited quantitative information on flood impacts (only 10% of the total), with a further 10% of reports describing flood impacts qualitatively.
This assessment shows that the two datasets do not provide a comprehensive record on flood impacts; however, we can still extract meaningful information from a significant proportion of reported floods.
Classification of flood event descriptors
The DFO validated descriptive phrases and information on flood impacts used in the CEH and Met Office reports were used to classify floods into groups that indicate the impact of the flood event. Three flood impact classes were created: Class 1 for low-magnitude events, Class 2 for intermediate-magnitude events, and Class 3 for high-magnitude events. Floods for which ‘Localised’, is the only description given were assigned to Class 1 (low magnitude of impact) because the use of ‘Localised’ as a descriptor was considered to be uncertain and inconsistent. Less than 10% of all floods described in the DFO dataset were ‘Localised’, so the effect of this assumption is minor.
The Met Office and CEH data were classified as shown in . Concurrent reports from the Met Office and CEH were available for 1989–1993 and 2001–2012 (). In these periods, 206 floods occur in the Met Office dataset and 204 in the CEH dataset. The CEH describes slightly more Class 2 (intermediate) floods and the Met Office describes slightly more Class 1 (smaller) and Class 3 (bigger) floods. The agreement between these datasets gives confidence in developing a consistent long-term reported flood event record.
Table 2. Classification of flood events according to estimated severity of event.
Figure 8. Comparison of reported flooding between Met Office and CEH data.
Creating a unified record
To create an unbroken record of records from 1884 to 2013 the datasets were combined. A total of 785 reported flood events were identified in the combined dataset. For the period 2001–2013, the Met Office Climate Summaries are used as they describe impacts more comprehensively than in the CEH reports. For the period 1993–2000 the CEH hydrological summaries are used, and the Met Office Weather Reports are used to extend the record from 1993 back to 1884. The combined dataset is shown in .
Figure 9. Instances of reported flooding in the UK each year 1884–2013 using combined Met Office/CEH data.
Well-known events, such as the floods of 1947, 1953, 2001, 2007, 2012, were readily identified. The causative mechanism (pluvial, fluvial) was rarely described and only 47 coastal flood events were identified from the records. The flood events were classified into ‘Class 1’, ‘Class 2’ and ‘Class 3’ floods using the definitions in . The annual totals of these events are shown in .
There is an upward trend in reported flooding over time and flood events appear more frequently towards the end of the 20th century. The start of the record is ‘flood poor’ but the number of events rose sharply through the 1910s and the 1920s. The number of reported events is lower between 1930 and the mid-1960s. This is most noted for 1939 and 1945 when there were government restrictions on reporting due to the Second World War. Reported events increased noticeably in the 1960s, with a peak in the early 1990s; 2012 was an exceptional year for floods in the UK, where annual rainfall was the second highest in over 100 years (Met Office Citation2013).
Estimating changes in exposure (receptors)
Over the 20th century, the UK population grew from 38.2 million to 59.1 million and the number of dwelling houses grew from 7.7 million to 24.8 million (). As a result there were more properties exposed to flooding and also more people to report flooding. A higher exposure to flooding will result in more reported flood events and larger potential consequential damage.
Figure 10. UK population counts (NISRA Citation2012, NRS Citation2012, ONS Citation2012a, Citation2012b), dwelling counts (DCLG Citation2013) and the proportion of new homes built in areas of flood risk (DCLG Citation2012).
The reported flood events from the Met Office and CEH were normalized using the UK population and the number of dwellings. The population and dwelling counts were used as a proxy for exposure to flooding assuming that the percentage of the population in floodplains is proportional to the total population. This is supported by data for the percentage of new households built on floodplains in England in 1989–2010 (DCLG Citation2012) (). The population and dwelling data were used to scale the aggregate yearly flood totals using
Where, for the year i, FSPi is the flood count scaled for population; FSDi is the flood count scaled for dwellings; Fi is the count of reported flood events; Pi is the UK population; and Di is the UK dwellings count.
Estimating changes in defences (pathways)
There are no data available at a national scale that record changes in natural defences, artificial defences and other management. Natural defences are important and they may have declined, but data are poor (Jones et al. Citation2011). There have been significant upgrades to artificial defences, most notably following the 1947 Thames floods, with a sustained effort to improve conveyance of rivers, and the 1953 North Sea storm surge, which led to a major upgrade of flood defences on the East Coast, including the Thames Barrier and London’s flood defences. Hence subsequent extreme sea-level events on the East Coast had much lower impacts even if the hydraulic conditions were similar—compare the major consequences of the 31 January/1 February 1953 event including more than 300 deaths (Steers Citation1953) with the 11 January 1978 event (Steers et al. Citation1979), and the recent 5/6 December 2013 event with similar or higher water levels and much smaller consequences. As well as defences, flood warnings have improved substantially and are now routine components of flood risk management (Horsburgh et al. Citation2008). The implications of these trends are considered later.
Trends in reported flooding – normalized for exposure
Reported flood impacts are normalized for exposure using population and number of dwelling houses in the UK ( and ). When scaled for exposure, the relative count of flood events shows a weaker trend and greater variability than the raw data shown in . The normalized data suggest that there is no consistent trend in the number of floods per head of population during the 20th century. There is significant decadal variability in both the raw data and normalized counts. Wilby and Quinn (Citation2013) identified three hydrologically flood-rich episodes in river catchments since the 1870s, as follows: 1908–1934, 1977–1988 and from 1998 onwards. The first period is visible in , and the second and third periods are characterized by higher numbers of flood events (fluvial, pluvial and coastal) in the 1980s and post-1998. However, the reports also indicate a peak in the early 1970s which differs from the Wilby and Quinn (Citation2013) analysis. shows that flood counts normalized by number of dwellings have not increased during the 20th century.
Figure 11. UK flooding normalized by (a) population and (b) number of dwellings (note: normalized data plotted to 2012 due to lack of 2013 normalization data).
Clusters of ‘Class 3’ (high-magnitude) flooding (as defined in ) appear in the 1920s, 1960s and the 1990s. ‘Class 2’ (intermediate) flood events appear more uniformly though time. The number of ‘Class 1’ (low-magnitude) events is highly variable. There is a fall in ‘Class 1’ floods between 1930 and 1960, but the frequency of ‘Class 1’ floods increases sharply after 1968. This may be associated with increased development on floodplains during the latter part of the 20th century (Parker Citation1995).
We cannot normalize for defences, but we note that the last peak of Wilby and Quinn (Citation2013) is not apparent in . While it is speculative, this may represent the effect of improved defences reducing impacts and therefore ‘reportable’ flood events.
Discussion
Consequences are the combined results of high river flows, pluvial flooding and coastal flooding, the numbers of people and property exposed to flooding and the effects of flood defence construction and floodplain management policies. The increase in the total number of reported flood events in the 20th century in the UK appears to be a function of the gradual increase in exposure due to urban expansion and population growth. However, there is also greater capacity to report flood events. The number of reported ‘Class 3’ flooding events has remained static or decreased slightly over the 20th century. This is despite the UK population almost doubling and the number of dwelling houses tripling over the same time period.
There is no clear underlying trend in flood reports present in the UK flood data when they are normalized for exposure. Pielke and Landsea (Citation1998) studied damage caused by hurricanes in the USA. They also found that normalizing damage reports to take account of exposure removed the upward trend of losses over time and only left a large decade-to-decade variation in losses. The lack of a systematic trend in the normalized UK total flood count mirrors these findings. It is also in agreement with studies of trends in river flows (Robson Citation2002). Land use change can affect the number of reported floods; e.g. Kjeldsen (Citation2010) and Kjeldsen et al. (Citation2012) suggested that increased urbanisation has a pronounced effect on flood hydrology. In this work, we used population and number of dwellings as a measure of exposure but not as a driver of increased hazard such as higher runoff. This demonstrates the complexity of separating hydrology from flood impacts.
These observations do not preclude concern about future flood impacts, especially in coastal areas where sea-level rise is being observed and faster rises are expected (Haigh et al. Citation2011), and areas potentially exposed to higher rainfall intensities (Hulme et al. Citation2002, Stern Citation2006). However, attributing periods of reduced flooding simply to the effects of improved management is difficult and must be done with care. Future flood risk may be very sensitive to changes in funding or management approaches and this has important implications for decision makers.
The reporting framework used by both the Met Office and CEH has been shown to be an effective resource for a national-scale study of reported flooding. The consistency of the data is a key asset, with the length of record giving useful insights into flood trends at a national level. Care must be taken with the use of multiple data sources and variations in the terminology used to describe floods. The reporting framework has some limitations—it is descriptive and rarely provides the opportunity for classification of flooding by mechanism (fluvial, pluvial, coastal etc.). It may also be biased towards urban areas where reporting of flooding is more likely. Further, the data are likely to under-represent localized events, which may have had implications for national policy. However, despite these drawbacks, the dataset opens the possibility of considering flood occurrence over a long time scale using reported information (and thus likely effects on society), rather than just changes in extreme hydrological events.
As a tool for reviewing the change in flood impacts through time, supplementary data are needed (such as local newspaper reports, post-hoc academic or professional reviews), as key events are typically mentioned, but underplayed in the data (e.g. the North Sea surge of 1953, which was condensed to “unprecedented coastal damage and floods”, see ). Additional data can be gathered for individual flood events, for example, the Environment Agency report on the costs of the summer 2007 flood events (Chatterton Citation2010), Met Office reviews of the 2005 and 2008 flooding (Met Office Citation2011, Citation2012c), and an appraisal of the 1947 fluvial event (RMS Citation2007).
The dataset presented here serves as a ‘catalogue’ of national level flood events in the UK over the last 125 years. A further study linking date of occurrence from this record with rainfall/river flow data could make assessment of flooding ‘type’ possible. The study could be complemented or extended further in time by using ancillary data sources, such as the Chronology of British Hydrological Events (Black and Law Citation2004). Analysis of the recurrence interval of events within the record could provide further validation. However, care must be taken due to the quality of reported impacts and the limitations of qualitative data sources, as discussed in this paper. This work highlights the need to maintain the reporting framework of flood events in order to provide continued information on long-term trends, such as the effects of climate change and sea-level rise.
Conclusions
This paper develops a 100+ year national dataset of 785 notable flood events in the UK. It is an unusual if not unique dataset. The dataset indicates an increase in reported flood events during the 20th/21st century and significant variation from decade to decade. However, normalizing the data by population and number of dwellings removes any long-term temporal trend and leaves a strong decadal variability. The effect of increasing and improving defences is unclear. It also shows the importance of drivers of flood events and losses, and the continuing benefits of monitoring changes in climate, exposure and impacts. Descriptive datasets of reported flooding can complement existing hydrological analysis, especially for combined descriptive/quantitative datasets such as the CEH Hydrological Summary of the UK.
Disclosure statement
No potential conflict of interest was reported by the authors.
Acknowledgments
The authors would like to thank the Met Office for providing the UK Monthly Weather Reports and the UK Climate Summaries, and the CEH for providing the monthly Hydrological Summaries. Particular thanks go to Mark Beswick of the Met Office for his help and advice in using the data. Thanks go to Dr Thomas Kjeldsen and Jamie Hannaford, for constructive remarks which helped improve the paper.
Additional information
Funding
References
- Barredo, J.I., 2009. Normalised flood losses in Europe: 1970–2006. Natural Hazards and Earth System Sciences, 9, 97–104. doi:10.5194/nhess-9-97-2009
- BBC, 2012. Wales flooding: major rescue continuing near Aberystwyth [online]. Available from: http://www.bbc.co.uk/news/uk-wales-18378124 [Accessed March 2014].
- Black, A.R. and Law, F.M., 2004. Development and utilization of a national web-based chronology of hydrological events. Hydrological Sciences Journal, 49 (2), 37–41. doi:10.1623/hysj.49.2.237.34835
- Brakenridge, G.R., 2014. Global Active Archive of Large Flood Events [online]. Dartmouth Flood Observatory, University of Colorado. Available from: http://floodobservatory.colorado.edu/Archives/index.html [Accessed July 2014].
- CEH (Centre for Ecology & Hydrology), 2012. National Hydrological Monitoring Programme – Monthly Hydrological Summary for the UK [online]. Available from: http://www.ceh.ac.uk/data/nrfa/nhmp/monthly_hs.html [Accessed July 2014].
- CEH (Centre for Ecology & Hydrology), 2013. Long River Flow Records [online]. NERC. Available from: http://www.ceh.ac.uk/data/nrfa/hydrometry/records.html [Accessed July 2014].
- Chatterton, J., et al., 2010. The costs of the summer 2007 floods in England. Project report (SC070039/R1). Bristol: Environment Agency.
- Costa, J.E., 1986. A history of paleoflood hydrology in the United States, 1800–1970. Eos, Transactions American Geophysical Union, 67, 425–430. doi:10.1029/EO067i017p00425-02
- DCLG (Department for Communities and Local Government), 2012. Tables P251 to P252: land use change: flood risk areas. Land Use Change Statistics [online]. Available from: https://www.gov.uk/government/statistical-data-sets/live-tables-on-land-use-change-statistics [Accessed July 2015].
- DCLG (Department for Communities and Local Government), 2013. Table 101: by tenure, United Kingdom (historical series). Live tables on dwelling stock (including vacants) [online]. Available from: https://www.gov.uk/government/statistical-data-sets/live-tables-on-dwelling-stock-including-vacants [Accessed July 2015].
- Delgado, J.M., Apel, H., and Merz, B., 2010. Flood trends and variability in the Mekong River. Hydrology and Earth System Sciences, 14, 407–418.
- Evans, E., et al., 2004. Foresight. Future flooding. Scientific summary: volume 1–future risks and their drivers. London: Office of Science and Technology.
- FLOODSITE, 2009. Flood risk assessment and flood risk management. An introduction and guidance based on experiences and findings of FLOODsite (an EU-funded Integrated Project). Delft: Deltares Delft Hydraulics.
- Haigh, I., Nicholls, R., and Wells, N., 2010. Assessing changes in extreme sea levels: application to the English Channel, 1900–2006. Continental Shelf Research, 30, 1042–1055. doi:10.1016/j.csr.2010.02.002
- Haigh, I., Nicholls, R., and Wells, N., 2011. Rising sea levels in the English Channel 1900 to 2100. Proceedings of the Institution of Civil Engineers-Maritime Engineering, 164, 81–92.
- Hannaford, J. and Marsh, T.J., 2008. High‐flow and flood trends in a network of undisturbed catchments in the UK. International Journal of Climatology, 28, 1325–1338. doi:10.1002/joc.1643
- Hooijer, A., et al., 2004. Towards sustainable flood risk management in the Rhine and Meuse river basins: synopsis of the findings of IRMA-SPONGE. River Research and Applications, 20, 343–357. doi:10.1002/rra.781
- Horsburgh, K.J., et al., 2008. Aspects of operational forecast model skill during an extreme storm surge event. Journal of Flood Risk Management, 1, 213–221. doi:10.1111/j.1753-318X.2008.00020.x
- HR Wallingford, Flood Hazard Research Centre and Risk and Policy Analysts Ltd, 2006. Flood Risks to people. Phase 2. FD2321/TR2. Guidance document. Defra/Environment Agency Flood and Coastal Defence R&D Programme.
- Hulme, M., et al., 2002. Climate change scenarios for the United Kingdom: the UKCIP02 scientific report. Norwich: School of Environmental Sciences, University of East Anglia.
- IPCC (Intergovernmental Panel on Climate Change), 2007. Climate change. Contribution of Working Group II to the Fourth Assessment Report of the Intergovernmental Panel on Climate Change, M.L. Parry, et al., eds. Cambridge, UK: Cambridge University Press.
- IPCC (Intergovernmental Panel on Climate Change), 2012. Managing the risks of extreme events and disasters to advance climate change adaptation. Special report of Working Groups I and II of the Intergovernmental Panel on Climate Change. Cambridge, UK: Cambridge University Press.
- IPCC (Intergovernmental Panel on Climate Change), 2013. T.F. Stocker, et al., eds. Climate change: the physical science basis. Summary for policymakers. Contribution of Working Group I to the Fifth Assessment Report of the Intergovernmental Panel on Climate Change. Cambridge, UK: Cambridge University Press.
- Jones, L., et al., 2011. Coastal margins. Chapter 11 In, UK national ecosystem assessment technical report. Cambridge, UK: United Nations Environment Programme World Conservation Monitoring Centre (UNEP-WCMC).
- Jongman, B., Ward, P.J., and Aerts, J.C.J.H., 2012. Global exposure to river and coastal flooding: long-term trends and changes. Global Environmental Change, 22, 823–835. doi:10.1016/j.gloenvcha.2012.07.004
- Kjeldsen, T.R., 2010. Modelling the impact of urbanization on flood frequency relationships in the UK. Hydrology Research, 41 (5), 391–405. doi:10.2166/nh.2010.056
- Kjeldsen, T.R., Svensson, C., and Miller, J.M. 2012. Large-scale attribution of trend in UK flood flow data. BHS Eleventh National Symposium, Hydrology for a changing world. Dundee.
- Kundzewicz, Z.W., Pińskwar, I., and Brakenridge, G.R., 2013. Large floods in Europe, 1985–2009. Hydrological Sciences Journal, 58 (1), 1–7. doi:10.1080/02626667.2012.745082
- Macdonald, N., 2006. An underutilized resource: historical flood chronologies a valuable resource in determining periods of hydro-geomorphic change. Sediment Dynamics and the Hydromorphology of Fluvial Systems, 306, 120–126.
- Macdonald, N. and Black, A.R., 2010. Reassessment of flood frequency using historical information for the River Ouse at York, UK (1200–2000). Hydrological Sciences Journal, 55, 1152–1162. doi:10.1080/02626667.2010.508873
- Macdonald, N., Phillips, I.D., and Mayle, G., 2010. Spatial and temporal variability of flood seasonality in Wales. Hydrological Processes, 24, 1806–1820. doi:10.1002/hyp.7618
- Marsh, T. and Harvey, C.L., 2012. The Thames flood series: a lack of trend in flood magnitude and a decline in maximum levels. Hydrology Research, 43, 203–214. doi:10.2166/nh.2012.054
- Menéndez, M. and Woodworth, P.L., 2010. Changes in extreme high water levels based on a quasi-global tide-gauge dataset. Journal of Geophysical Research, 115, C10011. doi:10.1029/2009JC005997
- Merz, B., et al., 2010. Fluvial flood risk management in a changing world. Natural Hazards and Earth System Sciences, 10, 509–527. doi:10.5194/nhess-10-509-2010
- Met Office, 2011. ‘Awful August’ – Floods 2008. Case Studies [online]. Available from: http://www.metoffice.gov.uk/about-us/who/how/case-studies/floods-2008 [Accessed April 2014].
- Met Office, 2012a. Monthly Weather Report [online]. Available from: http://www.metoffice.gov.uk [Accessed July 2014].
- Met Office, 2012b. UK Climate Summaries [online]. Available from: http://www.metoffice.gov.uk/climate/uk/ [Accessed July 2014].
- Met Office, 2012c. Floods in Carlisle – January 2005. Past weather events [online]. Available from: http://www.metoffice.gov.uk/climate/uk/interesting/jan2005floods [Accessed April 2014]
- Met Office, 2013. Annual 2012 [online]. Available from: http://www.metoffice.gov.uk/climate/uk/2012/annual.html [Accessed June 2014].
- Miller, J.D., et al., 2013. A hydrological assessment of the November 2009 floods in Cumbria, UK. Hydrology Research, 44 (1), 180–197. doi:10.2166/nh.2012.076
- Murphy, C., et al., 2013. Climate-driven trends in mean and high flows from a network of reference stations in Ireland. Hydrological Sciences Journal, 58, 755–772. doi:10.1080/02626667.2013.782407
- Narayan, S., et al., 2014. The SPR systems model as a conceptual foundation for rapid integrated risk appraisals: lessons from Europe. Coastal Engineering, 87, 15–31. Special issue: Coasts@Risks: THESEUS, a New wave in Coastal Protection.
- NISRA (Northern Ireland Statistics & Research Agency), 2012. Northern Ireland Census 2011. In: Historic population trends (1841–2011) – Northern Ireland and Republic of Ireland, July, Belfast.
- NRS (National Records of Scotland), 2012. 2011 Census: first results on population estimates for Scotland – release 1A.
- ONS (Office for National Statistics), 2012a. 2011 census – population and household estimates for England and Wales.
- ONS (Office for National Statistics), 2012b. 2011 Census – population and household estimates for Wales.
- Parker, D.J., 1995. Floodplain development policy in England and Wales. Applied Geography, 15, 341–363. doi:10.1016/0143-6228(95)00016-W
- Petrow, T. and Merz, B., 2009. Trends in flood magnitude, frequency and seasonality in Germany in the period 1951–2002. Journal of Hydrology, 371, 129–141.
- Pielke Jr, R.A., 2000. Flood impacts on society. Damaging floods as a framework for assessment. In: D.J. Parker, ed. Floods. London: Routledge Hazards and Disasters Series.
- Pielke Jr, R.A. and Landsea, C.W., 1998. Normalized hurricane damages in the United States: 1925–95. Weather and Forecasting, 13, 621–631. doi:10.1175/1520-0434(1998)013<0621:NHDITU>2.0.CO;2
- Ramsbottom, D., Sayers, P., and Panzeri, M., 2012. Climate Change Risk Assessment for the Floods and Coastal Erosion Sector (Defra Project Code GA0204). Climate Change Risk Assessment 2012. London: DEFRA.
- RMS, 2007. 1947 UK River Floods: 60-Year Retrospective. Risk Management Solutions Special Report.
- Robson, A.J., 2002. Evidence for trends in UK flooding. Philosophical Transactions of the Royal Society A: Mathematical, Physical and Engineering Sciences, 360, 1327–1343. doi:10.1098/rsta.2002.1003
- Robson, A.J., et al., 1998. A study of national trend and variation in UK floods. International Journal of Climatology, 18, 165–182.
- Ruocco, A.C., et al., 2011. Reconstructing coastal flood occurrence combining sea level and media sources: a case study of the Solent, UK since 1935. Natural Hazards, 59, 1773–1796. doi:10.1007/s11069-011-9868-7
- Steers, J.A., 1953. The east coast floods January 31–February 1 1953. The Geographical Journal, 119, 280–298. doi:10.2307/1790640
- Steers, J.A., et al., 1979. The storm surge of 11 January 1978 on the east coast of England. The Geographical Journal, 145, 192–205. doi:10.2307/634386
- Stern, N., 2006. Stern review on the economics of climate change. London: H. M. Treasury.
- Thorne, C., Evans, E., and Penning-Rowsell, E., 2007. Future flooding and coastal erosion risks. London: Thomas Telford Ltd.
- Wilby, R.L. and Quinn, N.W., 2013. Reconstructing multi-decadal variations in fluvial flood risk using atmospheric circulation patterns. Journal of Hydrology, 487, 109–121. doi:10.1016/j.jhydrol.2013.02.038
- Wilby, R.L., Beven, K.J., and Reynard, N.S., 2008. Climate change and fluvial flood risk in the UK: more of the same?. Hydrological Processes, 22, 2511–2523. doi:10.1002/hyp.6847
- Zsamboky, M., et al., 2011. Impacts of climate change on disadvantaged UK coastal communities. York: Joseph Rowntree Foundation.