
ABSTRACT
Since the 1980s, inappropriate human activities and excessive water-resource exploitation have had a serious impact on the water environment of the Huaihe River basin. Water shortage and water pollution are both important factors restricting local socio-economic development. To demonstrate the interactions between the socio-economic system and the water-resource system, a physically-based hydro-economic model was developed. After division of the basin into sub-regions, a distributed model was developed that describes the combined systems of water quantity–water quality–socio-economics (WQQSE), and simulates ƒthe changing processes of water quantity and water quality from 1991 to 2000. On the basis of this hydro-economic model, an optimal-control model was also developed to research the maximum sustainable socio-economic scale of the river basin by considering hydro-economic interactions, water supply, water quality and socio-economic development constraints. The results demonstrate that the models developed can be used to depict the hydro-economic interaction and to indicate preferable management strategies to meet the development needs of the future.
EDITOR D. Koutsoyiannis; ASSOCIATE EDITOR Not assigned
1 Introduction
Harmonization of the interaction between socio-economic development and water-resource exploitation is a global problem (referred to as hydro-economic interaction in this study) in densely populated regions. Excessive exploitation and utilization of water resources has induced serious water shortage and water-pollution issues in many districts, such as the Yellow River basin of China, the Ganges River basin of India, the Nile River basin of Africa and the Jordan River basin of the Middle East. Several studies (e.g. Sánchez-Chóliz and Duarte Citation2005, Maal-Bared Citation2006, Cao et al. Citation2010, Koutsoyiannis Citation2011, Sivakumar Citation2011) have shown that water issues have restricted the development of local socio-economies. Therefore, it is important to moderately control the speed of economic development and to improve water-use efficiency.
In recent decades, many studies have addressed the hydro-economic interaction in high-human-activity regions, and hydro-economic models have been widely used by hydrologists and economists in this research area. The hydro-economic model represents regional-scale hydrological, economic, environmental and engineering aspects of the water-resource system within a coherent framework. The main purpose of establishing a hydro-economic model is to seek the optimal exploitation and utilization scale of water resources to maximize production values or to minimize the costs of the reduced water supply or pollution. From the earliest applications of systems analysis to water-resource management, economic objectives and constraints have been frequently used in models of real systems (Maass et al. Citation1962, Loucks et al. Citation1981, Golubev Citation1983). Recent hydro-economic studies have been described by Heinz et al. (Citation2007), Brouwer and Hofkes (Citation2008), Peña-Haro et al. (Citation2009), Harou et al. (Citation2009), Georgea et al. (Citation2011) and Kragt (Citation2013).
On the whole, most hydro-economic models share the basic components of hydrological flows, a water-management infrastructure, economic water demands, operating costs and operating rules (Medellín-Azuara et al. Citation2009). Since Maass et al. (Citation1962), water-resource systems have been modelled as networks of storage and junction nodes joined by conveyance links representing river reaches, canals, pipelines, etc. Water supply and use are also represented as links. The network format is straightforward for simulation and allows for efficient model formulations. Boundary conditions in the form of inflows and outflows can occur anywhere in the network (Letcher et al. Citation2007). Based on these, several models with the physical mechanism of supply and demand of water resources were developed. For example, Barthel et al. (Citation2005) developed a model of the water-supply sector that could link the physical model determining the water quality and availability with the socio-economic model determining the water consumption and demand. Velázquez (Citation2006) developed an input–output model of sectoral water consumption to simulate the changing processes of environmental and economic water consumption. Guan and Hubacek (Citation2008) presented a new accounting and analytical approach based on economic input–output modelling combined with a mass-balance hydrological model that links interactions in the economic system with those in the hydrological system.
Many hydro-economic models with an optimization objective were developed to provide both hydrological and economic results and integrated insights for water management and allocation. For example, marginal values for socio-economic-scale expansions indicate water use reductions from small socio-economic-scale expansions. Furthermore, shadow values of water indicate marginal willingness to pay for water and may help identify promising water-management portfolios from millions of potential portfolios (Medellín-Azuara et al. Citation2009). In contrast, simulation models of water resources may provide more detailed and accurate representation of the hydro-economic interaction. Ideally, simulation modelling can help test and refine promising policies and portfolios identified using optimization (Lund and Ferreira Citation1996).
Although research on hydro-economic models has made rapid progress, several problems are encountered when dealing with the water issues of a basin-scale region. Water-resource exploitation and utilization behaviour in the upper and lower reaches of a river basin influence each other, which could lead to the unfair allocation of water resources and even cause partial water contradiction or economic recession. Thus, it is essential to establish a distributed hydro-economic model to embody the spatial variation in water-resource conditions and socio-economic-development levels, and to develop an optimization method for water-resource management decision making to choose the best strategies for alleviating contradictions between socio-economic development and water-resource exploitation. In this study, a physically-based hydro-economic model was developed that links water quantity, water quality and socio-economics (WQQSE) to analyse the hydro-economic interaction in a river basin. Based on the hydro-economic model, an optimal-control model for researching the maximal sustainable socio-economic scale based on water-resource constraints was developed to investigate the best management strategies to meet the development needs of the future.
2 Study area and data
2.1 Study area
The Huaihe River, located in east-central China, divides the north of the country from the south. The Huaihe River basin comprises the Huaihe River system and the Yi-Shu-Si River system. The southern part of the old course of the Yellow River forms the Huaihe River system in the south of the basin. The Yi-Shu-Si River system, composed of the Yi, Shu and Si rivers and other small rivers in Shandong Province, drains the north of the basin (). The Huaihe River basin is 700 km long from east to west, 400 km wide from south to north on average, and has a total area of 2.7 × 10⁵ km2, with 1.9 × 10⁵ km2 in the Huaihe River system and 0.8 × 10⁵ km2 in the Yi-Shu-Si River system. The mainstream of the Huaihe River is 1000 km long; the upper reaches are the stream segments above the Wangjiaba Hydro-junction, the middle reaches are those from the Wangjiaba Hydro-junction to Hongze Lake, and the lower reaches are those below Hongze Lake.
Figure 1. Location map of the study region.
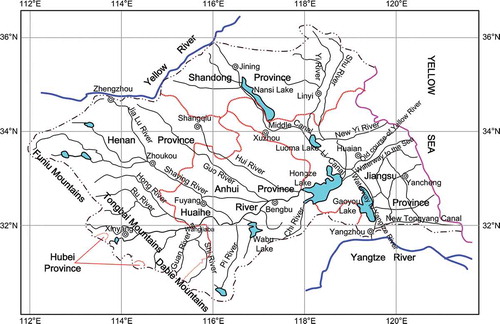
Due to its geographical location, the Huaihe River basin has always had an important strategic position in the economic development of China. It covers five provinces (Henan, Anhui, Jiangsu, Shandong and Hubei), and the economy of Jiangsu, Shangdong and Henan provinces are developing rapidly. It is an important traffic junction that links the south and north, and the east and west of China because of the waterway and overland traffic infrastructure. It contains abundant agricultural and mineral resources, is a grain production base and an energy resource centre for China. In 2006, the total population of the river basin reached 170 million, 13% of the total Chinese population. The population density (616 per km2) is 4.6 times higher than the national average population density and ranks first among the seven major basins of China.
Since the 1980s, the water-shortage and water-pollution problems of the Huaihe River basin have been enormous. Restricted by natural conditions, the water resources of the basin are scarce. The total volume of the water resources of the river basin under 50% inflow frequency is 7.6 × 10¹⁰ m3. The average available water is 448 m3 per capita per year, far below the global average. The limited water resources contrast acutely to the increasing water demand.
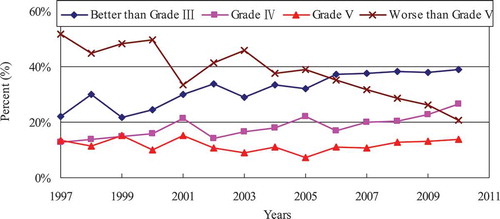
In recent years, many heavy-pollution industries, such as chemical plants, paper mills, print works and tanneries, developing rapidly in the area along the main and branch streams of the Huaihe River, have discharged large quantities of wastewater and caused serious water pollution. The percentage of river length of various water-quality grades within the river basin from 1997 to 2010 is shown in (Huaihe River water resource bulletin: 1997–2010); the water of most river segments has been seriously polluted, and 20–40% of river segments have lost normal function. Water shortage and water pollution have been the key factors restraining the sustainable development of the local socio-economy (Dou et al. Citation2010).
Figure 2. Percent of river length for various water-quality grades of the Huaihe River basin.
2.2 Data collection
Hydrological, geographical, socio-economic and water-quality data for Huaihe River basin were collected and used in this study. The hydrological data included the monthly flows for 1991–2000 recorded at 38 hydrological stations, and precipitation and evaporation data for the same period from 82 precipitation stations monitored across the Huaihe River basin by the Huaihe River Water Conservancy Committee (HRWCC). In addition, the operational rules for 19 large dams and sluices were obtained to analyse the impact on runoff regimes. The geographical data included land area, elevation, river systems, vegetation and soil types obtained from the Data Centre for Resources and Environmental Sciences of the Chinese Academy of Sciences (RESDC http://www.resdc.cn/). The basic socio-economic data, including the population, gross domestic product (GDP), cultivated area, grain yield, water supply and use in 1980–2000, were obtained from the local Statistical Yearbook and the relevant statistical data provided by HRWCC. In addition, other indices on future-development goals for the socio-economy and technological development were gathered from local-development planning reports by HRWCC. For water-quality simulation in this study, we selected CODMn (the permanganate index) as a typical water-quality index because it is the key index used in China. The locations of point-source pollutant outlets and the annual discharge load were collected in the research area. In addition, the discontinuous, monthly-monitored concentration data at 24 stations were collected from 1991 to 2000. The monthly pollutant load was calculated by multiplying the monthly concentration by the average monthly flow.
3 Development of a hydro-economic model to represent the WQQSE system
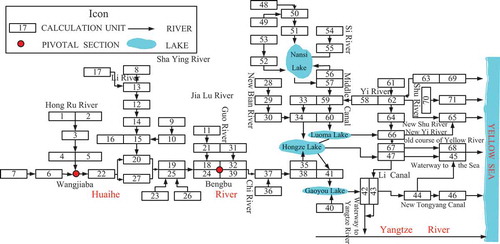
The hydro-economic interactions of the Huaihe River basin are complicated and inconsistent. Therefore, to understand the interactions well, it is necessary to develop a physical, hydro-economic model to represent the internal operational mechanisms of the linked systems of WQQSE. Before the model was constructed, the study area was divided into 71 sub-regions on the basis of the administrative divisions and the third-level sub-catchments in China, according to Dou et al. (Citation2010). We divided the basin in this way are so that the spatial differences of the water-resource conditions are embodied by third-level sub-catchments in which the rainfall and runoff conditions are different, whereas those of the water demand are embodied by administrative divisions in which the economic-development level is different. Based on this, a distributed hydro-economic model was established.
3.1 Development of the hydro-economic model for each sub-region
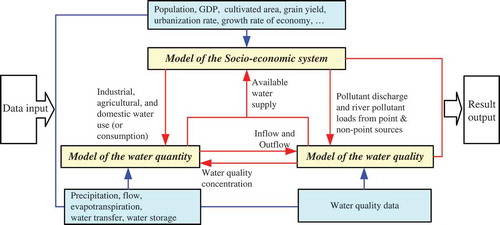
The hydro-economic model was developed to describe the interaction of the water-resource system with the socio-economic system in the Huaihe River basin. This model consists of three parts: a water-quantity balance calculation model, a water-quality balance calculation model, and a socio-economic system simulation model. The procedures for developing the model are described in the following sections.
3.1.1 Model of water quantity
This model was developed based on the conservation of mass:
first, the hydraulic connection between the sub-regions was established, and the sketch of a water-resource calculation node was drawn, as shown in
all of the variables pertaining to water resources in a sub-region, such as the volumes of inflow and outflow, of self-produced and transferred water, and water consumption, were determined for a certain period of time
according to the relationships between the unknown variables and the given variables, the unknown variables were expressed by approximate functions of the given variables and then input to the model; and
the unknown parameters were identified and inserted into the model.
Figure 3. Sketch of the water-resource calculation node.
The regression results were evaluated according to the calculated multiple-correlation coefficients, and the identified parameters were input to the model (Zuo et al. Citation2006). The values of all of the water volumes were calculated and checked to see whether the calculations conform to the conservation of mass. For any time period of length Δt, there is the water-balance equation, written as follows:
where P is the precipitation; QT is the volume of transferred water; Qin is the water inflow; E is the evapotranspiration; Ei, Ea, Eud, Erd are the industrial, agricultural, urban domestic and rural domestic water consumption, respectively; Qout is the water outflow; and ΔV is the change in water storage.
3.1.2 Model of water quality
As for the water quantity model, this model was developed based on the conservation of mass. For any time period Δt, the following pollutant balance equation applies:
where Qsi and Qso are, respectively, the inflow and outflow of surface water; Cin and Cout are the water quality concentration of the inflow and outflow; ΔC is the change in the water-quality concentration in the time period of length Δt; Sps and Sns are, respectively, the river-pollutant loads from point sources and non-point sources; Vs is the surface water storage; Wu is the total water use; and β is the comprehensive reduction rate of the water quality, obtained with:
where x1 is the river length from the inflow section to the outflow section of the sub-region; x2 is the river length from the sewage outfall section to the outflow section; k is the degradation coefficient of the pollutant; and u is the average flow velocity.
3.1.3 Model of the socio-economic system
This model was developed to simulate the pressure of future socio-economic development on the water-resource system within each sub-region, such as natural-resource consumption and environmental pollution. This model has three calculation modules:
3.1.3.1 Forecast module
This module was used to forecast the future socio-economic scale according to the planning development goals of the research area. Generally, the hydro-economic interaction of a WQQSE system is very complex. It is essential to select several representative socio-economic indices to reflect the intensity of human activity and its influence on the external environment. The following indices were selected:
population indices, such as total population, urbanization rate, growth ratio of the population, and number of floating population
economic indices, such as GDP, proportions of three major industries, growth ratio of industrial added value, electricity generation, livestock number, and grain yield; and
other indices to reflect the levels of resource consumption and pollution discharge (such as the water-use quota, water-consumption rate, and pollutant-discharge coefficient of various industries), or the development level of technology (such as the wastewater-treatment efficiency, wastewater-reuse ratio, and irrigation water-utilization coefficient).
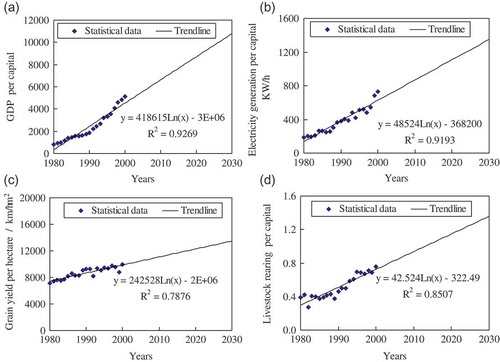
We selected 2005 as the present year and 2010–2030 as the planning years. The population and economic indices were used to forecast the socio-economic scale of the research area in the planning years, and the other indices to simulate the conditions of water-resource supply and use, and pollutant discharge. In the forecasting of socio-economic scale, we first analysed and forecasted the parameters for the socio-economic-development level of the research area on the basis of the statistical data for 1980–2000 ( ). Although the data trends in and show a few deviations from the fitted trendline, the values of R2 are above 0.85, indicating the high fitting accuracy between them. Then, we calculated the value of the socio-economic scale indices according to the function relationship between them and the above parameters. Finally, we verified the rationality of the forecasted results according to the target values and adjusted the forecasted results if there were obvious differences between them and the target values.
3.1.3.2 Calculation module of water use (or demand) and consumption
In the present year (2005), the productive (including industrial, agricultural and service industrial), domestic (including urban domestic and rural domestic) and ecological water uses were obtained from the statistical data of the water-conservancy departments; in the planning years, the productive, domestic and ecological water demands were forecasted by the water-quota method, which constructs a functional relationship between the socio-economic or ecological indices and water-demand quotas. The corresponding water consumption was then calculated by multiplying the water use (or demand) by the water-consumption rate.
3.1.3.3 Calculation module for pollutant discharge
The pollutant discharges arising from point sources (including industrial, urban and domestic pollutant discharges) and non-point sources were calculated by the pollutant-discharging-coefficient method, which constructs a functional relationship between the socio-economic indices and the pollutant-discharging coefficients. The determination of the coefficients was based on comprehensive consideration of the industrial-source, domestic-lifestyle, and pollution-source-treatment level. The river-pollution load was then calculated by multiplying the pollutant quantities discharged into rivers by the river-load coefficients derived on the basis of the degradable characteristics of the pollutants, distance from the pollution source to rivers, and the canalization level of the drainage channels.
Figure 4. Forecasted results of the parameters of socio-economic development level: (a) GDP per capita; (b) electricity generation per capita; (c) grain yield per hectare; and (d) livestock rearing per capita.
3.1.4 Linking of sub-models
The models of water-quantity, water-quality and socio-economic systems are correlated and interdependent, and must be linked to simulate and forecast the interaction between the socio-economic and water-resource systems. The linking of the models is illustrated in . For analysis of the entire river basin, based on the input–output relationship of each sub-region shown in , all sub-regions of the river basin are combined.
Figure 5. Linking relationship of the three sub-models.
3.2 Calibration of the hydro-economic model
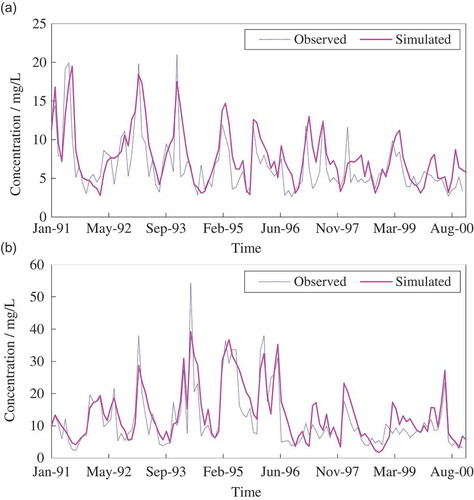
Both water quantity and quality were simulated using the developed model to investigate its applicability for representing the operational processes of the WQQSE systems. To illustrate effectively the simulation ability of the hydro-economic model, three indices, i.e. the average relative error, correlation coefficient and efficiency coefficient (Zhang et al. Citation2012, Citation2013), were used to describe the simulation precision. Both the flow and CODMn concentration were simulated using the model to investigate its applicability for representing their change processes. In the water-quantity simulation, 25 stations (66% of the total) had average relative errors within ±0.15. The average correlation coefficient was 0.72, and the average coefficient of efficiency was 0.50. In the water-quality simulation, there were 13 sections (54% of the cross-sections), for which the average relative error was less than 0.45. The average correlation coefficient was 0.65, and the average coefficient of efficiency was 0.41. The simulation results of the monthly flow and CODMn concentration at the Wangjiaba Hydro-junction (in the 22nd sub-region) and the Bengbu Sluice (in the 39th sub-region) cross-sections in 1991–2000 are shown as examples ( and ). From the simulation results we concluded that the model is satisfactory and reasonably represents the hydro-economic interaction.
Figure 6. Simulation results for water quantity: (a) flow at the Wangjiaba Hydro-junction cross-section, and (b) flow at the Bengbu Sluice cross-section.
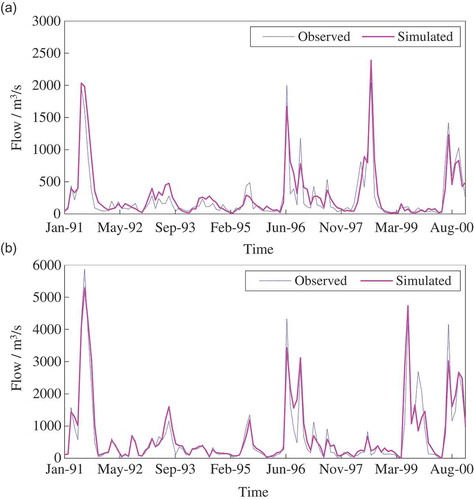
Figure 7. Simulation results for water quality: (a) CODMn concentration at the Wangjiaba Hydro-junction cross-section, and (b) CODMn concentration at the Bengbu Sluice cross-section.
4 Maximum socio-economic scale based on water-resource constraints
The developed hydro-economic model efficiently reflected the influence of socio-economic development of the Huaihe River basin on water quantity and quality. However, the current socio-economic-development mode may be unsustainable and risk resource exhaustion and environmental damage, which is not the ideal sustainable-development mode we are pursuing. Thus, it is necessary to find a suitable socio-economic scale that local water-resource conditions can tolerate, and so an optimal-control model (OCM) was developed.
4.1 Development of the optimal-control model (OCM)
The principles of the model are explained below. The objective is to find the largest socio-economic scale. The constraints should include at least the minimal requirement for material conditions at a certain development level and for water-environmental quality, restriction of the available water-resource quantity and in the interaction between the water-resource system and socio-economic system, among other restrictions. The interaction between the water-resource system and the socio-economic system is described by the hydro-economic model (Zuo Citation2005, Zuo et al. Citation2006).
Based on these principles, an optimal-control model was developed as follows:
4.1.1 Objective function
The objective of the OCM model is to search the maximum socio-economic scale of the Huaihe River basin. The socio-economic scale is usually represented by a series of indices (such as population, GDP, grain yield), so it will become a multi-objective optimization problem if all these indices are included in the objective function. For convenient solution of the OCM model, the other indices are regarded as changing proportionally with the index of the population. Therefore, the objective function is simplified to a single-objective function of the population, and can be expressed as:
where Pi is the population of the ith sub-region; and n is the total number of sub-regions.
4.2 Constraints
4.2.1 Simulation of the hydro-economic interaction
The hydro-economic model, which is regarded as an important constraint condition, is embedded in the OCM model. This constraint plays an important part in constructing the relationship between the objective function and all constraints, and in realizing the transfer and calculation of the data of the water-quantity system, water-quality system and socio-economic system.
4.2.2 Water-supply constraint
The total water use of each sub-region must be equal to or less than its available water supply:
where Wp, We, Wd are the productive, ecological and domestic water uses, respectively; and Was is available water supply, including the available surface water, available groundwater and transferred water from outside and wastewater re-use.
4.2.3 Water-quality concentration constraint
The calculated value of the water-quality concentration (C) of the representative water function area in each sub-region must be equal to or less than the corresponding control-objective value (CS):
In this study, 85 water-function areas were selected as the representative concentration-control nodes according to the following principles: (a) they are the major stream segments in the sub-regions; (b) they accept the largest mass of flow and pollutant influx in the local sub-regions; and (c) for sub-regions for which the hydraulic connections are very complex, the number of representative water-function areas can be increased appropriately.
4.2.4 River pollutant load-control constraint
The sum of the river pollutant load of point sources and non-point sources must be equal to or less than the water-environment capacity of all water functional zones in each sub-region (SS):
4.2.5 Socio-economic development-level constraint
The per capita GDP and per capita share of the grain of each sub-region must be equal to or greater than a certain living need:
where GDPa and FOODa are, respectively, the calculated value of the per capita GDP and the per capita share of grain; GDPS and FOODS are, respectively, the living need of the per capita GDP and the per capita share of grain.
The OCM model is composed of these objective functions and constraints. Using the numerical iterative method, an approximate optimal solution that obeys all the constraints is obtained.
4.3 Results and discussion
Applying the OCM model, the largest sustainable socio-economic scale of the Huaihe River basin was obtained for different years (2010, 2020 and 2030). The calculation conditions used are given in .
Combined with the calculation conditions, the sustainable socio-economic scale of each sub-region based on the water-resource constraints was calculated by the OCM model. The calculation result of each sub-region and the total sustainable socio-economic scale of the river basin were obtained. In , showing the simulation results, the actual values of the socio-economic scale of the Huaihe River basin are the real data in 2005 obtained from the relevant statistical data provided by HRWCC. The forecasted values are from the forecasted results of the hydro-economic model for 2010, 2020 and 2030, according to the planning-development goals rather than adopting additional water-resource control measures. The sustainable values are the calculation results of the socio-economic scale that satisfies all the constraints of the OCM model. If the actual (or forecasted) values are greater than the sustainable values, their differences are the overload values; otherwise, the overload values are zero.
From the results of the calculation, the following conclusions can be drawn:
The actual socio-economic scale of the entire river basin is greater than the sustainable scale under present (2005) conditions, and 58% of the sub-regions are overloaded and unsustainable. The sustainable sub-regions mainly lie in the areas along the mainstream and on the lower reaches of the Huaihe River, whereas the others mainly lie in the areas in the middle and upper reaches of the river.
The forecasted socio-economic scale of the entire river basin is still greater than the sustainable scale under the planning conditions, and in 2010, 2020 and 2030, respectively 75%, 75% and 68% of the sub-regions are overloaded and unsustainable. This shows that the problem of the socio-economic scale overload will be severe in future if the socio-economy of the Huaihe River basin develops as currently planned.
The water-resource condition is one of the pivotal factors restricting the development of the socio-economy in water-deficient areas such as Huaihe River basin. Both the basin’s gross amount of water resources and the population carrying capacity in 2005 are greater than those in the planning years because the actual hydrological conditions in 2005 were wet (it was a wet year), whereas the design hydrological condition for the planning years is a normal year.
The influence of the socio-economic development in the future on the water-resource system is mutual: on the one hand, the acceleration of the urbanization process and the expansion of the socio-economic scale will lead to the growth of the average per capita water use and wastewater discharge; on the other hand, the sustainable socio-economic scale will increase with the improvement of water-saving technology and wastewater-treatment technology. Because the economic scale, urbanization process, sewage treatment rate and utilization of water resources all change with time, the sustainable socio-economic scale increases slowly in the early stage of the planning period (from 2006 to 2020), when economic development is dominant, but increases quickly in the later planning period (from 2021 to 2030), when water conservation and environmental protection are dominant.
5 Choice of water-resource control schemes
The results show that the socio-economic scale of the Huaihe River basin will be in an overloaded state if it develops according to the planning-development mode. Therefore, the best of the control schemes that meet the requirements of sustainable development should be selected.
5.1 Design of the control schemes
The research idea for improving the sustainable socio-economic scale of the Huaihe River basin is to obtain more available water resources, but this is restricted by two factors: the water-quantity condition (i.e. abundant water supply) and the water quality condition (i.e. clean water supply). Therefore, the design of control schemes is mainly considered from the two aspects of water-environment treatment measures (including measures for point-source treatment and non-point-source treatment) and water-resource high-efficiency utilization measures (including measures of water conservation and increasing water supply). By combining these measures, we obtain many control schemes, and only eight typical schemes are selected in .
In , both schemes 1 and 2 are designed on the basis of measures of point-source treatment. The former is achieved by expanding the coverage rate of the sewage-pipe network (resulting in an increase of the wastewater-treatment efficiency τ), and the latter is achieved by implementing deep treatment of the discharged wastewater (resulting in a decrease of the standard discharge concentration of urban wastewater C0). Scheme 3 is designed based on the measure of non-point-source treatment, such as the prevention of water and soil loss, and is achieved by reducing the pollutant-producing coefficient of the surface runoff Cn. Schemes 4 and 5 are designed on the basis of measures of water-resource high-efficiency utilization, in which Scheme 4 adopts a measure of improving the scale of urban wastewater reuse (resulting in an increase of the wastewater-reuse ratio rw), and Scheme 5 adopts a measure of agricultural water saving (resulting in an increase of the irrigation water-utilization coefficient ra). Scheme 6 is designed based on measures of point-source treatment and water conservation and is achieved by decreasing C0 and increasing τ, ra and ri (i.e. the industrial water-recycling rate). All of the above measures are used in schemes 7 and 8: Scheme 7 is an ideal control scheme without considering the economic cost, and Scheme 8 is an optimal scheme considering the economic cost and effect simultaneously.
5.2 Results and discussion
The parameters designed in and the calculation conditions designed in are simultaneously applied in the OCM model to calculate the sustainable socio-economic scale of the Huaihe River basin for each scheme. The calculation results for the planning year are given in .
Table 1. Calculation conditions of the OCM model.
Table 2. Comparison of actual/forecasted and sustainable socio-economic scale of the Huaihe River basin.
Table 3. Schemes for enhancing the sustainable scale.
Table 4. Sustainable and overloaded socio-economic scales for each scheme.
According to the calculation results, several conclusions can be drawn:
For the control schemes that adopt only a water-environment treatment measure, the effect of Scheme 1 on enlarging the sustainable socio-economic scale is most obvious; the effect of Scheme 2 is less, and of Scheme 3 is much smaller. This shows that point-source treatment is more important than non-point-source treatment and that enhancing the wastewater-treatment efficiency should be the dominant direction of the water-environment treatment work of the Huaihe River basin in future.
For the control schemes that adopt only water-resource high-efficiency utilization measures, the effect of enhancing the irrigation water-utilization coefficient (Scheme 5) is somewhat better than that of enhancing the wastewater-reuse ratio (Scheme 4), which will be effective only when the ratio is higher than 40%. Therefore, both the increase of sources and water conservation are necessary for the Huaihe River basin in future, and agricultural water conservation will be the most important.
The effect of adopting both the water-environment treatment measures and the water-resource high-efficiency utilization measures is better than that of adopting a single measure. The reason is that the main restrictive factors of socio-economic development differ in the various sub-regions: in certain sub-regions, the influence of the water-quantity constraint is prominent, whereas in others the influence of the water-quality constraint is prominent. Therefore, only when the restrictive factors are considered simultaneously can the problem of inconsistency between socio-economic development and water-resource exploitation be solved efficiently. For example, schemes 6–8 adopt both types of measures, so the sustainable socio-economic scales of schemes 6–8 are greater than those of schemes 1–5, and the numbers of overloaded sub-regions in schemes 6–8 are smaller than those in schemes 1–5.
Comparing the sustainable socio-economic scale in the designed schemes with the forecasted scale in the planning-development level (), shows that the sustainable population and GDP in schemes 1–6 cannot meet the future socio-economic development. The sustainable scale in Scheme 7 is greater than the forecasted requirement, but is uneconomic and impractical because of excessive investment. Scheme 8 is the optimal scheme that not only meets future requirements but is also reasonable and feasible. It is worth mentioning that certain sub-regions remain in an overloaded state even if Scheme 8 is used. The main reason is that the spatial differences of the water-resource conditions and the socio-economic-development levels among the sub-regions lead to an inconsistent rate of development between certain sub-regions and the entire river basin. Therefore, a further adjustment to the parameters of the water-environment treatment and water-resource optimal allocation of the overloaded sub-regions is made. The calculation results show that all of the sub-regions can meet their development requirements in 2030 after the adjustment. The characteristic values of the parameters in Scheme 8 are illustrated in .
Figure 8. Comparison between the population and GDP in the schemes and planning mode.
Table 5 Characteristic values of the parameters in Scheme 8.
6 Conclusions
A hydro-economic model that can simultaneously describe the linked systems of water quantity–water quality–socio-economics (WQQSE) was developed to represent the hydro-economic interaction of the Huaihe River basin in China. Based on the hydro-economic model, an optimal-control model was also developed and used to choose the best scheme for controlling the WQQSE systems of the river basin in future. The results demonstrate that the models developed can be used to reasonably simulate the processes of the WQQSE systems and to provide useful information on how to control hydro-economic interactions in densely populated regions.
With these models, two major insights into the hydro-economic interaction of the Huaihe River basin were obtained: (a) the hydro-economic interaction of the river basin is complex and restricted by many factors involving the social, economic and environmental systems; and (b) if the socio-economic development follows the current planning mode, the river basin will always be in an overloaded state. This shows that the water-resource condition of the river basin cannot match with local socio-economic scale. Based on the simulation and the control study, feasible management strategies for controlling the hydro-economic interaction are obtained, which can effectively guide the development direction of the river basin for the future.
Although the models are developed to resolve the conflict between socio-economic development and water-environment protection in the Huaihe River basin, the methodology and framework developed in this study may potentially be applied for simulating and controlling the hydro-economic interaction of other areas because the processes are similar, in principle. However, the approach requires verification through further studies that are beyond the scope of the present study.
Disclosure statement
No potential conflict of interest was reported by the authors.
Additional information
Funding
References
- Barthel, R., Nickel, D., and Meleg, A., 2005. Linking the physical and the socio-economic compartments of an integrated water and land use management model on a river basin scale using an object-oriented water supply model. Physics and Chemistry of the Earth, Parts A/B/C, 30, 389–397. doi:10.1016/j.pce.2005.06.006
- Brouwer, R. and Hofkes, M., 2008. Integrated hydro-economic modelling: approaches, key issues and future research directions. Ecological Economics, 66, 16–22. doi:10.1016/j.ecolecon.2008.02.009
- Cao, Y.Q., et al., 2010. Quantitative analysis on harmonious socio-economy development with water resources utilization in Liaoning province. Journal of Hydroelectric Engineering, 29, 80–84.
- Dou, M., Zuo, Q.T., and Hu, R., 2010. Carrying capacity of water environment in the Huaihe River basin. Advance Water Science, 21, 248–254.
- Georgea, B., et al., 2011. An integrated hydro-economic modelling framework to evaluate water allocation strategies I: model development. Agricultural Water Management, 98, 733–746. doi:10.1016/j.agwat.2010.12.004
- Golubev, G.N., 1983. Economic activity, water resources and the environment: a challenge for hydrology. Hydrological Sciences Journal, 28 (1), 57–75. doi:10.1080/02626668309491143
- Guan, D.B. and Hubacek, K., 2008. A new and integrated hydro-economic accounting and analytical framework for water resources: a case study for North China. Journal of Environmental Management, 88, 1300–1313. doi:10.1016/j.jenvman.2007.07.010
- Harou, J.J., et al., 2009. Hydro-economic models: concepts, design, applications, and future prospects. Journal of Hydrology, 375, 627–643. doi:10.1016/j.jhydrol.2009.06.037
- Heinz, I., et al., 2007. Hydro-economic modeling in river basin management: implications and applications for the European water framework directive. Water Resources Management, 21, 1103–1125. doi:10.1007/s11269-006-9101-8
- Koutsoyiannis, D., 2011. Scale of water resources development and sustainability: small is beautiful, large is great. Hydrological Sciences Journal, 56 (4), 553–575. doi:10.1080/02626667.2011.579076
- Kragt, M.E., 2013. Hydro-economic modelling in an uncertain world: integrating costs and benefits of water quality management. Water Resources and Economics, 4, 1–21. doi:10.1016/j.wre.2013.11.001
- Letcher, R.A., Croke, B.F.W., and Jakeman, A.J., 2007. Integrated assessment modelling for water resource allocation and management: a generalised conceptual framework. Environmental Modelling & Software, 22 (5), 733–742. doi:10.1016/j.envsoft.2005.12.014
- Loucks, D.P., Stedinger, J.R., and Haith, D.A., 1981. Water resources systems planning and analysis. Englewood Cliffs, NJ: Prentice-Hall.
- Lund, J.R. and Ferreira, I., 1996. Operating rule optimization for Missouri River reservoir system. ASCE: Journal of Water Resources Planning and Management, 122 (4), 287–295.
- Maal-Bared, R., 2006. Comparing environmental issues in Cuba before and after the Special Period: balancing sustainable development and survival. Environment International, 32, 349–358. doi:10.1016/j.envint.2005.08.002
- Maass, A., et al., 1962. Design of water-resources systems. Cambridge, MA: Harvard University Press.
- Medellín-Azuara, J., et al., 2009. Virtues of simple hydro-economic optimization: Baja California, Mexico. Journal of Environmental Management, 90, 3470–3478. doi:10.1016/j.jenvman.2009.05.032
- Peña-Haro, S., Pulido-Velazquez, M., and Sahuquillo, A., 2009. A hydro-economic modelling framework for optimal management of groundwater nitrate pollution from agriculture. Journal of Hydrology, 373, 193–203. doi:10.1016/j.jhydrol.2009.04.024
- Sánchez-Chóliz, J. and Duarte, R., 2005. Water pollution in the Spanish economy: analysis of sensitivity to production and environmental constraints. Ecological Economics, 53, 325–338. doi:10.1016/j.ecolecon.2004.09.013
- Sivakumar, B., 2011. Water crisis: from conflict to cooperation—an overview. Hydrological Sciences Journal, 56 (4), 531–552. doi:10.1080/02626667.2011.580747
- Velázquez, E., 2006. An input-output model of water consumption: analysing intersectoral water relationships in Andalusia. Ecological Economics, 56, 226–240. doi:10.1016/j.ecolecon.2004.09.026
- Zhang, Y., et al., 2012. Experimental and simulation studies on the impact of sluice regulation on water quantity and quality processes. ASCE: Journal of Hydrologic Engineering, 16 (4), 467–477.
- Zhang, Y., et al., 2013. Water quantity and quality simulation by improved SWAT in highly regulated Huai River basin of China. Stochastic Environmental Research & Risk Assessment, 27, 11–27. doi:10.1007/s00477-011-0546-9
- Zuo, Q.T., 2005. Theory, method and practice on water resources carrying capacity in cities. Beijing, China: Chemical Industry Press.
- Zuo, Q.T., Dou, M., and Chen, X., 2006. Physically-based model for studying the salinization of Bosten Lake in China. Hydrological Sciences Journal, 51 (3), 432–449. doi:10.1623/hysj.51.3.432