
Abstract
In the absence of well-documented pumping tests, we investigate whether a reliable estimate of transmissivity T can be obtained using historical records of specific capacity data in granular and fractured-rock aquifers. Transmissivity values are calculated from the specific capacity data Q/s in several hundred wells located in the Saguenay-Lac-Saint-Jean region (Canada), with an iterative method applied to the Cooper-Jacob equation. The results are compared with short- and long-duration pumping tests performed throughout the region. We demonstrate that values of transmissivity compare well between the different types of tests for each lithology, when the scale of the test is similar. Therefore, using historical information easily increases the number of transmissivity values that can be estimated over a region. These values can be integrated in regional numerical models. Moreover, this study shows that T = 4.48(Q/s)1.15 with R2 = 0.66 for granular aquifers. This new empirical relationship can be used in similar environments.
Editor D. Koutsoyiannis Associate editor C. Leduc
1 Introduction and background
In the populated area of the Saguenay-Lac-Saint-Jean region (SLSJ) in the province of Quebec in Canada, about 30% of the population uses groundwater for domestic drinking-water supply (municipalities and private properties) and this proportion is increasing (CERM-PACES Citation2013). Very little consideration was given to groundwater management in the SLSJ region before 2008, and the aquifers were poorly understood. The efforts of both governmental and regional public entities led to regional aquifer characterization projects in the most populated regions of the Quebec Province, including the SLSJ region (MDDEP Citation2013). The hydrogeological characterization of the SLSJ aquifers has been conducted within this groundwater mapping programme entitled “Programme d’Acquisition de Connaissances sur les Eaux Souterraines du Québec” (PACES—Groundwater Knowledge Acquisition Programme) with the objective of characterizing the quantitative and qualitative aspects of groundwater resources (CERM-PACES Citation2013, MDDEP Citation2013). This project has established a groundwater database by compiling existing and new hydrogeological data (Chesnaux et al. Citation2011) in the SLSJ region, using the geographical information system code ArcGISTM 9.3 (ESRI Citation2008). The characterization of the hydraulic properties of aquifers (mainly transmissivity and hydraulic conductivity) is part of the objectives of the PACES, which motivated the present study.
The most recognized and reliable method to calculate the transmissivity of an aquifer is to perform a long-duration pumping test where measurements over time (t) of drawdown (s) are collected during generally 72 h of pumping, and then drawing a curve of s vs t and determining the transmissivity. However, performing such tests is time-consuming and expensive, which results in a low density of these tests performed within a region. Most of the time, only specific-capacity tests are abundantly available over a region, where only one value of the drawdown is measured at the pumping well at the end of pumping. These tests are often performed on private wells when the owners need to know whether their well can supply and sustain their water demands. In this case however, no curve of s vs t can be obtained, and the usual interpretation methods like Theis (Citation1935) or Cooper and Jacob (Citation1946) cannot be used. Analytical approaches using specific-capacity data in steady-state conditions were developed by Dupuit (Citation1863) in unconfined aquifers and by Thiem (Citation1906) in confined aquifers. The Thiem (Citation1906) equation, for example, applicable in a well that fully penetrates an isotropic and homogeneous aquifer, can be written as:
Bradbury and Rothschild (Citation1985) established a method to estimate the transmissivity using specific capacity data in transient flow by proposing an iterative method applied to the Cooper and Jacob (Citation1946) approximation given as follows:
Empirical relationships between the transmissivity T and the specific capacity Q/s measured in the same well have also been established by several authors (e.g. Huntley et al. Citation1992, El Naqa Citation1994, Mace Citation1997, Hamm et al. Citation2005, Verbovšek Citation2008). For most of these studies, T was calculated with the Theis (Citation1935) or Cooper and Jacob (Citation1946) methods in transient flow and Q/s was taken after a specific duration of pumping, or after a steady-state regime was reached in constant-rate tests or in step drawdown tests. At least 25 well-recorded pumping tests (i.e. 25 pairs of (T; Q/s)) are needed for establishing a fair relationship (Mace Citation2001). Most of authors found that T and Q/s were log-log related with a general form equation expressed as T = α(Q/s)β, where α and β are dimensionless coefficients. However, the relationship would be site specific (Razack and Lasm Citation2006, Rotzoll and El-Kadi Citation2008). According to Mace (Citation2001), only carbonate aquifers present numerous established empirical relationships that are similar to each other, and therefore can be used for a valid estimate of the transmissivity from specific capacity data in other carbonate aquifers. However, well-documented pumping tests can be scarce over a region, and therefore establishing a relationship is difficult. This is the case in the Saguenay-Lac-Saint-Jean aquifers.
Transmissivity (and hydraulic conductivity K) is often reported to be scale dependent in heterogeneous media (e.g. Rovey Citation1994, Schultze-Makuch and Cherkauer Citation1998, Schulze-Makuch et al. Citation1999). The scale dependency can be attributed to the presence of interconnected high-T conduits that lead to high-T values as the scale of the test increases (e.g., Rovey and Cherkauer Citation1995, Schultze-Makuch et al. Citation1999, Raghavan Citation2006). According to Butler and Healey (Citation1998), scale effects are an artifact of the different experimental techniques used and small K values obtained from small-scale tests are mainly due to well development and vertical anisotropy. It is important that scale effects be considered for evaluating the representativeness of the hydraulic properties determined using specific capacity tests.
In this paper, we investigate the possibility and reliability of estimating the transmissivity using the numerous available specific capacity tests in the SLSJ region. The objective is to develop a better description of hydraulic properties of aquifers over the region. This paper presents first the iterative method used to evaluate transmissivity when only one value of specific capacity data is available. In the present study, 1415 values of specific capacity obtained from the Hydrogeological Information System (Système d’Information Hydrogéologique (SIH); MDDEP Citation2011) are used ( and ). Secondly, the calculated values are compared with values of transmissivity from long- and short-duration pumping tests available in the region and for each lithology (anorthosite, gneiss, granite, granular). Here we propose to analyse and compare the values obtained with the statistical analysis ANOVA (analysis of variance, frequently used in hydrology, Helsel and Hirsch Citation2002). This comparative study has never been conducted before on such a large amount of wells in a region. The scale effects on transmissivity are also investigated. A new relationship between transmissivity and specific capacity for granular aquifers is also proposed and compared with other existing relationships. The results will contribute to the development of a cost-effective tool for practitioners to estimate the hydraulic properties of aquifers and their reliability at a regional scale.
Figure 1. Location of the wells and types of hydraulic tests performed in fractured-rock aquifers in the SLSJ region; bedrock lithology is also shown (simplified from Avramtchev Citation1993).
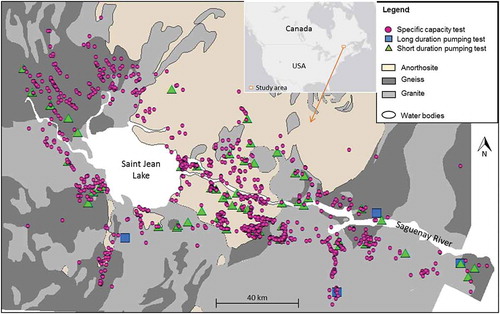
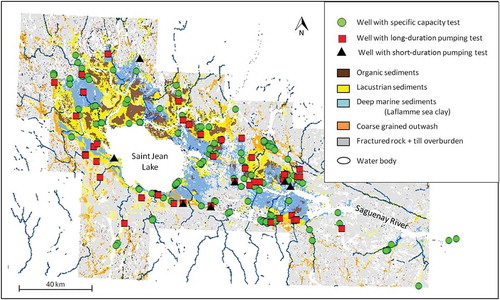
Figure 2. Location of the wells and types of hydraulic tests performed in granular aquifers in the SLSJ region; surficial deposits are indicated on the background map (modified from Walter et al. Citation2011).
2 Study area and data source
2.1 Study area
The study area is composed of the central segment of the Saguenay River watershed in the province of Quebec, Canada. This area covers approximately 13 200 km2 (), and it is oriented WNW-ESE along a tectonic graben.
The stratigraphy can be summarized as granular units overlying bedrock. These granular units, mostly composed of sand and gravel, constitute productive aquifers where the saturated thickness is more than 10 m. A clay and silt layer is also present in the lowlands, originating from the ancient Laflamme Sea that covered the area about 10 000 years ago; it creates confining conditions for aquifers located underneath (Rouleau et al. Citation2011; ). The bedrock is mostly crystalline and is composed of three main lithologies: anorthosite, gneiss and granite ().
2.2 Characteristics of the data used in the study
Three different sets of data are used in this study. The first set considers data obtained from specific capacity tests, the second set includes data from long-duration pumping tests and the last set comprises data from short-duration pumping tests.
The specific capacity dataset is composed of information obtained from numerous pumping wells and available in the Hydrogeological Information System (SIH data; MDDEP Citation2011). These wells are generally designed for private supply and residential use. Only the piezometric level at the end of pumping is measured and the time of pumping is often less than 2 h. This procedure is similar to a specific capacity test. In the case of the SIH data, our analysis assumes that the Cooper-Jacob conditions are met. More than 4000 wells are recorded in the SIH database for the SLSJ region. The minimum required data for each well to be included in this study is the well yield, the radius of the well, the geological facies of the different stratigraphic layers encountered, the pumping duration, the static water level and the dynamic water level at the end of pumping. For fractured-rock aquifers, only wells penetrating more than 2 m in the bedrock were considered, in order to obtain an accurate representation of the hydraulic properties of that type of aquifer. The mean length of open boreholes in the bedrock observed in the SLSJ region in our study is 55 m, with a maximum length of 137 m. A total of 1418 wells were included in the final dataset, with 1239 in fractured-rock aquifers and 179 in granular aquifers (), after deleting data for wells that do not meet the above-mentioned criteria, and after screening for the quality and the reliability of the data (Chesnaux et al. Citation2011). The bedrock lithology is not included in the SIH database. The nature of the bedrock is, however, available from existing geological maps of the bedrock summarized by Avramtchev (Citation1993). These geological maps have been simplified for the needs of our study to three main lithologies: anorthosite, gneiss and granite. The location of the wells has been superimposed over the bedrock lithology map, from the database established by Chesnaux et al. (Citation2011), in order to assign a lithology to each well. As a result, our dataset includes 549 wells located in anorthosite, 381 wells in granite and 309 in gneiss ().
The second set of data comprises municipal wells where long-duration pumping tests were conducted for the community water supply. The duration of the tests for this set ranges from 2.25 h to 155 days (note that 90% of the tests last more than 20 h). The drawdown is measured directly in the pumping well. Fifty-eight of these tested wells are located in granular aquifers () and four are located in fractured-rock aquifers (). Granular layers are often more productive and consequently more prized for municipal water supply purposes requiring higher groundwater yields.
The last set of data refers to short-duration pumping tests (often less than 1 h) completed during the 2010 and 2011 PACES pumping-test campaign. The drawdown is also measured directly in the pumping well. Fifty-two of these wells are located in fractured-rock aquifers () whereas seven wells are located in granular aquifers ().
3 Methodology
3.1 Calculating the transmissivity from specific capacity tests
The theoretical background of methods to assess transmissivity includes, among others, the Cooper-Jacob approximation (1946; Equation (3)). This equation assumes that the aquifer is a homogeneous confined continuous porous media, and that the well totally penetrates the aquifer. Fractured-rock aquifers are likened to a continuous porous media in this study, where the flow geometry is supposed to be radial. This equation cannot be solved directly due to the presence of the term T in both the linear and the logarithmic terms. For usual pumping tests, a transmissivity estimate can be obtained from this equation by using a semilog graphical method, which consists of determining, under transient flow conditions, the slope of the curve s vs t on the linear phase of the curve where the Cooper-Jacob approximation is valid. However, no curve of s vs t can be obtained for the SIH data, as only one value of the drawdown is available at the pumping well at the end of pumping. An iterative method, inspired from Bradbury and Rothschild (Citation1985), can be applied to circumvent this problem and solve the Cooper-Jacob equation, by using the transformed equation:
The other parameters of equation (4) are either fixed values or values obtained from the SIH database. The storage coefficient S, for instance, is estimated based on the confining condition of the aquifer, which is determined from the stratigraphy. If a clay layer is present above the aquifer, it is assumed that the well is located in a confined aquifer. However, a thin clay layer may not constitute fully confined conditions for the underlying aquifer; an ‘unknown’ confining condition is applied in this case. A clay thickness of 50 cm is arbitrarily selected as the lower limit for assigning a confined condition to an aquifer. A storage coefficient S of 0.1 is applied for unconfined aquifers, a value of 0.00005 is assigned for confined aquifers (Todd Citation1980) and 0.001 for unknown confining condition. These values represent rough estimates of S according to the confining conditions. However, due to the presence of S in the logarithmic part of equation (4), its variations have a low impact on the final T value (Walton Citation1970) calculated with the iterative method.
For this study, a simple macro code in an Excel spreadsheet is used for solving equation (4) (Richard et al. Citation2011a, Citation2011b), as was similarly suggested by Mace (Citation2001). The results are statistically analysed using an ANOVA.
3.2 Comparison with long- and short-duration pumping tests
The final results of transmissivity values obtained from specific capacity tests are compared with values obtained from long- and short-duration pumping test results (Richard et al. Citation2012). The Cooper-Jacob graphical method is used to estimate the transmissivity for short-duration pumping tests (see the typical example plot in the supplementary material online). For long-duration pumping tests the transmissivity values, also obtained graphically with the Cooper-Jacob approximation, were obtained from the consulting reports. The statistical analysis ANOVA is used to quantify the observed differences between the sets.
3.3 Uncertainties and correction of transmissivity values
Uncertainties in the transmissivity values result partly from limiting assumptions considered in using the Cooper-Jacob equation. For example, the Cooper-Jacob equation is valid for confined aquifers. A correction for unconfined aquifers (Jacob Citation1944) can be applied to the observed drawdown:
The correction of drawdown for well losses and skin effects is not necessary for short- and long-duration pumping tests, because the T values were obtained with the slope of the Cooper-Jacob straight line. Correction of drawdown is nevertheless needed for specific capacity tests because only one value of s is used for the calculation of transmissivity. Step-drawdown test or drawdown-distance curve data are not available for this dataset, making the application of conventional methods of correction for well loss impossible. Not correcting for well loss may underestimate the transmissivity value of the aquifer.
The correction for partial penetration is not possible because the aquifer thickness is unknown for our datasets. The transmissivity may also be overestimated when using specific capacity tests if the drawdown value is measured after steady state is reached.
4 Results and interpretation
4.1 Transmissivity values from specific capacity tests and comparison with values from short- and long-duration pumping tests using an ANOVA
4.1.1 Fractured-rock aquifers
presents the results of mean, maxima, and minima values of the transmissivity determined for each rock lithology with specific capacity tests, and with short- and long-duration pumping tests.
Figure 3. The range in transmissivity, in m2/s, for each type of test and each rock lithology in the Saguenay-Lac-St-Jean region (logarithmic scale).
The transmissivity values of fractured-rock aquifers obtained from specific capacity tests encompass five orders of magnitude for anorthosite, granite and gneiss (). Nevertheless, transmissivity values are rather concentrated around the mean, and the data dispersion is σlogT = 0.64 for this group. Half of the values are between 10–5 and 3 × 10⁻⁴ m2/s, although a number of extreme values are observed. For example, anorthosite, granite and gneiss all have some surprisingly high transmissivity values around 10–2 m2/s. This may be explained by the presence locally of a very productive fracture, and/or to a direct connection with a nearby surface water body or a granular overlying aquifer. Anorthosite has an average transmissivity of 2.50 × 10⁻⁵ m2/s, which is lower than granite (6.23 × 10⁻⁵ m2/s) and gneiss (6.80 × 10⁻⁵ m2/s) which are almost equivalent. An ANOVA shows that there is no statistically significant difference between the means at the 1% level of significance, which means that transmissivity values for granite and gneiss sets form a homogeneous population. Conversely, the ANOVA demonstrates that the mean transmissivity for anorthosite is statistically different from the means transmissivity of gneiss and granite, indicating a lithological control on the transmissivity. This control may reside in the aquifer structure, as both granite and gneiss present mechanical anisotropy which facilitates the creation of large continuous fractures (Hebert et al. Citation1998), possibly increasing the presence of transmissive flow paths. Anorthosite is younger, more massive and presents few continuous fractures and less shear zones than granite and gneiss (Hebert et al. Citation1998), resulting in lower transmissivity values.
For short-duration pumping tests, the range of transmissivity values is over two orders of magnitude for anorthosite and gneiss and almost three orders of magnitude for granite. The data dispersion is σlogT = 0.49 for short-duration pumping tests. Anorthosite has an average transmissivity of 3.36 × 10⁻⁶ m2/s, which is almost one order of magnitude lower than granite and gneiss which are almost equivalent (respectively, 1.70 × 10⁻⁵ m2/s and 1.04 × 10⁻⁵ m2/s). An ANOVA test shows that, at the 1% level of significance, for short-duration pumping tests, transmissivity values for anorthosite present a statistically different set from transmissivity values of granite and gneiss which form a homogeneous population. This result is similar to that for specific capacity tests described above, supporting the hypothesis that the aquifer transmissivity is controlled by lithology and structure.
As only four values are available for long-duration pumping tests, no statistical analysis was performed. We nevertheless observed that these values are high, probably because the well locations were targeted to highly productive zones for community water supply, whereas for wells used for domestic supply the location is limited to local land property areas.
The geometric mean T value for all lithologies is smaller for short-duration pumping tests (7.67 × 10⁻⁶ m2/s) than for specific capacity tests (4.25 × 10⁻⁵ m2/s). An ANOVA between the specific capacity test set and the short-duration pumping test set shows that for anorthosite, gneiss and granite, the means are statistically different from one test to another at the 1% level of significance. Thus the type of test (specific capacity or short duration) represents a significant factor for the estimated transmissivity values. This can be due to different test scales being investigated by these two types of tests; this is discussed in Section 4.2.1.
4.1.2 Granular aquifers
The general trend for the three types of test for granular aquifers is similar to the case of fractured-rock aquifers, i.e. the mean transmissivity values are higher for long-duration pumping tests than for specific capacity tests, and they are the lowest for short-duration pumping tests (). Specific capacity tests from granular aquifers yield transmissivity values ranging over five orders of magnitude, between 4.30 × 10⁻⁶ m2/s and 5.67 × 10⁻¹ m2/s. The geometric mean is 1.02 × 10⁻³ m2/s, which represents a typical value for sandy aquifers present in the major part of the SLSJ region. The geometric mean transmissivity of aquifers estimated from short-duration pumping tests is 1.52 × 10⁻⁴ m2/s, while for long-duration pumping tests, the geometric mean is more than one order of magnitude higher, that is to say 8.81 × 10⁻³ m2/s. These long-duration tests may be performed in more productive zones for community water supply. An ANOVA confirmed that the long-duration pumping test results and specific capacity test results are statistically different at the 1% level of significance. Short-duration pumping tests were not considered in the ANOVA because of the low number of values. Nevertheless, it appears in that the short-duration pumping test set represents a statistically different group from the other types of test. This shows that the estimated T values depend on the type of the test for granular aquifers, as for fractured-rock aquifers.
Figure 4. The range in transmissivity, expressed in m2/s, for granular formations and for each type of test in the Saguenay-Lac-Saint-Jean region (logarithmic scale).
4.2 Investigation of scale effects
4.2.1 Visible scale effects within all data
The statistical dependence of the estimated T values on the type of test being performed may in part be due to a scale effect, i.e. related to the extent of the investigated aquifer. Investigating scale is related to the duration of the test; the longer the pumping duration, the farther the position of the pressure wave front, corresponding to a radial distance r from the well. In the absence of multiple observation wells, r can be estimated from the Cooper-Jacob distance-drawdown equation:
Figure 5. Transmissivity vs pumping time for each type of test in (a) anorthosite, (b) gneiss-granite (logarithmic scale).
The transmissivity values from specific capacity tests clearly illustrate a scale effect as a large range of pumping durations is considered in this set. This observation explains the high range of transmissivity values for specific capacity test sets (over five orders of magnitude).
In , it also appears that the higher the pumping time, the higher the transmissivity. This result explains why the geometric mean of estimated T for long-duration pumping tests is the highest. The transmissivity values from specific capacity tests clearly illustrate the scale effect within the same type of test as a large range of pumping durations is considered in this set. The scale effect is then also present for granular aquifers and may be due to facies heterogeneity. Well loss and skin effects due to well construction (well-screen open area, well development …), and effects of partial penetration (not considered) may also participate in a minor proportion to the visible scale effect for specific capacity data.
Figure 6. Transmissivity vs pumping time for each type of test in granular aquifers (logarithmic scale).
Interestingly, the transmissivity values in a given range of pumping time are similar for the different tests. This observation tends to confirm the use of specific capacity tests for estimating the transmissivity at a given scale.
To summarize, it is observed from and that T clearly increases with test scale for specific capacity tests. Two reasons can explain this apparent scale effect: the heterogeneity of the medium with the likelihood of connecting with high-permeability zones as scale increases and/or the bias due to not correcting for well loss and well skins and partial penetration (especially in granular aquifers). No scale effect is visible within short- and long-duration pumping tests because the ranges of t are similar. Nevertheless, long-duration pumping tests present higher T values than short-duration pumping tests. These values, estimated from the slope of Cooper-Jacob, are independent of well loss and well skins, which shows that scale effect is at least partly due to natural processes.
4.2.2 Scale effects within a single test and validation of the iterative method results
In order to test the hypothesis that T increases with test duration and that this scale dependence is a function of the heterogeneity of the medium, we evaluated trends in the transmissivity values within the same pumping test, by using the “five-point method” of Schulze-Mackuch and Cherkauer (Citation1998). This method consists of calculating an apparent transmissivity from discrete time intervals within semi-log linear responses. The first apparent transmissivity value is calculated from the first five data points of the linear response using the Cooper-Jacob method (the change in drawdown is used between the first and last point). Then the first point of the series is omitted and the sixth data point is added to, and another T value is calculated with this second data point series. This process continues until the end of the Cooper-Jacob linear response. The obtained time-interval apparent transmissivities are plotted against the mean time of each five-point series (). The plot is supplemented by the log-derivative drawdown signal ds/dlogt as a function of pumping time, in order to evaluate the causes of the variations of transmissivity values during the pumping. Indeed, the log-derivative drawdown curve is particularly sensitive to variations induced by the different flow geometries due to structural heterogeneities encountered during the test (e.g., Bourdet et al. Citation1989, Rafini and Larocque Citation2009). Four examples extracted from consultant reports (long-duration pumping test sets) are given in . In (a), a short decrease of the apparent T is followed after 6000 s by an increasing apparent T with time. At the same time (6000 s) apparent T starts to increase, the log-derivative signal shows a change of slope, which means that the pumping is meeting a new flow geometry which is more transmissive (maybe a high permeability conduit). The log-derivative signal is noisy after 50 000 s which may be associated with a fluctuating discharge rate Q; it cannot be interpreted then. The hydraulic behaviour of the fractured-rock aquifer in (b) is similar to the previous one; an increasing apparent T is associated with a new flow geometry. Additional information on the cross-section shows that the pumping well is located in a depressurized bedrock zone covered by a thick clay deposits. When peak is reached in the log-derivative signal at around 5000 s the wave front is theoretically (equation (7)) positioned at 150 m; this distance corresponds in the cross-section to a sharp break-slope of the rock. This structural change implies a new flow geometry leading to higher apparent T (it may be more interconnected fractures). In (c), two semi-log linear responses can be observed, corresponding to two steps of radial flow in the log-derivative signal (zero slope). Each radial flow period corresponds to a constant apparent T; with the second apparent T being higher. This observation translates as facies heterogeneity and more specifically a horizontal anisotropy. (d) is a counterexample as the apparent T is decreasing with the time of pumping, probably because pumping meets a less transmissive zone. This analysis confirms that the heterogeneity of the medium (alternating high- and low-permeability zones) is the main reason for the transmissivity being scale dependant. Generally, T would increase with scale as there is more chance of meeting higher-permeability zones as scale increases.
Figure 7. Upper graph: curves s and ds/dlogt as a function of time; lower graph: scale dependency of time-interval apparent transmissivity and iterative transmissivity. (a) and (b) both represent a long-duration pumping test in a fractured-rock aquifer; (c) and (d) both represent a long-duration pumping test in a granular aquifer. Data source: personal communication.
The iterative method used in this paper can be tested by applying equation (4) for each pair (s; t) on the previous long-duration pumping tests (). The results show that the estimation using the iterative method works better on late pumping time, although for small pumping duration the difference is less than one order of magnitude, which is considered as acceptable regarding the restrictive hypothesis made. For that matter, the estimation is better when flow is clearly radial ((c) and (d)) which is logical as it respects the Theis hypothesis. This result indicates that specific capacity tests can be reliably used to estimate transmissivity.
The tested iterative method, however, fails to highlight the scale effect within a single well test and there are at least two reasons for that. First, the method is valid when the flow is radial, which is often not the case. Secondly, iterative T is extracted from only one point instead of a slope which increases the uncertainty on s(t) and an assumption on the storage coefficient value is required.
Figure 8. Log-log plot of transmissivity vs specific capacity for granular aquifers submitted to long-duration pumping tests.
4.3 Empirical relationship between transmissivity and specific capacity
An empirical relationship is established between the calculated transmissivity and the specific capacity in steady-state conditions for long-duration pumping test data in granular aquifers (). The other datasets, including fractured-rock aquifers, cannot be considered for establishing a correlation for one or more of these reasons: (i) the steady-state condition has not been reached, (ii) there are not enough data available in the dataset, (iii) only one value of time-drawdown (s; t) is available. The resulting best-fit line for granular aquifers is:
Table 1. Empirical relationships between T and Q/s obtained in different studies from different granular aquifers.
This relationship is independent of scale effects, and gives a first estimate of the transmissivity value from the specific capacity data for future water wells in the SLSJ region. It can also be useful for other similar aquifers.
plots the coefficients α and β of the empirical relationships from and also coefficients α and β obtained from other studies in fractured-rock aquifers (as similarly done by Al Farrah et al. Citation2013). The relationship obtained here between the coefficients α and β is, for T and Q/s given in m2/s:
Figure 9. Comparison of coefficient α versus coefficient β for different empirical relationships between T and Q/s.
with R2 = 0.62.
The obtained couple (α; β) in this study agrees with coefficients from other studies regarding the correlation between coefficients α and β. Interestingly, it is noticed that coefficients from granular aquifers (including our study) fall in line with the relationship:
with R2 = 0.92.
5 Discussion and conclusion
In the absence of well-documented aquifer conditions and complete pumping tests, a reliable statistical and spatial description of hydraulic properties has been achieved in the SLSJ aquifers. Indeed, values of transmissivity were calculated from specific capacity tests for Saguenay-Lac-Saint-Jean aquifers using a simple iterative method. Interestingly, the mean value of transmissivity in granular aquifers (1.02 × 10⁻³ m2/s) is around 20 times higher than for the fractured-rock aquifers (4.25 × 10⁻⁵ m2/s). This is expected since granular aquifers are known to be more productive than the rock aquifers present in that region and most of the municipal wells are located in granular aquifers for this reason. The estimated transmissivity values were then compared with values obtained from short- and long-duration pumping tests available in the region. Transmissivity values obtained from short- and long-duration pumping tests are similar to those obtained from specific capacity tests for a given range of pumping duration. Moreover, the iterative method was verified on long-duration pumping tests and T values agree within an order of magnitude. For these reasons, transmissivity values obtained from specific capacity tests with the iterative method can be considered as reliable estimates at a defined scale. These additional data increased the density of transmissivity values over the region from 1 per 3300 km2 with long-duration pumping tests to 1 per 10.6 km2 in fractured-rock aquifers. For granular aquifers, the T calculated with specific capacity tests increased the density of transmissivity values over the region from 1 per 228 km2 to 1 per 55.7 km2. This is significant as a larger number of data can lead to better interpolations of the hydraulic property values for a regional study, and hence an improvement in the accuracy of numerical models. These T values, because they are numerous, also demonstrate the existence of scale effects which are mainly due to aquifer heterogeneity by alternating low- and high-permeability zones. Indeed, T values generally increase with the pumping duration because there is generally more chance of meeting high-permeability zones or preferential pathways as test scale increases. Values of T based on small-scale measurements, as they are generally underestimated (under the equivalent homogeneous medium), can also be integrated in the regional model with adapted interpolation procedures taking into account the investigated scale (see example procedure in Nastev et al. Citation2004).
Specific capacity data are generally abundant worldwide in regions where the populations depend on groundwater resources for their water supply. Using this pre-existing information considerably increases, at a low cost, the number of hydraulic property values estimated in a region, and thus allows for a better regional characterization of aquifers.
Finally, a new empirical relationship between T and Q/s has been established for granular aquifers. The resulting best fit line is T = 4.48(Q/s)1.15 with a correlation coefficient of 0.66. This relationship, independent of scale effects, allows for a fast and easy estimation of the transmissivity of the tested aquifer while conducting a specific capacity test, and can be useful for similar environments.
Disclosure statement
No potential conflict of interest was reported by the authors.
Supplemental_online_material.pdf
Download PDF (180.6 KB)Acknowledgements
The authors would like to acknowledge the contribution to the paper of all individuals from the PACES project at UQAC, especially Ms. Annie-Pier Elliott for short-duration pumping test data.
The authors also thank two anonymous reviewers, the co-editor Prof. Demetris Koutsoyiannis and the associate editor Dr Christian Leduc for their comments and advice that greatly improved the quality of this manuscript.
Additional information
Funding
References
- Al Farrah, N., Van Camp, M., and Walraevens, K., 2013. Deducing transmissivity from specific capacity in the heterogeneous upper aquifer system of Jifarah Plain, NW-Libya. Journal of African Earth Sciences, 85, 12–21. doi:10.1016/j.jafrearsci.2013.04.004
- Avramtchev, L., 1993. Carte minérale de la région du Saguenay-Lac-Saint-Jean. Quebec: Ministère de l’énergie et des ressources du Québec. Register number PRO9307.
- Bourdet, D., Ayoub, J.A., and Pirard, Y.M., 1989. Use of pressure derivative in well-test interpretation. SPE Formation Evaluation, June, 293–302.
- Bradbury, K.R. and Rothschild, E.R., 1985. A computerized technique for estimating the hydraulic conductivity of aquifers from specific capacity data. Ground Water, 23 (2), 240–246. doi:10.1111/j.1745-6584.1985.tb02798.x
- Butler Jr., J.J. and Healey, J.M., 1998. Relationship between pumping-test and slug-test parameters: scale effect or artifact? Ground Water, 36 (2), 305–312. doi:10.1111/j.1745-6584.1998.tb01096.x
- CERM-PACES, 2013. Résultats du programme d’acquisition de connaissances sur les eaux souterraines de la région Saguenay-Lac-Saint-Jean. Chicoutimi: CERM-PACES.
- Chesnaux, R., et al., 2011. Building a geodatabase for mapping hydrogeological features and 3D modeling of groundwater systems: application to the Saguenay-Lac-St-Jean Region, Canada. Computers & Geosciences, 37, 1870–1882. doi:10.1016/j.cageo.2011.04.013
- Cooper, H.H. and Jacob, C.E., 1946. A generalized graphical method for evaluating formation constants and summarizing well-field history. Transactions, American Geophysical Union, 27 (4), 526–534. doi:10.1029/TR027i004p00526
- Dupuit, J., 1863. Etudes théoriques et pratiques sur le mouvement des eaux dans les canaux découverts et à travers les terrains perméables. 2nd ed. Paris: Dunod.
- El-Naqa, A., 1994. Estimation of transmissivity from specific capacity data in fractured carbonate rock aquifer, central Jordan. Environmental Geology, 23, 73–80. doi:10.1007/BF00773142
- ESRI Inc., 2008. ArcMap V9.3. Redlands, CA.
- Fabbri, P. and Piccinini, L., 2013. Assessing transmissivity from specific capacity in an alluvial aquifer in the middle Venetian plain (NE Italy). Water Science and Technology, 67 (9), 2000–2008. doi:10.2166/wst.2013.074
- Hamm, S.-Y., et al., 2005. Relationship between transmissivity and specific capacity in the volcanic aquifers of Jeju Island, Korea. Journal of Hydrology, 310, 111–121. doi:10.1016/j.jhydrol.2004.12.006
- Hebert, C., Chown, E.H., and Daigneault, R., 1998. Histoire tectono-magmatique de la region du Saguenay (Province de Grenville). Field Trip Guidebook, Vol. A6, Geological Association of Canada/ Mineralogical Association of Canada. Quebec, Canada. 68p.
- Helsel, D.R. and Hirsch, R.M., 2002. Statistical methods in water resources. In: Techniques of water-resources investigations of the United States Geological Survey, book 4, Hydrologic analysis and interpretation. USA: USGS.
- Huntley, D., Nommensen, R., and Steffey, D., 1992. The use of specific capacity to assess transmissivity in fractured-rock aquifers. Ground Water, 30 (3), 396–402. doi:10.1111/j.1745-6584.1992.tb02008.x
- Jacob, C.E., 1944. Notes on determining permeability by pumping tests under water table conditions. Washington, DC: US Geological Survey, Open File Report, p. 4.
- Logan, J., 1964. Estimating transmissibility from routine production tests of water wells. Hydrogeology Journal, 8, 177–187.
- Mace, R.E., 1997. Determination of transmissivity from specific capacity tests in a karst aquifer. Ground Water, 35 (5), 738–742. doi:10.1111/j.1745-6584.1997.tb00141.x
- Mace, R.E., 2001. Estimating transmissivity using specific-capacity data. Austin, TX: Bureau of Economic Geology, the University of Texas at Austin. Geological Circular No. 01-2.
- McLin, S.G., 2005. Estimating aquifer transmissivity from specific capacity using MATLAB. Ground Water, 43 (4), 611–614. doi:10.1111/j.1745-6584.2005.0101.x
- MDDEP 2011. Système d’Information Hydrogéologique. Quebec, Ministère du Développement Durable, de l’Environnement et des Parcs. Available from: http://www.mddep.gouv.qc.ca/eau/souterraines/sih/index.htm [Accessed March 2011].
- MDDEP 2013. Programme d’acquisition de connaissances sur les eaux souterraines du Québec. Québec, Ministère du Développement Durable, de l’Environnement et des Parcs. Available from: http://www.mddep.gouv.qc.ca/eau/souterraines/programmes/acquisition-connaissance.htm [Accessed 29 August 2013].
- Nastev, M., et al., 2004. Hydraulic properties and scale effects investigation in regional rock aquifers, south-western Quebec, Canada. Hydrogeology Journal, 12, 257–269. doi:10.1007/s10040-004-0340-6
- Rafini, S. and Larocque, M., 2009. Insights from numerical modeling on the hydrodynamics of non-radial flow in faulted media. Advances in Water Resources, 32, 1170–1179. doi:10.1016/j.advwatres.2009.03.009
- Raghavan, R., 2006. Some observations on the scale dependence of permeability by pumping tests. Water Resources Research, 42 (7), W07402. doi:10.1029/2005WR004166.
- Razack, M. and Huntley, D., 1991. Assessing Transmissivity from Specific Capacity in a Large and Heterogeneous Alluvial Aquifer. Ground Water, 29 (6), 856–861. doi:10.1111/j.1745-6584.1991.tb00572.x
- Razack, M. and Lasm, T., 2006. Geostatistical estimation of the transmissivity in a highly fractured metamorphic and crystalline aquifer (Man-Danane Region, Western Ivory Coast). Journal of Hydrology, 325, 164–178. doi:10.1016/j.jhydrol.2005.10.014
- Richard, S.K., Chesnaux, R., and Rouleau, A., 2011a. Estimating the hydraulic properties of aquifers from specific capacity data: Saguenay-Lac-Saint-Jean, Quebec. In: GeoHydro 2011, Joint Meeting of the Canadian Quaternary Association and the Canadian Chapter of the International Association of Hydrogeologists, 28–31 August 2011, Quebec City, 8p.
- Richard, S.K., Chesnaux, R., and Rouleau, A., 2011b. Evaluación de la transmisividad a partir del caudal específico en los acuíferos rocosos de la región de Saguenay-Lac-Saint-Jean, Québec, Canada. In: VII Congreso Argentino de Hidrogeología, 18–21 October 2011, Salta, 8p.
- Richard, S.K., Chesnaux, R., and Rouleau, A., 2012. From calculating transmissivity to understanding its origin in the fractured-rock aquifers of Saguenay-Lac-Saint-Jean region, Canada. In: International Conference on Groundwater in Fractured-rocks, 21–24 May 2012, Prague, p. 28.
- Rotzoll, K. and El-Kadi, A., 2008. Estimating hydraulic conductivity from specific capacity for Hawaii aquifers, USA. Hydrogeology Journal, 16, 969–979. doi:10.1007/s10040-007-0271-0
- Rouleau, A., et al., 2011. Un aperçu de la diversité hydrogéologique du territoire du Saguenay-Lac-Saint-Jean (Québec). GeoHydro 2011, Joint Meeting of the Canadian Quaternary Association and the Canadian Chapter of the International Association of Hydrogeologists, 28-31 August 2011, Quebec City, 7p.
- Rovey, C.W., 1994. Assessing flow systems in carbonate aquifers using scale effects in hydraulic conductivity. Environmental Geology, 24, 244–253. doi:10.1007/BF00767085
- Rovey, C.W. and Cherkauer, D., 1995. Scale dependency of hydraulic conductivity measurements. Ground Water, 33 (5), 769–780. doi:10.1111/j.1745-6584.1995.tb00023.x
- Schultze-Makuch, D., et al., 1999. Scale dependency of hydraulic conductivity in heterogeneous media. Hydrogeology Journal, 6, 204–215.
- Schultze-Makuch, D. and Cherkauer, D.S., 1998. Variations in hydraulic conductivity with scale of measurement during aquifer tests in heterogeneous, porous carbonate rocks. Ground Water, 37, 904–919.
- Srivastav, S.K., Lubczynski, M.W., and Biyani, A.K., 2007. Upscaling of transmissivity, derived from specific capacity: a hydrogeomorphological approach applied to the Doon Valley aquifer system in India. Hydrogeology Journal, 15, 1251–1264. doi:10.1007/s10040-007-0207-8
- Theis, C.V., 1935. The relation between the lowering of the piezometric surface and the rate and duration of discharge of a well using groundwater storage. Transactions, American Geophysical Union, 16, 519–524. doi:10.1029/TR016i002p00519
- Thiem, G., 1906. Hydrologische Methoden. Leipzig: Gebhardt, 56p.
- Todd, D.K., 1980. Groundwater hydrology. 2nd ed. New York: Wiley.
- Verbovšek, T., 2008. Estimation of transmissivity and hydraulic conductivity from specific capacity and specific capacity index in Dolomite aquifers. Journal of Hydrologic Engineering, 13 (9), 817–823. doi:10.1061/(ASCE)1084-0699(2008)13:9(817)
- Walter, J., et al., 2011. Acquisition de connaissances sur les eaux souterraines du territoire municipalisé du Saguenay-Lac-Saint-Jean. Chicoutimi: MDDEP, CERM, UQAC, 21p plus 10 appendices.
- Walton, W.C., 1970. Groundwater resource evaluation. New York: McGraw-Hill.