
ABSTRACT
Climate change/variability accompanied by anthropogenic activities can alter the runoff response of landscapes. In this study we investigate the integrated impacts of precipitation change/variability and landscape changes, specifically wetland drainage practices, on streamflow regimes in wetland-dominated landscapes in the Assiniboine and Saskatchewan River basins of the North American Prairies. Precipitation and streamflow metrics were examined for gradual (trend type) and abrupt (shift type) changes using the modified Mann-Kendall trend test and a Bayesian change point detection methodology. Results of statistical analyses indicate that precipitation metrics did not experience statistically significant increasing or decreasing changes and there was no statistical evidence of streamflow regime change over the study area except for one of the smaller watersheds. The absence of widespread streamflow and precipitation changes suggests that wetland drainage did not lead to detectable changes in streamflow metrics over most of the Canadian portion of the Prairies between 1967 and 2007.
Editor Z.W. Kundzewicz Associate editor None assigned
1 Introduction
Land-use change by humans for agriculture or urbanization purposes changes the sources and also the movement of water, thereby affecting the frequency, timing and duration of runoff on the landscape (Booth Citation1991, Vought et al. Citation1995, Azous and Horner Citation2001, Sheldon et al. Citation2005). Different anthropogenic disturbances may have varying influences on water movement above and below the surface. For example, removing vegetation reduces the residence time of water on the ground and in surface water bodies such as streams or wetlands within the watershed. The construction and operation of dams, in contrast, on the other hand, adversely affects the movement of water by increasing the travel time, thereby reducing flood peaks and changing the seasonal distribution of flows (Kondolf Citation1997, Sheldon et al. Citation2005). Research has shown that collecting stormwater through drains and culverts results in transport of large volumes of stormwater runoff into rivers, lakes and wetlands at much faster rates and higher volumes compared to natural conditions (Dunne and Leopold Citation1978, Booth Citation1991, Shaw et al. Citation2012). The variation in impacts of anthropogenic interventions suggests that prediction of the outcome of the interplay between rates, volumes and durations of runoff metrics is an intricate task.
Watersheds in the North American Prairies are characterized by numerous small and large depressions with a wide range of water-holding capacities (Spence Citation2007). The water stored in the landscape through these small and large closed basins introduces a remarkable memory to the system when carried over to subsequent years. Therefore the hydrology of the wetland-dominated Prairies, is known to be complex even without any human disturbances (Woo and Rowsell Citation1993, Hayashi et al. Citation1998, Van Der Kamp and Hayashi Citation2003, Fang et al. Citation2010, Shook and Pomeroy Citation2011, Shook et al. Citation2013). It is commonly believed that ditching and draining practices over the pothole-dominated landscapes of the North American Prairies can change the memory properties of these landscapes (Tiner Citation1984, Turner et al. Citation1987, Bardecki Citation1988). While these manipulations obviously introduce further complexity to the system, they may also induce a streamflow regime change in the Prairies over time. Wetland drainage disturbs the memory properties of the Prairies by reducing the water-holding capacity of the landscape and increasing the areas contributing to runoff at the outlets of the main watersheds.
Wetland drainage across the Prairie region is widespread and persistent, and its hydrological effects are not well understood. Environment Canada (Citation1986) reported that 12 000 km2 of wetland areas were lost in the 570 000 km2 Prairie Pothole Region of Canada up to 1976. Watmough and Small (Citation2007), in a detailed study of the entire region, documented a total wetland area of 46 000 km2 up to 1985 and a further loss of 2300 km2 between 1985 and 2001. Assuming that wetland drainage started in earnest about 1960, and that drainage continued at the 1960–1976 rate during the 1977–1984 period, these numbers suggest that a total of about 20 000 km2, or about 30% of wetland area, have been lost to drainage. Small wetlands are the most affected by drainage (Watmough and Small Citation2007) and therefore the number of wetlands affected by drainage may be much larger on a percent basis than the total wetland area that is affected.
Other studies have reported various rates and types of drainage within more local areas and watersheds. For example, 9000 km2 of southwestern Manitoba were affected by drainage between 1890 and 1935, and further incremental drainage continued through the 1960s (Kiel et al. Citation1972, Zittlau Citation1979). Caswell and Schuster (Citation1992) suggest that 10–45% of remaining basins are affected annually, primarily by the agriculture sector. Turner et al. (Citation1987) pointed out that the majority of the remaining wetlands are affected to some degree in the Parkland region of the Prairies. Minke et al. (Citation2010) reported a 53% wetland area loss between 1958 and 2007 (with concentrated wetland drainage during the 1990s) in the 445 km2 Smith Creek watershed. In a recent modelling study, the impacts of wetland drainage in the Broughton’s Creek watershed north of Brandon, Canada were investigated by Badiou (Citation2012). The watershed was selected as the study area because the land use and wetland loss trends were assumed to be representative of other watersheds across the Prairie Pothole Region of Canada. According to this study, 70% of the total number of wetlands in the Broughton’s Creek watershed were degraded or totally lost due to drainage between 1968 and 2005. This research also reported that the modelled peak flow and total streamflow within the creek, respectively, experienced 18 and 30% increase during the study period. Van Der Kamp et al. (Citation2008), in reviewing long-term lake level changes in the Prairie region, noted anomalous rises of lake levels since the 1960s in parts of central-east Saskatchewan. They suggested that these rises may be due to wetland drainage, perhaps because the landscape is especially flat and relatively amenable to wetland drainage.
A number of other studies have reported on changes in the hydroclimatology of the Prairies. For example, Akinremi and Mcginn (Citation1998) investigated linear trends in precipitation amounts and number of precipitation events across the Canadian Prairies. Their analysis showed that there was a significant increase in both variables during the observation period, and this was attributed to climate change. Burn et al. (Citation2008) performed a trend analysis on spring and summer runoff volumes, peak flow rates, and peak flow occurrences over the Canadian Prairies. They reported decreasing trends in the spring snowmelt runoff volume and peak flow, decreasing trends (earlier occurrence) in the date of peak spring snowmelt runoff, and decreasing trends in the seasonal runoff volume. Gan (Citation1998) analyzed temperature, precipitation, natural streamflow and evapotranspiration data over the Canadian Prairies and reported that they have become warmer and somewhat drier over the previous four to five decades.
The purpose of the current study is to evaluate the impact of wetland drainage, in combination with possible changes in precipitation inputs, on the streamflow regimes in the northern portion of the Prairie Pothole Region of Canada. We perform this task by examining a number of hydroclimatic variables over a number of watersheds with varying drainage basin areas a range of effective contributing areas, and diverse histories of wetland drainage practices. This study, in fact, extends on the study of Ehsanzadeh et al. (Citation2012b), who investigated the nonstationary behaviour of hydroclimatic variables of two major watersheds (Assiniboine River and Red River) in the Prairies. As recommended by Ehsanzadeh et al. (Citation2012b), we focus on the integrated impacts of human disturbances and climate variability/change on the streamflow characteristics of smaller watersheds with a variety of human interventions. The information on the complex outcome of changes in climatic variables, land-use/cover change and changes in memory properties of the watersheds in wetland-dominated landscapes is vital and assists in future water resources management of the Prairie region.
2 Study area and data
The study area is mainly located in the depression-dominated landscapes of the North American Prairies (). In this region numerous depressions, created by the past glaciations, can retain a great deal of water which may or may not be released to contribute to runoff at the outlet of the larger watersheds, depending on the climate inputs and the antecedent moisture condition (Stichling and Blackwell Citation1957, Rosenberry and Winter Citation1997, Shaw et al. Citation2012, Ehsanzadeh et al. Citation2012a). These naturally varying contributing areas are subject to further fluctuations due to a range of human disturbances including wetland drainage. The hydrologic response to the anthropogenic activities in this landscape is therefore expected to be complex and hard to predict (Woo and Rowsell Citation1993, Hayashi et al. Citation1998, Van Der Kamp and Hayashi Citation2003, Sheldon et al. Citation2005, Fang et al. Citation2010, Shook et al. Citation2013).
Figure 1. Study area and location of the selected watersheds. The watersheds and precipitation stations are numbered based on the first columns of and , respectively.
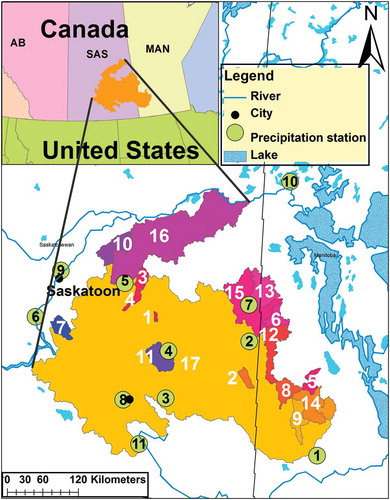
The selected watersheds in this study are within either the Assiniboine River above Brandon, covering the upstream portion of the Assiniboine River above Headingley, which is the Canadian portion of the study area of Ehsanzadeh et al. (Citation2012b), or the Saskatchewan River basin below Prince Albert. Selecting this upper portion of the Assiniboine River watershed gives the study a geographical focus and allows the work to concentrate on the reasonably moist ‘Aspen Parkland’ ecozone of the Prairies, characterized by thousands of shallow ponds or sloughs (Shorthouse Citation2010). We investigate changes in runoff production behaviour of 17 watersheds with drainage areas ranging from over 93 to 93 000 km2 (). These depression-dominated watersheds are characterized by varying effective drainage area ratios and have been subjected to diverse degrees of human disturbances. Effective drainage area ratio is defined as the proportion of the whole drainage basin that contributes to downstreamflow for a median (2-year return period) annual runoff (Martin et al. Citation1983). The conventional (gross) drainage area includes all the land within the topographic boundaries of the main watershed, which may or may not contribute to runoff at the outlet of the watershed depending on the climate input, topography and antecedent moisture condition.
Table 1. Hydrophysical characteristics of the selected watersheds.
The values for gross and effective drainage areas listed in are those made available by the Science and Technology Branch of Agriculture and Agrifood Canada (Richard Rickwood, personal communication), determined using the methodology described in Martin et al. (Citation1983) and Martin (Citation2001). The effective drainage areas represent the ‘natural’ conditions because the hydrological effects of changes to the landscape by dams, diversions and drainage ditches are not taken into account in the estimation (Martin et al. Citation1983). Thus, the effective drainage areas roughly represent the conditions of the drainage basins at the beginning of the 1967–2007 period for which the analysis of this paper was applied. At that time, drainage of wetlands was only beginning to occur and did not accelerate until about 1970. provides a history of wetland drainage within the Carrot River watershed near Melfort (below Kinistino and above Turnberry), in which 90% of wetlands were drained between 1962 and 1993, based on a regular wetland monitoring programme which recorded water depths and the status of 44 wetlands (Conly and Van Der Kamp Citation2001).
Figure 2. Number of remaining wetlands in a 44 wetland sample in the Carrot River watershed near Melfort during the 1962–2010 period.
The effective drainage area ratio of the selected watersheds ranges from 9% (Jumping Deer Creek) to 100% (Vermilion River near Dauphin and Roaring River near Minitonas). Selecting watersheds with a wide range of effective drainage area ratios assists in the evaluation of how the interaction between existing memory properties and anthropogenic activities influences the catchment runoff response.
A regional hydrological year is used to define annual hydroclimatic variables: each year starts on 1 November and ends on 31 October of the following year. This definition is consistent with the regional patterns of runoff regime over this portion of the Prairies, in which snow accumulates from about November to April followed by snowmelt runoff and runoff due to summer rains. In this study, we examine changes in streamflow, runoff ratio and peak flow over the study area during the observation period. Although selected watersheds are those with the best data quality among active hydrometric stations over the study area, monthly runoff data for some of the selected watersheds have only been recorded for some periods of the year and flow data are missing for the rest of the year due to the lack of measurements (, last column). However, the missing observations mostly belong to the zero- or low-flow season of the study area and it is assumed that the reported flow metrics during the measurement periods represent the annual regime of the hydrological a variable under study. Therefore, annual runoff discussed hereafter in this paper, refers to the streamflow measured consistently in a specific hydrometric station in a specific period of the year during the whole observation period. One exception is Carrot River near Kinistino (05KA001), for which runoff data are only available for March–April during the 1967–2007 study period. We include this station in our analysis because the watershed is located in a region with a high potential for wetland drainage.
To obtain annual runoff over a watershed, measured discharges in the gauging stations were divided by the gross drainage area of the watershed. Further, runoff ratios were estimated by dividing measured (depth of) annual runoff by annual precipitation, recorded at the closest precipitation gauging station. Since reported streamflows in some stations have been estimated based on observed flow in a portion of a year, runoff ratios calculated using this approach may be underestimated. However, since the missing data belong mainly to the low- or zero-flow season of the selected stations, it is assumed that estimated runoff ratios do not significantly deviate from the true values and therefore, they represent the status of runoff response behaviour of the landscape. Although the record lengths range from 35 years (Assiniboine River near Brandon and Smith Creek near Marchwell) to 65 years (Jumping Deer Creek near Lipton), the most common period of available runoff data, 1967–2007, which corresponds to the study period used in Ehsanzadeh et al. (Citation2012b), is selected as the observation period in this study. Limiting the study period to this observation window consistent with the previous study provides a uniform temporal basis for the assessment of watershed response to different driving forces at different spatial scales.
We used 11 stations from the Canadian Daily Rehabilitated Precipitation Database to represent precipitation over the study area ( and ). This precipitation dataset includes adjusted daily rain, snow and total precipitation amounts for 495 stations across Canada determined using methods described in Mekis and Hogg (Citation1999) and Vincent and Mekis (Citation2009). The selected stations provide a reasonable coverage over the study area and have the best available precipitation records in terms of the number of missing data and observation period. In Canada, when a station is relocated, a new identification number is often given to the new location and the observations of the two stations are combined in order to create a long time series (e.g. Cote Station, ). In this study we use the closest precipitation station to represent precipitation and to estimate runoff ratio over a watershed (). Similar to runoff data, we analyzed cumulative and maximum daily precipitation for each hydrological year to investigate any possible climate change/variability.
Table 2. Precipitation stations used to estimate precipitation over the study area.
The observation period of precipitation records ranges from 39 years (Muenster) to 111 years (Brandon CDA). Similar to runoff data, we select a common period of precipitation data starting in 1967. The availability of the rehabilitated precipitation data across the region is much more limited after 2007. Therefore, observations used for selected precipitation stations in this study end in 2007, with a few stations ending in 2005 and 2006. The reduced availability of rehabilitated precipitation data after 2007 meant that the study could not be extended beyond that year.
3 Methodology
Trend detection analysis is commonly performed under a monotonic trend assumption. However, the monotonic trend hypothesis is not a complete way of addressing the question of changes in environmental state. This is because a change in trend direction during the observational period may lead to the acceptance of the null hypothesis of no trend when it is in fact false, thereby increasing the chance of a type I error. Therefore, it is essential to assess, simultaneously, the existence of change points and trends in order to have a more realistic understanding of the nature of the variability in the processes under study (Ehsanzadeh et al. Citation2011). In this study, a combination of abrupt (shift) and gradual (trend) change detection is performed on the selected hydroclimatic variables making use of two statistical tools described in the following subsections.
3.1 Bayesian multiple change point detection procedure
A variety of shift detection methods have been proposed in the literature. Two major groups of these tests are classical methods including parametric (e.g. t-test) and non-parametric (e.g. Mann and Whitney Citation1947) tests and Bayesian shift detection models (e.g. Perreault et al. Citation2000a, Citation2000b, Rasmussen Citation2001, Fearnhead Citation2005, Seidou and Ouarda Citation2007). Some of the introduced methods require the number of change points in sample data to be specified a priori. Another class of change-point detection methods developed in a Bayesian framework does not need a priori information on the number of change points and can detect as many change points as may exist in the sample data. In this study, the Bayesian change point method proposed by Seidou and Ouarda (Citation2007) is employed to evaluate abrupt changes in mean or direction of trends in the variables under study. This method was adopted because it handles an unknown number of changes and displays the complete probability distribution of the dates of the changes. The interested reader is referred to Seidou and Ouarda (Citation2007) and Ehsanzadeh et al. (Citation2013) for further details on the Bayesian change point detection methodology.
3.2 Mann-Kendall (MK) trend test
In order to detect the eventual change in the parameters (e.g. mean, variance, or trend) of a time series, different statistical methods such as classical hypothesis testing could be used. The nonparametric Mann-Kendall (MK) statistical test (Mann Citation1945, Kendall Citation1975) has been frequently used to quantify the significance of trends in hydrometeorological time series. The main reason for using non-parametric statistical tests is that compared to parametric statistical tests, the non-parametric tests are thought to be more suitable for non-normally distributed and censored data, which are frequently encountered in hydrometeorological time series. Moreover, among nonparametric tests, the MK test due to unbiased estimation of population parameters is preferred to other tests and, as such, is used in this study to investigate trends in selected hydroclimatic variables. Further details on the MK statistical test can be found in Mann (Citation1945), Kendall (Citation1975), Ehsanzadeh et al. (Citation2012b) and Ehsanzadeh et al. (Citation2013).
3.3 Modifications to the MK test
Positive serial correlation may increase the variance of the MK statistic, and this in turn leads to an increase in the rejection rate of the null hypothesis (the test may detect more trends compared to what exists in reality). A sample of studies in the literature dealing with this issue include Wang and Swail (Citation2001), Yue et al. (Citation2002), Fleming and Clarke (Citation2002), Yue and Wang (Citation2004), Zhang and Zwiers (Citation2004), and Bayazit and Önöz (Citation2007). Pre-whitening (removing autocorrelation prior to applying the trend test) can effectively remove the AR (1) component. However, the existence of a trend influences the magnitude of the estimate of serial correlation. Therefore, removing a positive AR(1) will also remove a portion of trend, and the magnitude of trend after pre-whitening is smaller than that before pre-whitening (Yue et al. Citation2002, Ehsanzadeh et al. Citation2011). In this study, the methodology proposed by Yue et al. (Citation2002) is adopted to deal with autocorrelation in which the time series are detrended prior to pre-whitening to provide a more accurate estimate of the true AR(1). In this methodology autocorrelation of the detrended time series is estimated using the rank correlation coefficient estimator by replacing the sample data by their ranks following the methodology proposed by Salas et al. (Citation1980). The steps followed to implement this approach of dealing with autocorrelation in the MK test can be found in Yue et al. (Citation2002) and Ehsanzadeh et al. (Citation2012b).
4 Statistical analysis and results
4.1 Exploratory data analysis
presents the annual runoff ratio (the percentage of precipitation translated to runoff) along with effective drainage area ratio of the selected watersheds. The annual runoff ratio ranges from 0.24% (Jumping Deer Creek) to 16.8% (Roaring River), with an average of 7% for the studied watersheds.
Table 3. Annual runoff ratio and effective drainage area ratio for the selected watersheds.
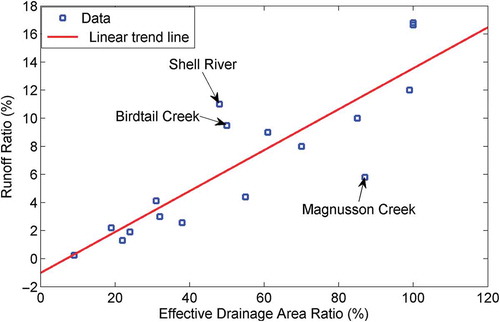
illustrates the relationship between effective drainage area ratio and runoff ratio for the selected watersheds. It can be seen that runoff ratio is a function of effective drainage area ratio, i.e. the watersheds with larger effective drainage area ratios have larger runoff ratios and vice versa. The correlation coefficient (R) between effective drainage area ratio and runoff ratio is 0.86. The coefficient of determination (R2) of 0.74 implies that 74% of the variation of annual runoff ratio is explained by effective drainage area ratio. However, correlation between effective drainage area ratio and runoff ratio in some watersheds deviates from the linear regression line (e.g. Birdtail Creek, Shell River, and Magnusson Creek). It may be noted that the Magnusson Creek drainage basin area is the smallest of the basins considered and thus the drainage area ratio for this basin is particularly sensitive to small errors in the estimate of the gross and effective drainage areas.
Figure 3. Relationship between effective drainage area ratio and runoff ratio.
4.2 Change point analysis
presents the results of change point analysis for annual total and maximum precipitation. This table shows that eight and seven out of 11 tested stations were characterized by at least one shift in annual total and annual maximum daily precipitation, respectively, during the observation period. While there is a balanced combination of upward and downward shifts for annual precipitation occurring in the 1980s and 1990s, observed shifts for maximum daily precipitation are generally downward, occurring mainly in the 1980s. The timing of observed upward and downward shifts is inconsistent among different stations. Identified shifts at two stations (Indian Head and Kelliher) have consistent directions for annual total and maximum daily precipitation data series whereas the directions of observed shifts are inconsistent for total and maximum precipitation at other stations.
Table 4. Change point analysis results for different precipitation metrics. The numbers in the 4th and the 5th columns represent the timing (year) of detected shifts. Underlined years indicates an upward shift, the other years experienced downward shifts.
presents the results of change point analysis for different runoff metrics. It can be seen that 10 out of 17 tested watersheds are characterized by shifts in peak daily runoff, where detected shifts are mainly downward and occurred mostly in the 1980s. Three upward shifts detected in peak flows belong to Jumping Deer Creek (1999), Smith Creek (1995) and Woody River (1987). Total runoff shows shift-type nonstationary behaviour in six out of 17 tested time series. Similar to peak flow, the number of time series identified with downward shifts exceeds that of stations with upward shifts. The observed shifts in total runoff have generally the same directions and timings as those observed in peak flow. Runoff ratios in eight out of 17 stations are characterized by statistically significant shifts. Similar to other runoff metrics, the number of detected downward shifts exceeds that of upward shifts. There are also a larger number of stations characterized by both upward and downward shifts in runoff ratio time series compared to other runoff variables. Generally speaking, observed downward and upward shifts tend to occur in 1980s and 1990s, respectively, for different runoff metrics tested in this study.
Table 5. Shift analysis results for runoff metrics. The numbers in the 4th to 6th columns represent the timing (year) of detected shifts. Underlined years indicate an upward shift.
– illustrate the timing, direction and magnitude of detected shifts in runoff ratios of three watersheds among the 17 tested watersheds in this study. The selected watersheds are those with a clear history of human disturbances. For example, the Carrot River above Kinistino () has a long history of human disturbances including drainage for agricultural purposes. Runoff data for this hydrometric station are only available for the March–April period. In spite of the history of disturbances in the watershed, there is no evidence of abrupt changes in runoff ratio of this watershed during the observation period.
Figure 4. Change point detection result for runoff ratio in Carrot River near Kinistino (05KA001).
Figure 5. Change point detection result for runoff ratio in Carrot River near Turnberry (05KH007).
Figure 6. Change point detection result for runoff ratio in Smith Creek near Marchwell (05ME007).
Another Prairie watershed with a long history of ditching and land-use changes is the Carrot River above Turnberry (05KH007). Results of change point analysis show that the runoff ratio in this watershed is characterized by an abrupt downward shift in 1987 (). Due to the observed downward shift, the runoff ratio in this watershed decreased from over 10% (up to 1987) to about 5% (after 1987).
The Smith Creek watershed, one of the most researched watersheds among the tested catchments, has experienced a range of anthropogenic activities within the watershed during the last few decades. The runoff ratio of this basin is characterized by an abrupt increase change in 1991 accompanied by a two-fold increase in the runoff ratio (). The inter-annual fluctuations of runoff ratio in this watershed seem to be larger after the detected change point compared to the first segment of observations.
4.3 Trend analysis results
and present trend analysis results for precipitation and flow metrics over the selected watersheds. In these tables, a positive standard normal variate (Z) represents an upward trend, while a negative Z indicates a downward trend. Further, a Z with an absolute value equal to or larger than 1.64 indicates a statistically significant trend at a 10% significance level and a Z with an absolute value equal to or larger than 1.96 is an indication of a significant trend at a 5% significance level. The results of trend analysis for precipitation and runoff metrics are also illustrated in . In this figure the blue spectrum of colours represent negative slopes and the red spectrum (including yellow) indicates positive slopes. As indicated in the legends, dark-red shows a significant upward trend and dark-blue indicates a significant downward trend. No evidence of positive or negative slope is illustrated by white.
Figure 7. Trend analysis results for precipitation and runoff variables. Circles represent the location of precipitation stations and the corresponding colours indicate the direction of trends in the stations. The watersheds and precipitation stations are numbered based on the first columns of and , respectively.
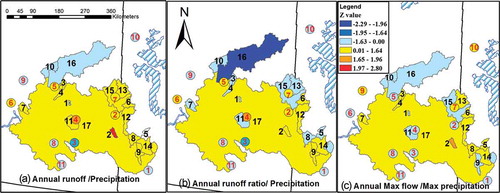
Table 6. Trend analysis results (Z values) for annual cumulative and maximum precipitation.
Table 7. Trend analysis results (Z values) for flow metrics.
According to there is no evidence of significant upward or downward trends at a 5% significance level over the study area. Annual total precipitation at Indian Head experienced a significant downward trend at a 10% significance level (–). Overall, annual and maximum daily precipitation in six and eight out of 11 tested stations, respectively, experienced (insignificant) negative slopes during the observation period (–).
Trend analysis results for flow metrics are presented in and . It can be seen that total runoff and peak annual runoff in Smith Creek (05ME007) are characterized by significant upward trends, while there is no indication of a significant trend in runoff ratio over this watershed, although there is a suggestion of an upward trend at almost the 10% significance level. and also show that the runoff ratio for the Carrot River near Turnberry (05KH007) experienced a significant downward trend during the observation period. Although total and peak flow time series over this watershed are characterized by negative slopes, observed trends are not statistically significant. There is no evidence of significant trends in other flow metrics over the other watersheds.
5 Discussion
Prediction of changes in runoff processes caused by changes in climate variables and modifications to the watershed land cover/use in the Prairies, which is the focus of this study, is a sophisticated task. This is because varying ditching and draining practices aiming at drying wetlands for agricultural purposes can disturb the memory properties of the landscape that play an important role in runoff production behaviour of the wetland-dominated landscapes of the Prairies (Padmanabhan and Bengtson Citation1999, Simonovic and Juliano Citation2001, Vining Citation2002). In a recent study, Ehsanzadeh et al. (Citation2012b) investigated the nonstationary behaviour of hydroclimatic variables over two very large watersheds of the North American Prairies (Assiniboine River and Red River watersheds). The study concluded that changes in precipitation are the main driver of changes in streamflow, whereas the effects of land-use change and wetland drainage could not be identified in the streamflow records for these large drainage basins. In the present study, we build on the previous study by performing a more detailed analysis of hydroclimatic variables in much finer resolution over a range of small to large watersheds with diverse histories of human interventions within or in the vicinity of the Assiniboine River watershed.
Our analysis shows that the proportion of precipitation that is transformed to runoff and moves downstream is a function of the watershed contributing area, which generally differs from the gross drainage area in the Prairies. The percentage of runoff coefficient variability that is explained by effective drainage area ratio amounts to 74% over the study area (). Despite the observed linear relationships between runoff ratios (estimated in this study) and the effective drainage area ratios (reported by the Prairie Farm Rehabilitation Administration of Canada, PFRA), noteworthy deviations from the linear relationship are also identifiable. For example, the estimated runoff ratio of 6% for Magnuson Creek ( and ) seems to be small compared to the 87% contributing area reported by PFRA for this watershed. Runoff ratios of 9.5% and 11%, respectively, for Birdtail Creek and Shell River, on the other hand, are relatively high and they show deviations from the linear relationship between runoff ratio and effective drainage area ratio. It is noteworthy that there is no documented evidence of human disturbances such as ditching practices within these two watersheds during the observation period.
Observed deviations may be attributed to other causal factors affecting watershed response behaviour, including soil properties such as texture, structure and moisture content which govern permeability and infiltration characteristics of the catchment. Slope, vegetation and underlying material also play important roles in defining the precipitation–runoff relationship in different landscapes. The observed inconsistency in the runoff ratio–effective drainage area relationship for the mentioned watersheds compared to the other watersheds in this study may also reflect the shortcomings of current methodology for defining effective drainage areas in the Prairies. The equivalent depth of streamflow over each watershed utilized to obtain runoff ratios in this study was estimated based on the gross drainage area of the watershed regardless of the reported contributing area for that watershed. This method of runoff ratio estimation, which is independent from effective drainage area, may provide a useful criterion for a qualitative evaluation of the methodology employed to delineate effective drainage areas. In a relatively homogenous wetland-dominated landscape with comparatively consistent soil and vegetation properties, it is expected to find a relatively linear relationship between runoff ratios and effective drainage area ratios. Any divergence from this anticipated linear relationship may in part be an indication of deficiencies of the methodology utilized to obtain effective drainage area ratios.
In this study, precipitation time series, as the principal climate inputs, were investigated for abrupt (shift) and gradual (trend) nonstationary behaviours on an annual scale. Our shift detection analysis indicates that almost a similar percentage of annual precipitation time series experienced increasing and decreasing shifts (), implying that there is no statistical evidence of precipitation change over the study area in spite of spans of drier or wetter years during the observation period over some of the tested watersheds. The results of trend analysis performed on annual precipitation time series are consistent with those of the shift analysis, where there is no evidence of statistically significant trends in precipitation metrics over the study area (). This is in part in agreement with the results of Akinremi and Mcginn (Citation1998), who suggested extreme precipitation events were not getting more intense on the Canadian Prairies. In the mentioned regression analysis study, however, annual precipitation showed some significant trends in some periods of the study window.
The results of the shift analysis show that a number of watersheds experienced abrupt changes in runoff production behaviour. The detected shifts have both downward and upward directions with an overall domination of decreasing shifts (). The timing of observed shifts for different runoff metrics differs from one station to another, but downward trends predominate in the 1980s, as opposed to the larger number of upward trends occurring in the 1990s. While the change from downward shifts to upward shifts over time may not be an indication of long-term regime change, it may be suggest the presence of hydrological wet and dry spells during the observation period over the study area, Therefore, it may be hypothesized that (some parts of) the study area experienced a hydrological drought starting in the 1980s that lasted for almost a decade. This observation is consistent with the findings of Ehsanzadeh et al. (Citation2012b), who highlighted a remarkable drop in runoff and runoff ratios of Assiniboine River at Headingley starting in 1980 and extending to the mid-1990s.
The results of trend analysis indicate that runoff metrics generally did not experience significant trends over the study area. This finding is consistent with the results of Ehsanzadeh and Adamowski (Citation2007), who concluded that there was no evidence of significant trends in low streamflows across the Canadian Prairies. One of the exceptions is the Smith Creek watershed, where both cumulative and peak annual runoff time series were characterized by significant upward trends. The annual runoff ratio in this watershed, however, did not experience a significant increasing trend, although there is a suggestion of a near-significant increase. The second watershed with some evidence of nonstationary behaviour is Carrot River near Turnberry. Annual runoff ratio in this watershed was characterized by a significant downward trend during the observation period, despite the indication of extensive drainage in the upper reaches of the watershed as illustrated in . Other runoff metrics in this watershed, however, showed no evidence of nonstationary behaviour.
The results of change analysis for annual peak flows, among other tested runoff variables, are of critical importance. This is primarily because maximum annual flows are available for the whole observation period (with no missing data) and therefore the peak flow time series used in this study can reasonably reflect the state of consistency/variability of extreme events during the observation period over the study area. The results of change analysis on the peak flows are also important, because any modification to land use/cover and in particular wetland draining practices is expected to intensify runoff response, particularly during extreme events. Our regime change analysis shows that annual peak flows over the study area not only did not experience increasing abrupt or gradual changes, they were even characterized by larger numbers of abrupt downward changes compared to other runoff metrics.
A more detailed evaluation of runoff response in watersheds with histories of human interventions shows that the integrated impact of changes in driving forces which contribute to runoff production varies in different watersheds. An example of extensive human intervention is given by the Carrot River watershed near Melfort. As illustrated in , more than 90% of the total number of wetlands in this area were drained between 1967 and 1993. Our change point detection analysis reveals that total runoff over the Carrot River watershed near Turnberry, which encompasses the Melfort area, experienced a remarkable downward shift in 1987 (). The results of trend analysis also show that the runoff metrics of this watershed generally experienced insignificant downward trends (). Interestingly, the annual runoff ratio for the Carrot River watershed near Turnberry was characterized by a significant downward trend during the observation period.
Other documented rates of wetland loss include a 53% wetland area loss between 1958 and 2007 (with concentrated wetland drainage during the 1990s) at Smith Creek near Marchwell (Minke et al. Citation2010, Shook et al. Citation2013). The results of shift analysis show that runoff and runoff ratios over this watershed experienced intensive increasing shifts during the observation period ( and ). Trend analysis results also revealed that runoff metrics over this watershed were inclusively characterized by upward trends ( and ), with significant upward trends for annual and peak daily flow during the observation period.
Wetland drainage is commonly believed to contribute to flooding in the Northern Prairies by reducing water retention capacity within the landscape. The focus of several previous studies reporting on regime change of streamflows and alteration of ecosystems due to human disturbances has been the modelling of relatively small watersheds. It is well known that there are numerous unavoidable assumptions inherent in the simulation of complex and not fully understood natural processes. As an example, the results of a modelling study on the fairly small Broughton’s Creek watershed (Badiou Citation2012) suggested that wetland drainage has resulted in increased annual runoff and peak flow over this watershed. However, analysis of streamflow records for the adjacent Oak River near Rivers watershed (tested in this study), with similar landscape characteristics but much larger drainage area, indicates no evidence of significant change in annual runoff or peak flow over this watershed. The Smith Creek watershed (445 km2), which is characterized by some evidence of regime change during the study period, is the second-smallest watershed tested in this study. In contrast, the Carrot River near Turnberry, also with a clear history of drainage but with no evidence of intensified flow metrics, has a gross drainage area more than 30-times larger than that of Smith Creek. It seems, therefore, that wetland drainage may influence the pattern of runoff movement over local and small-scale landscapes and this in turn may result in intensified runoff response behaviour. However, this intensifying effect may not be translated to significant changes in runoff production behaviour of larger watersheds. In other words, depending on the size of the watershed and the interplay between varying causal factors affecting runoff response of the landscape, and also the contribution weight of different driving forces, changes in hydrological response of the major watersheds may or may not conform to the human-induced changes over enclosed smaller watersheds.
It seems also that climate, and in particular precipitation input, remains the major driving force affecting the watershed response behaviour in the Prairies. The contribution of other causal factors including human interventions, especially in larger watersheds, is overshadowed by climate inputs. This finding is consistent with Ehsanzadeh et al. (Citation2012b), who reported significant increasing changes in runoff metrics of the Red River basin in the USA (Red River of the North), attributed to the significantly increased precipitation input over the watershed, which triggered different depression storage thresholds within the boundaries of this watershed. The runoff production behaviour of the Assiniboine River (the Canadian portion of the study area), however, did not experience statistically significant changes, which was again attributed to no or insignificant changes in precipitation metrics over this watershed.
Given the disproportionate runoff increase in response to a moderately intensified precipitation over the Red River basin reported by Ehsanzadeh et al. (Citation2012b), it may be concluded that further significant increase in precipitation inputs (especially extreme events) is needed over the Canadian portion of the Prairies to trigger different depression storage thresholds (lowered through wetland drainage practices), and this in turn may lead to a disproportionately intensified runoff response of disturbed watersheds over this region in the future. It should be noted that this study could not include notable regional floods that occurred on the Assiniboine River since 2007, due to the reduction in availability of robust precipitation data. The relative effects of wetland drainage and precipitation on these events could not therefore be assessed.
6 Conclusions
The results of statistical change analysis on precipitation metrics show that there is no evidence of change/variability in climate inputs over the study area except some periods of wet and dry spells during the observation period. Only one small and extensively drained watershed, of the 17 watersheds that were analyzed, shows changes in streamflow metrics that could be attributed to human interventions such as wetland drainage. It is concluded that anthropogenic disturbances, including ditching and wetland drainage, have led to little significant streamflow regime change, especially over the larger Prairie watersheds. As was also suggested by the previous study, changes in precipitation inputs seem to be the principal contributor to changes in streamflow behaviour in the Prairies.
Disclosure statement
No potential conflict of interest was reported by the authors.
Acknowledgements
The authors would like to thank Richard Rickwood in Science and Technology Branch of Agriculture and Agrifood Canada for providing updated gross and effective drainage area data, and J.B. Millar for providing the data on wetland drainage near Melfort. Appreciation is extended to two anonymous reviewers for thoughtful comments that improved the quality of this paper.
References
- Akinremi, O.O. and Mcginn, S.M., 1998. Precipitation trends on the Canadian Prairies. Journal of Climate, 12, 2996–3003. doi:10.1175/1520-0442(1999)012<2996:PTOTCP>2.0.CO;2
- Azous, A.L. and Horner, R.R., 2001. Wetlands and urbanization: implications for the future. New York: Lewis Publishers.
- Badiou, P., 2012. Protect first, restore later: why wetland triage might put rehab on hold. Water Canada, 12 (5), 34–35.
- Bardecki, M.J., 1988. Impacts of agricultural land drainage on wetlands: a geographical appraisal. In Proceedings of the national symposium on protection of wetlands from agricultural impacts. Washington, DC: US Fish and Wildlife Service, 15–21, Biological Report 88–16.
- Bayazit, M. and Önöz, B., 2007. To prewhiten or not to prewhiten in trend analysis? Hydrological Sciences Journal, 52 (4), 611–624. doi:10.1623/hysj.52.4.611
- Booth, D.E., 1991. Urbanization and the natural drainage system impacts, solutions, and prognoses. The Northwest Environmental Journal, 7 (1), 93–118.
- Burn, D.H., Fan, L., and Bell, G., 2008. Identification and quantification of streamflow trends on the Canadian Prairies. Hydrological Sciences Journal, 53, 538–549. doi:10.1623/hysj.53.3.538
- Caswell, F.D. and Schuster, M.H., 1992. Prairie waterfowl status report. Ottawa, ON: Canadian Wildlife Service.
- Conly, F.M. and Van Der Kamp, G., 2001. Monitoring the hydrology of Canadian prairie wetlands to detect the effects of climate change and land use changes. Journal of Environmental Monitoring and Assessment, 67, 195–215. doi:10.1023/A:1006486607040
- Dunne, T. and Leopold, L.B., 1978. Water in environmental planning. New York: W.H. Freeman and Company.
- Ehsanzadeh, E., et al., 2013. Analysis of changes in the Great Lakes hydroclimatic variables. Journal of Great Lakes Research, 39, 383–394. doi:10.1016/j.jglr.2013.06.015
- Ehsanzadeh, E. and Adamowski, K., 2007. Detection of trends in low flows across Canada. Canadian Water Resources Journal, 32 (4), 251–264. doi:10.4296/cwrj3204251
- Ehsanzadeh, E., Ouarda, T.B.M.J., and Saley, H.M., 2011. A simultaneous analysis of gradual and abrupt changes in Canadian low streamflows. Hydrological Processes, 25, 727–739. doi:10.1002/hyp.7861.
- Ehsanzadeh, E., et al., 2012a. On the behaviour of dynamic contributing areas and flood frequency curves in North American Prairie watersheds. Journal of Hydrology, 414–415, 364–373. doi:10.1016/j.jhydrol.2011.11.007
- Ehsanzadeh, E., Van Der Kamp, G., and Spence, C., 2012b. The impact of climatic variability and change in the hydroclimatology of Lake Winnipeg watershed. Hydrological Processes, 26, 2802–2813. doi:10.1002/hyp.8327
- Environment Canada, 1986. Wetlands in Canada: a valuable resource. Ottawa, ON: Fact Sheet 86-4. Lands Directorate.
- Fang, X., et al., 2010. Prediction of snowmelt derived streamflow in a wetland dominated prairie basin. Hydrology and Earth System Sciences, 14, 991–1006. doi:10.5194/hess-14-991-2010
- Fearnhead, P., 2005. Exact Bayesian curve fitting and signal segmentation. IEEE Transactions on Signal Processing, 53 (6), 2160–2166.
- Fleming, S.W. and Clarke, G.K.C., 2002. Autoregressive noise, deserialization, and trend detection and quantification in annual river discharge time series. Canadian Water Resources Journal, 27, 335–354. doi:10.4296/cwrj2703335
- Gan, T.Y., 1998. Hydroclimatic trends and possible climatic warming in the Canadian Prairies. Water Resources Research, 34 (11), 3009–3015. doi:10.1029/98WR01265
- Hayashi, M., Van Der Kamp, G., and Rudolph, D.L., 1998. Water and solute transfer between a Prairie wetland and adjacent uplands, 1. Water balance. Journal of Hydrology, 207, 42–55. doi:10.1016/S0022-1694(98)00098-5
- Kendall, M.G., 1975. Rank correlation methods. London: Griffin.
- Kiel, W.H., Hawkins, A.S., and Perret, N.G., 1972. Waterfowl habitat trends in the aspen parkland of Manitoba. Canadian Wildlife Service Report Series, No. 18. Ottawa, ON: Canadian Wildlife Service.
- Kondolf, G.M., 1997. Hungry water: effects of dams and gravel mining on river channels. Environmental Management, 21, 533–551. doi:10.1007/s002679900048
- Mann, H.B., 1945. Nonparametric tests against trend. Econometrica, 13, 245–259. doi:10.2307/1907187
- Mann, H.B. and Whitney, D.R., 1947. On a test of whether one of two random variables is stochastically larger than the other. Annals of Mathematical Statistics, 18, 50–60. doi:10.1214/aoms/1177730491
- Martin, F.R.J., 2001. Addendum #8 to Hydrology Report #104. The determination of gross and effective drainage areas in the prairie provinces. Prairie Farm Rehabilitation Administration, Agriculture and Agrifood Canada.
- Martin, F.R.J., Mowchenko, F.M., and Meid, P.O., 1983. The determination of gross and effective drainage areas in the Prairie Provinces. Hydrology Report #104, Prairie Farm Rehabilitation Administration, Agriculture Canada.
- Mekis, É. and Hogg, W.D., 1999. Rehabilitation and analysis of Canadian daily precipitation time series. Atmosphere–Ocean, 37 (1), 53–85. doi:10.1080/07055900.1999.9649621
- Minke, A.G., Westbrook, C.J., and Van Der Kamp, G., 2010. Simplified volume–area–depth method for estimating water storage of prairie potholes. Wetlands, 30, 541–551. doi:10.1007/s13157-010-0044-8
- Padmanabhan, G. and Bengtson, M.L., 1999. A review of models for investigating the influence of wetlands on flooding. Fargo, ND: North Dakota State University, 33.
- Pereault, L., et al., 2000a. Bayesian change-point analysis in hydrometeorological time series. Part 1. The normal model revisited. Journal of Hydrology, 235, 221–241. doi:10.1016/S0022-1694(00)00270-5
- Perreault, L., et al., 2000b. Bayesian change-point analysis in hydrometeorological time series. Part 2. Comparison of change-point models and forecasting. Journal of Hydrology, 235, 242–263. doi:10.1016/S0022-1694(00)00271-7
- Rasmussen, P., 2001. Bayesian estimation of change points using the general linear model. Water Resources Research, 37, 2723–2731. doi:10.1029/2001WR000311
- Rosenberry, D.O. and Winter, T.C., 1997. Dynamics of water-table fluctuations in an upland between two prairie-pothole wetlands in North Dakota. Journal of Hydrology, 191, 266–289. doi:10.1016/S0022-1694(96)03050-8
- Salas, J.D., et al., 1980. Applied modelling of ydrologic time series. Littleton, CO: Water Resources Publications.
- Seidou, O. and Ouarda, T.B.M.J., 2007. Recursion-based multiple changepoint detection in multiple linear regression and application to river streamflows. Water Resources Research, 43, W07404. doi:10.1029/2006WR005021
- Shaw, D.A., et al., 2012. The fill–spill hydrology of Prairie wetland complexes during drought and deluge. Hydrological Processes, 26, 3147–3156. doi:10.1002/hyp.8390
- Sheldon, D., et al., 2005. Wetlands in Washington State—Volume 1: a synthesis of the science. Olympia, WA: Washington State Department of Ecology. Publication #05-06-006.
- Shook, K.R. and Pomeroy, J.W., 2011. Memory effects of depressional storage in Northern Prairie hydrology. Hydrological Processes, 25, 3890–3898. doi:10.1002/hyp.8381
- Shook, K.R., et al., 2013. Storage dynamics simulations in prairie wetland hydrology models: evaluation and parameterization. Hydrological Processes, 27 (13), 1875–1889. doi:10.1002/hyp.9867
- Shorthouse, J.D., 2010. Ecoregions of Canada’s Prairie Grasslands. In Arthropods of Canadian Grasslands (Volume 1): ecology and Interactions in Grassland Habitats.
- Simonovic, S.P. and Juliano, K.M., 2001. The role of wetlands during low frequency flooding events in the Red River basin. Canadian Water Resources Journal, 26 (3), 377–397. doi:10.4296/cwrj2603377
- Spence, C., 2007. On the relation between dynamic storage and runoff: a discussion on the thresholds, efficiency and function. Water Resources Research, 43, 11. doi:10.1029/2006WR005645
- Stichling, W. and Blackwell, S.R., 1957. Drainage area as a hydrologic factor on the Canadian prairies. Toronto, ON: IUGG Proceedings.
- Tiner, R.W., 1984. Wetlands of the United States: current status and recent trends. National wetland inventory. Washington DC: US Dept. of Interior Fish and Wildlife Service, 58.
- Turner, B.C., et al., 1987. Agricultural impacts on wetland habitats on the Canadian prairies, 1981–85. Proceedings of the North American Wildlife and Natural Resources Conference, 52, 206–215.
- Van Der Kamp, G. and Hayashi, M., 2003. Comparing the hydrology of grassed and cultivated catchments in the semi-arid Canadian Prairies. Hydrological Processes, 17, 559–575. doi:10.1002/hyp.1157
- Van Der Kamp, G., Keir, D., and Evans, M.S., 2008. Long-term water level changes in closed-basin lakes of the Canadian prairies. Canadian Water Resources Journal, 33 (1), 23–38. doi:10.4296/cwrj3301023
- Vincent, L.A. and Mekis, É., 2009. Discontinuities due to joining precipitation station observations in Canada. Journal of Applied Meteorology and Climatology, 48 (1), 156–166. doi:10.1175/2008JAMC2031.1
- Vining, K.C., 2002. Simulation of streamflow and wetland storage, Starkweather Coulee Subbasin, North Dakota, water years 1981–98. Bismarck, ND: U Geological Survey Water-Resources Investigations Report 02-4113, 24.
- Vought, L.B.M., et al., 1995. Structure and function of buffer strips from a water quality perspective in agricultural landscapes. Landscape and Urban Planning, 31, 323–331. doi:10.1016/0169-2046(94)01057-F
- Wang, X.L. and Swai, V.R., 2001. Changes in extreme wave heights in northern hemisphere oceans and related atmospheric circulation regimes. Journal of Climate, 14, 2204–2221. doi:10.1175/1520-0442(2001)014<2204:COEWHI>2.0.CO;2
- Watmough, M.D. and Schmoll, M.J., 2007. Environment Canada’s Prairie and Northern Region habitat monitoring program phase 2: recent habitat trends in the Prairie Habitat, Joint Venture Technical Report Series No. 493. Edmonton, AB: Environment Canada, Canadian Wildlife Service.
- Woo, M.K. and Rowsell, R.D., 1993. Hydrology of a prairie slough. Journal of Hydrology, 146, 175–207. doi:10.1016/0022-1694(93)90275-E
- Yue, S., et al., 2002. The influence of autocorrelation on the ability to detect trend in hydrological series. Hydrological Processes, 16, 1807–1829. doi:10.1002/hyp.1095
- Yue, S. and Wang, C., 2004. Reply to comment by Xuebin Zhang and Francis Zwiers on ‘‘Applicability of prewhitening to eliminate the influence of serial correlation on the Mann–Kendall test’’. Water Resources Research, 40. doi:W03806.doi:10.1029/2003WR002547
- Zhang, X. and Zwiers, F.W., 2004. Comment on “Applicability of prewhitening to eliminate the influence of serial correlation on the Mann–Kendall test”. Water Resources Research, 40, W03805. doi:10.1029/2003WR002073
- Zittlau, W., 1979. A history of water policy development in Manitoba. MS thesis, University of Manitoba, Winnipeg.