
ABSTRACT
Total suspended sediment (TSS) data for 1960–1970 and from recent investigations (1990–2000) are used to evaluate the variability in sediment yield of the Sanaga catchment (Cameroon) and the equivalent rates of erosion. At the annual and seasonal time scales, total suspended sediment concentrations for the Mbam sub-catchment are three to four times higher than for the Sanaga basin, reflecting the higher sensitivity of the former to erosion. Classical clockwise hysteresis loops are observed in both sub-catchments, despite a significant increase in human-induced catchment changes. At the multi-year time frame (over a 40-year period), it appears that the second half of the 1990s is marked by a downward trend in TSS. This shift is due to the control infrastructures (river impoundments and ponds) installed in certain parts of the whole catchment, combined with a drop in annual rainfall and river discharge.
Editor Z.W. Kundzewicz; Associate editor not assigned
1 Introduction
Large river networks discharge dissolved or particulate substances (mineral and organic) of atmospheric and continental origins into the oceans. Atmospheric substances mainly come from rainfall, while continental substances result from weathering and erosion of rocks (Milliman and Meade Citation1983, Berner and Berner Citation1987, Pinet and Souriau Citation1988, Meybeck Citation1993). However, these two sets of processes, which act concurrently and complementarily, are controlled by the presence of water. Chemical weathering, whose role is to break down rocks, tends to deepen the soil, while erosion, which leads to the removal of these weathering products, contributes to its reduction in thickness (Tardy Citation1971, Gac and Pinta Citation1973, Boeglin and Probst Citation1998). Consequently, the solid particles made loose are carried away by runoff towards rivers, large lakes, reservoirs, intracontinental depressions or right to the ocean.
This large-scale transfer of materials, which is complex since it is controlled by both physical and human factors, necessitates the assessment of the amounts of sediment exported from catchments. Quantifying transport rates at a given moment, as well as spatio-temporal variations, requires continuous measurements of streamflow and suspended sediment concentration at the outlets of the drainage basins under study, in order to estimate the annual sediment yields (SY) and thus to infer the specific sediment yields (SSY) and the equivalent physical denudation rates, when soil density is known (Milliman and Meade Citation1983, Probst Citation1992, Walling Citation1994, Steegen et al. Citation2000).
Various studies based on this approach have been undertaken in the humid tropical zone on both sides of the Atlantic, particularly on major drainage basins such as those of the Amazon (Gaillardet et al. Citation1997, Guyot et al. Citation2005, Filizola and Guyot Citation2009), the Congo (Moukolo et al. Citation1993, Gaillardet et al. Citation1995, Laraque et al. Citation1995, Citation2009, Coynel et al. 2005), the Senegal (Gac Citation1986, Kattan et al. Citation1987) and the Niger (Boeglin et al. Citation1997, Boeglin and Probst Citation1998, Picouet et al. Citation2002). This has enabled estimation of the total sediment inputs to the ocean. In Cameroon, studies of this type were initially undertaken on rivers to characterize the solid transport regime and to establish the mass balance of continental erosion at the country scale (Nouvelot Citation1969, Citation1972a, Olivry et al. Citation1974, Olivry Citation1976, Citation1977).
Later on, investigations were made on small to medium size drainage basins in this region with the following objectives: first, to understand the effects of the variations in spatial scale in relation to tectonic history, vegetation and lithology (Sigha-Nkamdjou Citation1994, Bird et al. Citation1994, Citation1998, Ndam Ngoupayou Citation1997, Giresse and Maley Citation1998, Olivie-Lauquet et al. 2000, Braun et al. 2005); second, to evaluate the impact of environmental change of climatic and anthropogenic origin (Sighomnou Citation2004, Sigha-Nkamdjou et al. Citation2005, Liénou et al. 2005, 2009, Sighomnou et al. 2007). Regarding the latter, no widespread study has been done on the Sanaga catchment despite the fact that it provides about 90% of the hydroelectric energy of Cameroon. Therefore, monitoring total suspended sediment (TSS) in this river basin would allow for the evaluation of the effects of erosion and sediment delivery processes on the production capacity and life expectancy of reservoirs and cooling systems of power stations. Such data are also important for planning a water treatment facility along the middle course of the Sanaga River (at Batschenga) to supply potable water to Yaoundé City and its environs by 2020 (MINEE, GWP-Cmr 2009).
The present study therefore aims to quantify, based on representative water samples collected at different time scales (seasonal, annual and multi-annual), the TSS of the Sanaga catchment in order to evaluate the spatio-temporal variability of the erosion rates, and to determine the factors responsible for this variability.
2 Materials and methods
2.1 Study catchment
With an area of about 133 000 km2, the Sanaga catchment figures amongst the most important river basins in Africa and is the largest in Cameroon, where it drains nearly a quarter (65 × 1012 m3) of annual runoff that is discharged to the Atlantic Ocean (Sighomnou et al. Citation2007). It stretches between latitudes 3°38′N and 7°22′N and longitudes 9°38′E and 14°54′E, and covers different climatic zones extending from tropical climate with two seasons (annual rainfall from 1500 to 1900 mm year–1) in the north and northwest to equatorial with four seasons (annual rainfall from 1600 to 2500 mm year–1) in the south and southwest (). In a large part of its catchment, the Sanaga River drains the South Cameroon Plateau (600–900 m a.s.l.), a vast undulating topographical surface staged by faults in successive steps and locally interrupted by inselbergs (Santoir and Bopda Citation1995).
Figure 1. Map of the Sanaga drainage basin showing its main physiographic characteristics (topography, relief units, rainfall distribution) and the location of sampling sites and existing reservoirs.
Figure 2. Relationships between (a) POC (mg L–1) and (b) POC (%) contents and average TSS concentrations for the Mbam and Sanaga rivers at Ebebda (1995–1997).
Figure 3. Relationships between monthly TSS concentrations and flow discharges for the Mbam and Sanaga rivers at Ebebda, showing clockwise hysteresis loops. (1) Initial erosion, (2) attenuated or late erosion, (3) deposition.
Figure 4. Daily flow discharges and instantaneous TSS concentrations measured during a 40-year period (1966/67 to 2005/06) in (a) the Mbam at Goura (42 300 km2) and Ebebda (42 584 km2); (b) the Sanaga at Nachtigal (76 680 km2) and Ebebda (76 817 km2).
Figure 5. Outputs of the supervised classifications obtained from the mosaics of (a) Landsat MSS (1971–1978) and (b) ETM (2001–2002) images.
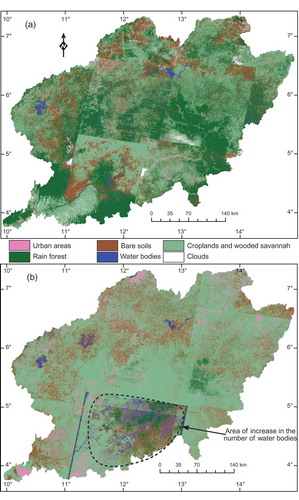
Figure 6. Temporal trends in the rainfall data sets from four main rain gauge stations located within the Sanaga catchment, as revealed by (a) linear regression and (b) discontinuity statistical tests.
Figure 7. Temporal trends in the discharge data sets from Goura and Nachtigal gauging stations, as revealed by (a) linear regression and (b) discontinuity statistical tests.
The South Cameroon Plateau is bordered to the north and west by the Cameroon Ridge, comprising a succession of high plateaus and volcanic massifs, which can be subdivided into two very distinct regions: the Adamawa Plateau (1100 m a.s.l.) and the Western Highlands (1000–1600 m). These relief units are mainly formed of Precambrian bedrock (composed of 89% plutonic and metamorphic rocks) which, in places, is covered by recent volcanic deposits and sedimentary formations (Dumort Citation1968, Regnoult Citation1986). The soil that develops on these rocks is predominantly ferrallitic (Segalen Citation1967) and supports vegetation that varies from thorn shrub Soudano-Guinean savannah in the north and northwest (almost 2/3 of the drainage basin) to a semi-deciduous forest rich in Scaphium macropodum (Sterculiacae) in the south (Dubreuil et al. Citation1975, Letouzey Citation1985).
Economic activity consists mainly of agriculture (both subsistence and industrial), animal husbandry and forestry exploitation, and thus the basic economy in the basin is predominantly rural. The main urban centres, which are located just outside of the catchment, are Yaoundé (to the south), Bafoussam (to the west) and Ngaoundere (to the north). The population density is very variable spatially (MINEE/GWP-Cmr Citation2009, BUCREP Citation2010); it ranges over 100–200 persons km–2 in the Western Highlands and the lower catchment, 50–100 persons km–2 in agro-industrial zones such as Mbandjock, and drops to 10 persons km–2 in the east with almost empty regions (Garoua-Boulaï) and the centre of the drainage basin (Yoko region).
The hydrology of the catchment is presently influenced by three reservoirs: Mbakaou (2.6 × 10⁹ m3), Bamendjin (1.8 × 10⁹ m3) and Mape (3.3 × 10⁹ m3). These infrastructures were constructed between 1969 and 1987 to increase the flow rate of the main stem and to optimize hydroelectric production in the dry season. They are located at the upper part of the watershed () and control about 18% of its surface area (Dzana et al. Citation2011). A fourth regulatory reservoir (Lom-Pangar), with a useful storage capacity of 6 × 10⁹ m3, is being built in the southeastern part of the catchment.
Upstream of Ebebda, at the Mbam and Sanaga confluence zone, the drainage basin can be subdivided into two main sub-catchments () drained by these two most important tributaries. At the Goura station, the Mbam River receives the supplies of its right-bank tributaries, particularly those flowing through the northern part of the volcanic highlands of western Cameroon. At this station, the surface area of the sub-catchment is about 42 300 km2; the average flow rates vary between 374 and 876 m3 s–1, corresponding to a mean inter-annual (1951–2006) discharge of 632 ± 129 m3 s–1 and to a specific discharge of 15 L s–1 km−2. The Sanaga River and its tributaries that drain the Adamawa Plateau in north, central and east Cameroon has a drainage basin of 76 680 km2 at the Nachtigal station. Its average flow rate varies between 553 and 1451 m3 s–1, for a mean inter-annual (1951–2006) discharge of 986 ± 178 m3 s–1 and a specific discharge of 13 L s−1 km–2.
2.2 Data and methods
2.2.1 Primary data sources: sampling site, water collection and analytical methods used
The TSS data used in this study come mainly from measurements taken during three full hydrological years (1995/96, 1996/97 and 2005/06). These measurements involved the collection of water samples near the right and left banks of the Sanaga River, immediately above the Ebebda Bridge, some 70 km north of Yaoundé (). This site, although located slightly downstream of the Mbam with Sanaga confluence, is about 1000 m wide, and has some irrefutable advantages in terms of accessibility and ease of water sampling. The choice of this site was also based on the results of preliminary studies (Ndam Ngoupayou Citation1997, Bird et al. Citation1998) and control measurements taken along a transect perpendicular to the flow direction (Kpoumié Citation2007). These earlier studies revealed a transverse gradient of suspended sediment concentration, which indicates that the Mbam and Sanaga waters, which display a very distinct difference in colour, are not yet fully mixed at this site. Also, water samples collected simultaneously from the Mbam River at Goura and from the Sanaga River at Nachtigal and at Ebebda gave results of the same order of magnitude (Ndam Ngoupayou Citation1997, Kpoumié Citation2007, Ndam Ngoupayou et al. 2007). Hence, it can be assumed that the TSS collected at the latter site, on either side of the Sanaga River, are representative for the Goura and Nachtigal gauging stations.
The different water samples were collected at 30–50 cm below the water surface, at the same place on the river, and preferentially where the flow velocity was high enough to allow for a good homogenization of the solid particles of different sizes. In fact, for the large streams of the tropical zone of Africa, including those of Cameroon, the technique of sampling along one vertical, which is rather simple, fast and practical, gives results that are satisfactory and relatively close to those of the full solid gauging method (Nouvelot Citation1972a, Citation1972b, Olivry et al. 1988, Sigha-Nkamdjou et al. Citation1998, Citation2005, Liénou et al. 2005).
Between March 1995 and February 1997 (during two successive hydrological years), samples were taken once or several times per month close to both river banks. From March 2005 till February 2006, the water samples were collected biweekly at the same sites on working days (Monday to Saturday) and on Sunday. This approach was used to verify whether the activities of sand extraction from the Sanaga River, which have intensified during the last 10 years, affect the suspended solids transport regime.
In the laboratory, the different water samples were filtered with cellulose acetate 0.45 μm membranes using a polycarbonate Millipore filtration unit. The particulate fractions retained on the filter were dried in the oven at 105°C and, after cooling in a desiccator, weighed on a Mettler type balance (0.1 mg precision). The TSS concentration was calculated from the weight of the sediment and the volume of filtered water.
For this procedure, Maneux (Citation1998) calculated a theoretical error of 5% when the suspended sediment concentration is less than or equal to 10 mg L–1 and of 3% when it is more than 10 mg L–1.
The determination of the volume weighted mean (VWM) concentration of TSS for a given period was made using the partial balance equation, which fits best for streams transporting the greatest part of their solid load during high flows (Walling and Webb Citation1981). This is formulated as follows:
where CVWM is the volume weighted mean concentration of TSS (mg L–1), Ci is the instantaneous concentration (mg L−1), and Vi is the runoff volume (L) for the period between two successive samplings. The denominator is the runoff volume for the entire sampling period.
The suspended sediment yield (SY) exported annually from a drainage basin is usually calculated from the volume weighted mean concentration and the total volume of flow (VTY) for the year as follows:
The specific sediment yield (SSY) and the physical denudation rate (DRph), which conventionally expresses the amount of ground lowering for the whole catchment, are then obtained respectively by simple equations (3) and (4), widely used and perfectly adapted to the sediment transport regime of tropical streams and to low-frequency sediment load sampling (Martin and Meybeck Citation1979, Walling and Webb Citation1981, Boeglin and Probst Citation1996, Meybeck et al. 1996) carried out on the Mbam and the Sanaga rivers:
where A is the catchment area at the sampling site and R is the annual runoff.
where D is the density of soil exposed to erosion.
To estimate the organic fractions present in the TSS, particulate organic carbon (POC) of water samples collected during the 1995/97 hydrological years was determined. The samples were filtered using fibreglass 0.7 µm Whatman GF/F membranes, earlier pyrolysed. From the filtrates obtained, the POC content was determined at the Centre de Recherches sur les Environnements Sédimentaires Océaniques (Bordeaux, France) by means of a LECO CS 125 carbon analyser (Ndam Ngoupayou Citation1997, Boeglin et al. 2005, Nkoue Ndondo Citation2008).
2.2.2 Secondary data sources: from their origin to their analysis
These data sources concern primarily TSS data from measurements of sediment load transport prior to the present study (Nouvelot Citation1969, Olivry Citation1976). They were collected from October 1966 to November 1973 on the Mbam River (Goura station) and from August 1967 to December 1969 on the Sanaga River (Nachtigal station). These samples were collected at a weekly to monthly frequency, using sampling techniques identical to those applied for our own measurements. To determine the variability in the TSS fluxes on longer time scales (about 40 years) and, especially, to identify temporal trends, these existing data were supplemented by those collected during the three years of fine observation, as stated above. At this time scale, the investigation was based on a comparison of the variations of instantaneous and volume weighted mean concentrations of total suspended sediment, sediment yields, specific sediment yields as well as physical denudation rates calculated for two distinct periods considered to be representative for the 1960s and 1970s on one hand, and the 1990s and 2000s on the other hand.
The other secondary data used were of two types, namely:
the total annual rainfall records, from 1939/40 until 2008, for four stations representative of the sub-catchments of the Mbam (Koundja) and of the Sanaga (Ngaoundere, Nanga-Eboko and Meiganga);
the mean daily river discharges measured between 1951/52 and 2005/06 on the Mbam (Goura station), on the Sanaga (Nachtigal station) and downstream on the main stem (Song-Mbengue station).
The rainfall records come from the National Directorate of Meteorology and the discharge records from the Energy Corporation of Cameroon (AES-Sonel). To investigate the link between the temporal variability of the TSS fluxes and the hydroclimatic fluctuations that occurred during the last 40 years, the annual rainfall and flow discharge series were subjected to statistical processing. This consisted of trend detection using linear regression and determination of homogeneous hydroclimatic periods via the Khronostat software, which can be freely downloaded from http://www.hydrosciences.org/. This latter tool uses a series of statistical tests of discontinuity based on various existing approaches (e.g. Lee and Heghinian Citation1977, Pettit 1979, Buishand Citation1982, Citation1984, Hubert et al. Citation1989, Citation1998).
3 Results and discussion
The variability in suspended load transport and erosion rates, as revealed by representative TSS data of the Mbam and Sanaga river systems, are highlighted and explained at three merged hierarchical time frames (seasonal, annual, multi-annual).
3.1 Annual variations in TSS fluxes
During the three years of detailed observations, the instantaneous TSS concentrations for the Mbam sub-catchment were seen to vary between 3.10 and 356.80 mg L–1, this giving a maximum/minimum ratio of 115.10 (). The inter-annual volume weighted mean concentration for the same river basin is 153.20 mg L−1. This corresponds to a sediment yield of 2.96 × 10⁶ t, a specific sediment yield of 70.12 t km–2 year–1 and an average physical denudation (DRph) rate of about 53.9 mm k year–1, if the bulk density (D) for Cameroon’s ferrallitic soil is considered as 1.3 (Humbel Citation1976).
Table 1. Estimates of TSS of the Mbam and Sanaga rivers from the three years of measurements and equivalent physical denudation rates.
For the Sanaga sub-catchment, the instantaneous TSS concentrations range from 5.40 to 81.60 mg L–1 (maximum/minimum ratio of 15.11), giving an inter-annual volume weighted mean concentration of 47.79 mg L–1 (). Sediment yield and specific sediment yield, for the three study years, are 1.3 × 10⁶ t and 17.28 t km–2 year–1, respectively. This latter value gives an average physical denudation rate of 13.3 mm kyear–1.
The Mbam and Sanaga basins, with the majority of their surface area straddling the forest–savannah contact zone, have suspended sediment yield rates that are much higher than those assessed for streams draining the south Cameroon forest zone, such as the Nyong (5.2 t km–2 year–1; Braun et al. 2005), the Ntem (10.6 t km–2 year–1; Boum et al. 1983), the Dja (11.80 t km–2 year–1; Sigha-Nkamdjou Citation1994) or the Ngoko (15.50 t km–2 year–1; Sigha-Nkamdjou Citation1994). The specific sediment yields obtained in the current study are of similar magnitude as those obtained for streams flowing through the savannah domain in the northern part of the country, such as the Mayo Tsanaga (210 t km–2 year–1; Olivry et al. Citation1974) and the Benue (85 t km–2 year–1; Nouvelot Citation1969).
Considering the TSS concentrations measured at Ebebda for the Mbam and the Sanaga rivers, and knowing the flow discharge rates at the Song-Mbengue station located downstream of their confluence, a sediment yield of about 4.7 × 10⁶ t year–1 is likely to reach the hydroelectric power stations of Song-Loulou and Edea (). The corresponding specific sediment yield is of the order of 36.67 t km–2 year–1. It is slightly higher than or of the same order of magnitude as rates recorded on the largest tropical streams of Africa (Walling Citation1984).
During the 2005/06 hydrological year, TSS concentrations measured during working days and Sundays varied little. This suggests that the extraction of sand does not significantly affect the solid transport rates at the Mbam–Sanaga confluence.
The POC contents of the suspended solids vary from 2.6 to 18.2% during the 1995/97 hydrological years in the case of the Mbam River. The POC proportion corresponds to an annual average of 3.59% weighted by the TSS (). Expressed in weight per unit volume, the POC concentration ranges from 0.76 to 8.81 mg L–1, for an annual average (weighted by the volume of flow water) of about 4.87 mg L–1 and a specific flux of 1.9 t km–2 year–1.
Table 2. Contents and proportions of particulate organic carbon (POC) for the Mbam and Sanaga waters (Ndam Ngoupayou Citation1997, Bird et al. Citation1998).
For the Sanaga River, the POC percentage of suspended solids ranges from 4.1 to 17%, for an annual average (normalized to TSS) of 6.5% (). The POC contents vary between 0.6 and 3.15 mg L–1, for an annual average (weighted by the volume of flow water) of 1.82 mg L−1; this corresponds to a specific flux of 0.66 t km–2 year–1.
Finally, it is observed that the proportion of POC in the Sanaga waters is generally very low. The mineral fraction makes up nearly all suspended solids and consists of clays of kaolinite and goethite types (40–75%) and of silts (15–40%) (Nouvelot Citation1969, Braun et al. 1998).
The percentages of POC present in the suspended solids delivered by the Sanaga River are low (2–18%) compared to those found in the rivers of the forest region of Cameroon (Nyong, Ntem and Ngoko), which are seen to vary from 10 to 40% (Sigha-Nkamdjou Citation1994, Ndam Ngoupayou et al. 2005, Nkoue Ndondo Citation2008). Concerning the POC contents, they are of the same order of magnitude as those obtained for tropical rivers such as the Amazon (2.8 mg L–1, Seyler et al. 2005), the Congo (2.1 mg L–1, Nkounkou and Probst Citation1987), the Senegal (1.5 mg L–1, Gac Citation1986) and the Niger (2.8–4.61 mg L–1, Martin and Probst Citation1991).
To summarize, at the annual time frame the suspended sediment load exported from the Mbam sub-catchment is three to four times higher than that exported from the Sanaga sub-catchment (). This result is consistent with previous studies by Nouvelot (Citation1969) and Olivry (Citation1976) at the Goura and Nachtigal stations, confirming that the Mbam basin is much more sensitive to erosion than the Sanaga catchment.
Differences in sediment yields of the two sub-catchments are mainly related to (i) rainfall and runoff variables, (ii) physiographic characteristics (geology, topography, pedology, vegetation) and (iii) anthropogenic impacts (land use, agricultural practices).
The Mbam sub-catchment, particularly its western part, receives the highest amounts of precipitation (1800–2000 mm) () compared to the upper Sanaga river basin. Combined with steep slopes and intense agricultural activities, this results in higher flow rates in the former than in the latter.
There are some minor differences in vegetation characteristics between the two sub-catchments. The vegetation of the Mbam sub-catchment consists of woody savannah or thorn shrub Soudano-Guinean (80%) and semi-deciduous forests (20%). Conversely, in the Sanaga sub-catchment, besides the fact that there is less savannah (70%), gallery forests are present, covering about 30% of the drainage area (Dubreuil et al. Citation1975, Muller and Gavaud Citation1979, Letouzey Citation1985, Giresse and Maley Citation1998). This difference in vegetation cover is reflected in the difference in POC exports of the two sub-catchments. In the Mbam, POC represents on average 3.6% of the TSS against 6.5% for the Sanaga. Using the approach proposed by Meybeck (Citation1982), the organic matter exported from these two sub-catchments accounts for 7.2% and 13% of the sediment yield, respectively.
Differences of the same order of magnitude due to vegetation are revealed by the POC/TSS relationships illustrated by . Two well-defined domains corresponding to both sub-catchments can be observed, with however the Mbam samples showing higher values of both TSS and POC. As in the case of numerous tropical rivers, the POC diminishes with increase in suspended sediment concentration (Martin and Probst Citation1991, Ludwig et al. Citation1996). High concentrations in organic matter are found in the less turbid Sanaga waters, while the contrary is observed for the Mbam River.
It is well established that relief exerts a notable influence on sediment yield, particularly where the slopes are steep enough to control the susceptibility of catchments to erosion as well as their capacity to evacuate particulate materials (Milliman and Syvitski Citation1992, Summerfield and Hulton Citation1994). The Mbam drains a high relief region with steep slopes (mean catchment slope, Sb, of 0.081), compared to that of the Sanaga sub-catchment, which has less steep slopes (Sb ≈ 0.042). Prominent contrasts in elevation existing between these two sub-catchments are also revealed by the elevation occupied by their upstream tributaries. Thus, the Mifi-South and the Noun, two main tributaries of the Mbam River, start at about 1900 and 2600 m a.s.l., while those of the Sanaga River have their sources at around only 1100 m.
Finally, the particularly high amounts of suspended sediment load exported from the Mbam are related to significant supplies from its western tributaries, which are the Noun and the Mifi rivers. On the latter stream, Olivry (Citation1976) found a specific sediment yield of about 2000 t km–2 year–1 at the Bamoungoum station. Both above-mentioned tributaries drain parts of the more densely populated compartments of the catchment (Bamoun and Bamileke regions). In these areas, the vulnerability of surficial deposits to erosion due to their original characteristics (thick soil on rocks of volcanic origin, presence of pyroclastites) and the high relief is exacerbated by agricultural practices (agriculture on ridges [billons]) which significantly increase water erosion and sediment production.
These observations corroborate studies made on small catchments in Mali and north Cameroon (Mouda), which show that intense agricultural activity combined with high runoff facilitates the mobilization of particles and their export (Thébé Citation1987, Droux et al. Citation2003). Besides, plant cover reduces the erodibility of soils in a ratio of 1 to 200 (Thébé Citation1987), while to the contrary ploughing weakens them extremely, even with a sharp decrease in overland flow.
3.2 Seasonal variations in TSS
shows how the suspended sediment concentrations respond to changes in discharge at the monthly time frame for the three years (1995/97 and 2005/06) of detailed measurements. It can be noted that the TSS concentration/monthly discharge relationships remain identical from one year to the other, forming clockwise hysteresis loops, as has been revealed in many earlier studies (Nouvelot Citation1969, Olivry et al. 1988, Picouet et al. 2002, Liénou et al. 2005). They thus may be characteristic of tropical rivers with a unimodal flow regime for which the TSS dynamics reveal three main stages of mechanical denudation: the stage of initial erosion, the stage of attenuated or late erosion and the stage of sediment deposition (Gac Citation1986, Kattan et al. Citation1987, Olivry et al. Citation1989, Boeglin and Probst Citation1996).
During the first stage, a sharp increase in turbidity is observed at the beginning of the rainy season (March to July) in spite of the comparatively low discharge (). In the case of the Mbam River, the TSS concentrations can vary from 6 mg L–1 to more than 350 mg L–1 (58.5 times the initial concentration), when, at the same time, flow discharges augment only slightly (188 to 1650 m3 s–1, about 8.5 times the initial flow rate). For the Sanaga River, the TSS concentrations increase from 5.4 to 82 mg L–1 (14.8 times the initial concentration), for discharge increasing from 145 to 1443 m3 s–1 (10 times the initial flow rate).
The high quantities of TSS exported from both sub-catchments during this period are explained by the fact that the first rains, which are of high intensity, erode the pulverized and bare soil surface. This confirms the role played by the first torrential rains in the wet season in mobilizing solid particles on slopes (Nouvelot Citation1972a, Olivry Citation1977).
During the late erosion stage, a substantial reduction in TSS concentrations with increasing discharge is observed in the rainy season (August–October) (). The TSS concentrations for the Mbam drop to 70 mg L–1, while at the same time discharges increase from 647 to 2637 m3 s–1 (4 times the initial flow rate). The same tendencies are observed for the Sanaga River, for which the TSS concentrations decrease from 80 to 20 mg L–1 and the river discharges from 982 to 2763 m3 s−1 (3 times the initial flow rate). The dilution effect as well as vegetation development, which reduces the mechanical action of the rain, are among the causes of this fall in concentrations.
Finally, the last stage (sediment deposition) is characterized by an abrupt drop in turbidity between the end of the rainy season and the dry season (November to February) (). In the case of the Mbam, the TSS contents fall from about 100 to 3 mg L–1, and flow discharges from 1069 to 102 m3 s–1. For the Sanaga, the TSS concentrations vary from 51 to 6 mg L–1 for flow discharges of 2197 to 139 m3 s–1. The arrival of the dry season, which is accompanied by a reduction in the river discharge, explains this sudden fall in the TSS concentrations and flow rates. The suspended matter transported during this stage mainly derives from the river bank erosion and from the streambeds.
3.3 Multi-year variations in TSS fluxes
The sediment yield data for the Mbam sub-catchment show that instantaneous concentrations of TSS fluctuate in the same range of variation (2–370 mg L–1) for about 40 years ((a)), with a statistically insignificant decrease (−4.38%) of volume weighted mean concentrations. At the same time, it appears that the reduction is much more significant (−17.51%) for the rates of erosion expressed as the specific sediment yield ().
Table 3. Temporal variations in the TSS of the Mbam and Sanaga rivers and their equivalent physical denudation rates over a 40-year period.
In the case of the Sanaga sub-catchment, instantaneous and volume weighted mean concentrations of TSS decrease simultaneously and substantially as do the rates of mechanical denudation. The range of instantaneous concentrations of TSS appears to be higher between 1967 and 1969 (8–175 mg L–1), and is much lower during the 1995–1997 and 2005–2006 years (5–81.6 mg L–1) ((b)). The mean TSS concentrations (weighted by discharge) and erosion rates, respectively, range from 58 to 47.79 mg L–1 (−17.6%) and from 28 to 17.28 t km–2 year–1 (−38.3%) between 1968–1969 and 1995–2006, respectively ().
Although a drop in the TSS exported from both studied sub-catchments is observed, it is much more pronounced for the Sanaga than for the Mbam basin when the sediment concentrations or rates of erosion are taken into consideration (). Given the land-use changes that occurred within the Sanaga catchment, the reduction in the TSS exported at Ebebda constitutes a true paradox. In fact, by comparing the outputs of supervised classifications ((a) and (b)) derived from mosaics of Landsat MSS and ETM images of the 1970s and 2000s, an intensification of land-use change between these two distinct periods is observed. This is marked by a notable increase in surface areas devoted to agriculture (+20%), and by a lesser extent of urban (+4%) or of bare soil (+3.55%) and, conversely, by a significant reduction in the land-cover types corresponding to forest vegetation (−29%). Such modifications should have resulted in higher rates of erosion in the catchment and, as a consequence, in an increase in the sediment delivery and the TSS fluxes exported by the Mbam and the Sanaga. Nevertheless, such an increase is not noted and instead an inverse scenario is observed during this period.
An analysis of the possible reasons for such modifications occurring within the whole catchment has implicated hydroclimatic variations and their effects. In fact, linear regression applied to the annual rainfall series shows a general downward trend but of low amplitude, as shown by their negative slopes (Kpoumié et al. Citation2012). However, discontinuity statistical tests by Pettitt (Citation1979) provide further indications on the hydroclimatic variations in the Sanaga catchment. Two homogeneous periods ((b)) separated by a major break are revealed by these tests: a humid period which, for certain rain gauge stations such as Koundja, extends to the beginning of the 1980s, followed by a dry period until 2007/08 (Kpoumié et al. Citation2012). This trend is reflected in the streamflow datasets from the Goura and Nachtigal stations ( and ). These results are also consistent with recent investigations made by different authors on this issue at the scale of the Sanaga catchment (Sighomnou et al. 2007, Dzana et al. Citation2011) and at the scale of Cameroon (Sighomnou Citation2004, Sigha-Nkamdjou et al. Citation2005). The slight reduction in rainfall in this drainage basin, accompanied by a strong reduction in river discharges, is explained by a pluviometric deficit recorded since the 1970s in the whole of central and western Africa (Servat et al. 1998, Laraque et al. 2001, Mahé et al. 2001, 2013); this can also be related to the existence of several reservoirs located in the upper parts of the catchment since 1969 (Dzana et al. Citation2011).
From the results of these discontinuity statistical tests, it appears that the drop in the TSS exported from the Mbam and Sanaga sub-catchments accounts for years of low discharge that followed the major ‘hydroclimatic break’ at the beginning of the 1970s. By the same token, measurements made by Nouvelot (Citation1969) and Olivry (Citation1976, Citation1977)) reflect a stable to a surplus hydro-pluviometric context. This shows that particulate fluxes exiting a river basin can be punctuated by hydro-pluviometric variations occurring on longer time spans, although it remains difficult to disentangle the influence of climatic shifts from that of other changes in catchment conditions (Walling and Fang Citation2003).
Reservoirs installed in the Sanaga catchment constitute the other clue to the explanation of the reduction in the TSS noticed in outlets of both sub-catchments studied. Although no bathymetric surveys or drilling data allowing for the verification of this hypothesis are available, it is clear that these reservoirs, which were constructed between 1969 and 1987, favoured the trapping of sediment. This could also explain the increasing difficulty in filling them with water, independently of the hydroclimatic variability to which the whole Sanaga catchment is subjected (Fonteh Citation2003, MINEE/GWP-Cmr Citation2009). Studies done in the semi-arid regions of Africa (Lahlou Citation1994, Haregeweyn et al. 2006, Tamene et al. 2006) and elsewhere (Milliman and Farnsworth Citation2011, Gupta et al. Citation2012, Liu et al. 2013) marked by a strong susceptibility to water erosion, show that such structures can trap important quantities of materials over a short period of time. The loss of storage capacity resulting from this accelerated sediment deposition poses serious problems for the production of hydroelectric energy and irrigation or for flood protection.
Results obtained at the multi-year time scale explain why the drop in the exported TSS fluxes is higher for the Sanaga than for the Mbam sub-catchment. First, this reflects the contrasting impact of existing river impoundments. From the evolution of the instantaneous TSS concentrations of the Mbam before and after the construction of the Bamendjin (July 1974) and the Mape (July 1987) dams, it is realized that they remained high, and in the same range of variation, in spite of the drop in average concentrations. This could be explained by the fact that these two structures certainly control the compartments of the river basin with steep slopes, which represent only a small proportion, respectively 2% and 3%, of the drainage area (Dzana et al. Citation2011). Moreover, the Bamileke and Bamoun agricultural regions, where sediment delivery is significant, are located downstream from these two regulatory dams. Conversely, the drop in the TSS exported by the Sanaga (between 1967–1969 and 1995–2006) correlates with the completion of the Mbakaou reservoir in 1969. Such an evolution can be linked to the fact that this infrastructure controls a bigger area (about 15%) of the drainage basin (Dzana et al. Citation2011). Consequently, the construction and the filling of the Mbakaou dam seem to have favoured the deposition of part of the TSS supplied by the volcanic and sedimentary formations situated upstream. Meanwhile, these materials represent in ‘average’ years more than half of the solid transport of the Sanaga River at the Nachtigal station (Nouvelot Citation1972a).
The disparity in the decrease in the TSS between the Mbam and the Sanaga rivers can also be linked to the existence of numerous open water surfaces in the lower part of the sub-catchment drained by the latter (). These open water surfaces, which are used both for fish farming and for watering garden plants (fruits, vegetables) and cereals (corn), have increased since the 1990s. Two types are found here: retention ponds and small dams. The first type is connected to first- and second-order tributaries by an intake canal and a spillway. The second type results from building a wall across the river channel, leading to flooding of the upstream valley.
In this area, recent investigations on changes introduced in the production systems by agricultural migrants show that economic activities (agriculture, pisciculture), for which the above-mentioned structures were built, constitute forms of substitution and/or of complementarity to the traditional cacao economy (Essengue Nkodo Citation2013). They were developed by the local communities to compensate for the losses resulting from the fall in cacao prices on the world market. By trapping a good part of the solids delivered to the local tributaries of the Sanaga River, these infrastructures contribute to reducing the sediment load which, potentially, could be transported right to the confluence with the Mbam if they did not exist. The trap efficiency is augmented all the more as characteristics of the dams and their use favour the decantation of the stream sediments, which in this confluence zone are mainly made of fine particles (silts and clays).
4 Conclusions
On the basis of the TSS data straddling three time frames (seasonal, annual and multi-year) and representative of the two main sub-catchments of the Sanaga drainage basin, the fluxes of suspended solids and the equivalent rates of erosion could be quantified. By putting together these data, it was possible to appreciate their spatial and temporal variability and seek explanations.
Results obtained on the annual and seasonal time scales showed that average sediment concentrations and specific fluxes are three or four times higher for the Mbam than for the Sanaga sub-catchment. This suggests that differences exist in terms of erosional susceptibility and sediment production. Such differences can be explained by physiographical characteristics particular to each sub-catchment. But the overwhelming factor proves to be land use and agricultural practices (cultures on billons, monoculture) operational in the Bamileke and Bamoun regions. The higher rate of erosion observed in the Mbam sub-catchment is the cause of the significant losses of the organo-mineral soil layer noticed in this part of the Sanaga River basin and the resulting drop in agricultural activities. Despite the differences existing between the Mbam and the Sanaga sub-catchments, the seasonal variations of sediment concentrations and the annual fluxes of TSS exported by the whole river basin remain generally identical to those of other tropical regions with unimodal flow regimes.
At the multi-year time scale, a decrease in the exported TSS and subsequent rates of erosion is observed since the 1970s, which is the contrary of what should be expected in response to the significant land-use–land-cover changes that have been experienced by the Sanaga drainage basin. This tendency can certainly be correlated with the hydro-pluviometric deficit noticed from this period, but is mainly explained by the existence of reservoirs in the upper parts of the river basin, which retain a non-negligible quantity of sediments. This confirms that climatically driven changes and anthropogenic activities, particularly through dams, increasingly impact the behaviour of African rivers (Mahé et al. 2013).
The siltation of dams installed in the catchment, which is yet to be quantified by further studies, is certainly the cause of the loss of their storage capacities, as they have not been dredged for about 15 years. The decrease in TSS concentrations at this time scale between the two sub-catchments constitutes the other major outcome of the present study. It can be explained, first, by the variable size of the surface areas controlled by the reservoirs built in each of these sub-catchments. Second, it underlines the vital influence exerted by the numerous open water surfaces found at the lower part of the Sanaga sub-catchment, which are used for fish farming and agricultural purposes.
Acknowledgements
The authors are grateful to the National Electricity Company of Cameroon (AES-Sonel) which generously provided hydro-climatic data for the Sanaga catchment and information on dam operations and characteristics. They also thank the Hydrological Research Centre (HRC) of the Institute for Geological and Mining Research (IGMR) for suspended matter analyses.
Disclosure statement
No potential conflict of interest was reported by the authors.
References
- Berner, E.K. and Berner, R.A., 1987. The global water cycle: geochemistry and environment. Englewood Cliffs, USA: Prentice-Hall.
- Bird, M.I., Giresse, P., and Chivas, A.R., 1994. Effect of forest and savanna vegetation on the carbon-isotope composition of sediments from the Sanaga river, Cameroon. Limnology and Oceanography, 39 (8), 1845–1854. doi:10.4319/lo.1994.39.8.1845
- Bird, M.I., Giresse, P., and Ngos, S., 1998. A seasonal cycle in the carbon-isotope composition of organic carbon in the Sanaga river, Cameroon. Limnology and Oceanography, 43 (1), 143–146. doi:10.4319/lo.1998.43.1.0143
- Boeglin, J.-L., Mortatti, J., and Tardy, Y., 1997. Erosion chimique et mécanique sur le bassin amont du Niger (Guinée, Mali) : bilan géochimique de l’altération en milieu tropical. Comptes Rendus de l’Académie des Sciences, 325 (3), 185–191.
- Boeglin, J.-L. and Probst, J.L., 1996. Transports fluviaux de matières dissoutes et particulaires sur un bassin versant en région tropicale : le bassin du Niger au cours de la période 1990–1993. Bulletin de la Société Géologique de France, 49 (1–4), 25–45.
- Boeglin, J.-L. and Probst, J.L., 1998. Physical and chemical weathering rates and CO consumption in a tropical lateritic environment: the upper Niger basin. Chemical Geology, 148, 137–156. doi:10.1016/S0009-2541(98)00025-4
- Boeglin, J.-L., et al., 2005. Soil carbon stock and river carbon fluxes in a humid tropical environment: the Nyong river basin (South Cameroon). In: E. Roose, et al., eds. Soil erosion and carbon dynamics. Boca Raton, FL: Taylor and Francis Group, 275–287.
- Boum, J.P., et al., 1983. Etudes hydrologiques du Ntem aux chutes de Memve’ele. Campagnes 1980–1983. Technical Report. Yaoundé: DGRST-IRGM.
- Braun, J.J., et al., 2005. Present weathering rates in a humid tropical watershed: Nsimi, South Cameroon. Geochimica et Cosmochimica Acta, 96 (2), 357–387. doi:10.1016/j.gca.2004.06.022
- Braun, J.J., et al., 1998. Solid/liquid REE fractionation in the lateritic system of Goyoum, East Cameroon: the implication for the present dynamics of the soil covers of the humid tropical regions. Geochimica et Cosmochimica Acta, 62 (2), 273–299. doi:10.1016/S0016-7037(97)00344-X
- BUCREP, 2010. Rapport de présentation des résultats définitifs du 3ème Recensement Général de la Population et de l’Habitat (RGPH) de 2005. Technical Report. Yaoundé: MINEPAT.
- Buishand, T.A., 1982. Some methods for testing the homogeneity of rainfall records. Journal of Hydrology, 58, 11–27. doi:10.1016/0022-1694(82)90066-X
- Buishand, T.A., 1984. Tests for detecting a shift in the mean of hydrological time series. Journal of Hydrology, 73, 51–69. doi:10.1016/0022-1694(84)90032-5
- Coynel, A., et al., 2005. Spatial and seasonal dynamics of total suspended sediment and organic carbon species in the Congo river. Global Biogeochemical Cycles, 19 (4), 1–17. doi:10.1029/2004GB002335
- Droux, J.P., Mietton, M., and Olivry, J.C., 2003. Flux de matières particulaires en suspension en zone de savane soudanienne : l’exemple de trois bassins versants maliens représentatifs. Géomorphologie, 2, 99–110. doi:10.3406/morfo.2003.1172
- Dubreuil, P., Guiscafre, J., and Nouvelot, J.C., 1975. Le bassin versant de la rivière Sanaga. Paris: ORSTOM.
- Dumort, J.C., 1968. Notice explicative sur la feuille Douala-Ouest +cartes géologiques de reconnaissance à l’échelle de 1/50 000. Orléans: BRGM.
- Dzana, J.-G., Ndam Ngoupayou, J.R., and Tchawa, P., 2011. The Sanaga discharge at the Edea catchment outlet (Cameroon): an example of hydrologic response of a tropical rain-fed river system to changes in precipitation and groundwater inputs and to flow regulation. River Research and Application, 27, 754–771. doi:10.1002/rra.1392
- Essengue Nkodo, P.E., 2013. Les systèmes de production agricole dans le centre du Cameroun forestier, entre sélection, alternance, complémentarité et prépondérance. Thesis (PhD). University of Yaoundé 1.
- Filizola, N. and Guyot, J.L., 2009. Suspended sediment yields in the Amazon basin: an assessment using the Brazilian national data set. Hydrological Processes, 23 (22), 3207–3215. doi:10.1002/hyp.7394
- Fonteh, M.F., 2003. Water for People and the environment. Technical report. Addis Ababa: UNECA.
- Gac, J.Y., 1986. Le fleuve Sénégal. I – Bilan hydrologique et flux continentaux de matières particulaires à l’embouchure. Bulletin de la Société Géologique de France, 39 (1), 99–130.
- Gac, J.Y. and Pinta, M., 1973. Bilan de l’érosion et de l’altération en climat tropical humide. Estimation de la vitesse d’approfondissement des profils. Etude du bassin versant de l’Ouham. Cahiers ORSTOM, Série Pédologie, 5 (1), 83–96.
- Gaillardet, J., Dupré, B., and Allègre, C.J., 1995. A global geochemical mass budget applied to the Congo Basin rivers: erosion rate and continental crust composition. Geochimica et Cosmochimica Acta, 59 (17), 3469–3485. doi:10.1016/0016-7037(95)00230-W
- Gaillardet, J., et al., 1997. Chemical and physical denudation in the Amazon river basin. Chemical Geology, 142 (3–4), 141–173. doi:10.1016/S0009-2541(97)00074-0
- Giresse, P. and Maley, J., 1998. The dynamic of organic carbon in South Cameroon: fluxes in a tropical river system and a lake system as a varying sink on a glacial–interglacial time scale. Global and Planetary Change, 16–17, 53–74. doi:10.1016/S0921-8181(98)00007-1
- Gupta, H., Kao, S.-J., and Dai., M., 2012. The role of mega dams in reducing sediment fluxes: A case study of large Asian rivers. Journal of Hydrology, 464-465, 447–458. doi:10.1016/j.jhydrol.2012.07.038
- Guyot, J.L., Filizola, N., and Laraque, A., 2005. Régime et bilan du flux sédimentaire de l’Amazone à Obidos (Pará, Brésil) de 1995 à 2003. In: A.J. Horowitz and D.E. Walling, eds Sediment budgets 2. Wallingford, UK: International Association of Hydrological Sciences. IAHS Publi. 292.Wallingford: IAHS Press, 339–354.
- Haregeweyn, N., et al., 2006. Reservoirs in Tigray (northern Ethiopia): characteristics and sediment deposition problems. Land Degradation & Development, 17 (2), 211–230. doi:10.1002/ldr.698
- Hubert, P., Carbonnel, J.P., and Chaouche, A., 1989. Segmentation des séries hydrométéorologiques, application à des séries de précipitations et des débits de l’Afrique de l’Ouest. Journal of Hydrology, 110, 349–367.
- Hubert, P., et al., 1998. La procédure de segmentation, dix ans après. In: E. Servat, et al., eds. Water resources variability in Africa during the XXth century. IAHS Publication 252. Wallingford: IAHS Press, 267–273.
- Humbel, F.X., 1976. L’espace poral des sols ferrallitiques du Cameroun. Caractéristiques et comportements en relation avec les régimes hydriques et les bioclimats. Paris: ORSTOM, Collection Travaux et Documents 54.
- Kattan, Z., Gac, J.Y., and Probst, J.L., 1987. Suspended sediment load and mechanical erosion in the Senegal Basin—estimation of the surface runoff concentration and relative contributions of channel and slope erosion. Journal of Hydrology, 92, 59–76. doi:10.1016/0022-1694(87)90089-8
- Kpoumié, A., 2007. Transport solide en suspension et analyse des sédiments de la zone de contact forêt-savane : cas du bassin versant de la Sanaga à Ebebda–Cameroun. Master dissertation. University of Yaoundé 1.
- Kpoumié, A., et al., 2012. Spatiotemporal evolution of rainfall regimes in the Sanaga basin-Cameroon in a deficit context. Present Environment and Sustainable Development Journal, 6 (2), 55–68.
- Lahlou, A., 1994. Envasement des barrages au Maroc. Casablanca: Editions Wallada.
- Laraque, A., et al., 1995. Transports solides et dissous du fleuve Congo (bilan de six années d’observation). In: J.C. Olivry and J. Boulègue, eds. Grands Bassins Fluviaux Périatlantiques : congo, Niger, Amazone. Paris: ORSTOM, 133–145.
- Laraque, A., et al., 2009. A review of material transport by the Congo river and its tributaries. Hydrological Processes, 23, 3216–3224. doi:10.1002/hyp.7395
- Laraque, A., et al., 2001. Spatiotemporel variations in hydrological regimes within Central Africa during the XXth century. Journal of Hydrology, 245, 104–117. doi:10.1016/S0022-1694(01)00340-7
- Lee, A.F.S. and Heghinian, S.M., 1977. A shift of the mean level in sequence of independent normal random variables: a Bayesian approach. Technometrics, 19 (4), 503–506.
- Letouzey, R., 1985. Notice de la carte phytogéographique du Cameroun au 1/500 000. Toulouse: Institut de la Cartographie Internationale de la Végétation.
- Liénou, G., et al., 2005. Régime des flux de matières solides en suspension au Cameroun : revue et synthèse à l’échelle des principaux écosystèmes ; diversité climatique et actions anthropiques. Hydrological Science Journal, 50 (1), 11–123. doi:10.1623/hysj.50.1.111.56329
- Liénou, G., et al., 2009. Variabilité climatique et transport de matières en suspension sur le bassin versant de Mayo-Tsanaga (Extrême-Nord Cameroun). Sécheresse, 20 (1), 1–6.
- Liu, C., et al., 2013. Changes in runoff and sediment load from major Chinese rivers to the Pacific Ocean over the period 1955–2010. International Journal of Sediment Research, 28 (4), 486–495. doi:10.1016/S1001-6279(14)60007-X
- Ludwig, W., Probst, J.L., and Kempe, S., 1996. Predicting the oceanic input of organic carbon by continental erosion. Global Biogeochemical Cycles, 10, 23–41. doi:10.1029/95GB02925
- Mahé, G., et al., 2001. Trends and discontinuities in regional rainfall of West and Central Africa—1951–1989. Hydrological Science Journal, 46 (2), 211–226. doi:10.1080/02626660109492817
- Mahé, G., et al., 2013. The rivers of Africa : witness of climate change and human impact on the environment. Hydrological Processes, 27 (15), 2105–2114. doi:10.1002/hyp.9813
- Maneux, E., 1998. Erosion mécanique des sols et transports fluviaux de matières en suspension : application des systèmes d’information géographique dans les bassins versants de l’Adour, de la Dordogne et de la Garonne. Thesis (Ph.D). University of Bordeaux 1.
- Martin, J.M. and Meybeck, M., 1979. Elemental mass-balance of material carried by major world rivers. Marine Chemistry, 7, 173–206. doi:10.1016/0304-4203(79)90039-2
- Martin, O. and Probst, J.L., 1991. Biogeochemistry of major African rivers: carbon and mineral transport. In: E.T. Degens, S. Kempe, and J.E. Richey, eds. Biogeochemistry of major world rivers. SCOPE Report 42. Chichester: John Wiley ’ Sons, 127–155.
- Meybeck, M., 1982. Carbon, nitrogen and phosphorus transport by world rivers. American Journal of Science, 282, 401–450. doi:10.2475/ajs.282.4.401
- Meybeck, M., 1993. Riverine transport of atmospheric carbon: sources, global typology and budget. Water, Air & Soil Pollution, 70 (1–4), 443–463. doi:10.1007/BF01105015
- Meybeck, M., et al., 1996. Rivers. In: D. Chapman, ed. Water quality assessments, a guide to the use of biota, sediments and water in environmental monitoring. 2nd ed. Paris: UNESCO/WHO, 243–318.
- Milliman, J.D. and Farnsworth, K.L., 2011. River discharge to the coastal ocean: A global synthesis. Cambridge: Cambridge University Press.
- Milliman, J.D. and Meade, R.H., 1983. World–wide delivery of river sediment to the oceans. Journal of Geology, 91 (1), 1–21. doi:10.1086/628741
- Milliman, J.D. and Syvitski, J.P.M., 1992. Geomorphic/tectonic control of sediment discharge to the ocean: the importance of small mountainous rivers. Journal of Geology, 100, 525–544. doi:10.1086/629606
- MINEE/GWP-Cmr, 2009. Etat des lieux du secteur de l’eau au Cameroun: eau et environnement (tome 2). Technical report. Yaoundé: GWP-Cmr.
- Moukolo, N., et al., 1993. Transport en solution et en suspension par le fleuve Congo (Zaïre) et ses principaux affluents de rive droite. Hydrological Science Journal, 38 (2), 133–145. doi:10.1080/02626669309492651
- Muller, J.P. and Gavaud, M., 1979. Les sols. In: G. Laclavere, ed. Atlas de la République Unie du Cameroun. Paris: Jeune Afrique, 25–27.
- Ndam Ngoupayou, J.R., 1997. Bilans hydrogeochimiques sous forêt humide en Afrique tropicale : du bassin expérimental de Nsimi-Zoétélé aux réseaux hydrographiques du Nyong et de la Sanaga (Sud-Cameroun). Thesis (PhD). University of Paris 6.
- Ndam Ngoupayou, J.R., et al., 2005. The organic carbon dynamics of a small catchment in the humid tropics. In: D.E. Walling and A.J. Horowitz, eds. Sediment budgets 1. IAHS Publication 291. Wallingford: IAHS Press, 46–53.
- Ndam Ngoupayou, J.R., et al., 2007. Transports solides et érosion mécanique dans un écosystème tropical d’Afrique : exemple du bassin versant de la Sanaga au Sud-Cameroun. In: D. Orange et al., eds. Actes JSIRAUF (Journées Scientifiques Inter Réseaux de l’AUF). Hanoi: AUF, 1–6.
- Nkoue Ndondo, G., 2008. Le cycle du carbone en domaine tropical humide : exemple du bassin versant forestier du Nyong au sud Cameroun. Thesis (PhD). University of Toulouse 3.
- Nkounkou, R.R. and Probst, J.L., 1987. Hydrology and geochemistry of the Congo river system. SCOPE/UNEP Sonderband, 64, 483–508.
- Nouvelot, J.F., 1969. Mesures et étude des transports solides en suspension au Cameroun. Cahiers ORSTOM, Série Hydrologie, 6 (4), 43–85.
- Nouvelot, J.F., 1972a. Le régime des transports solides dans divers cours d’eau du Cameroun de 1969 à 1971. Cahiers ORSTOM, Série Hydrologie, 9 (1), 47–74.
- Nouvelot, J.F., 1972b. Méthodologie pour la mesure en réseau des transports solides en suspension dans les cours d’eau intertropicaux peu chargés. Cahiers ORSTOM, Série Hydrologie, 9 (1), 3–18.
- Olivie-Lauquet, G., et al., 2000. Crystal-chemistry of suspended matter in tropical hydrosystem: Nyong basin (Cameroon, Africa). Chemical Geology, 170, 113–131. doi:10.1016/S0009-2541(99)00244-2
- Olivry, J.C., 1976. Transports solides en suspension au Cameroun. Technical Report. Yaoundé: ONAREST-IRTIS.
- Olivry, J.C., 1977. Transports solides en suspension au Cameroun. In: Erosion and solid matter transport in inland water, Paris. IAHS Publ. 122. 134–141.
- Olivry, J.C., Bricquet, J.P., and Thiébaux, J.P., 1989. Bilan annuel et variations saisonnières des flux particulaires du Congo à Brazzaville et de l’Oubangui à Bangui. La Houille Blanche, 3, 311–316. doi:10.1051/lhb/1989038
- Olivry, J.C., et al., 1988. Transport de matière sur les grands fleuves des régions intertropicales : les premiers résultats des mesures de flux particulaires sur le bassin du fleuve Congo. In: M.P. Bordas and D.E. Walling, eds. Sediment budgets. Wallingford, UK: International Association of Hydrological Sciences, IAHS Publ. 174. 509–521.
- Olivry, J.C., Hoorelbecke, R., and Andiga, J., 1974. Quelques mesures complémentaires de transports solides en suspension au Cameroun. Technical Report. Yaoundé: ORSTOM.
- Pettitt, A.N., 1979. A non-parametric approach to the change-point problem. Applied Statistics, 28 (2), 126–135. doi:10.2307/2346729
- Picouet, C., et al., 2002. Major and trace element geochemistry in the upper Niger river (Mali): physical and chemical weathering rates and CO2 consumption. Chemical Geology, 185, 93–124. doi:10.1016/S0009-2541(01)00398-9
- Pinet, P. and Souriau, M., 1988. Continental erosion and large scale relief. Tectonics, 7, 563–582.
- Probst, J.L., 1992. Géochimie et hydrologie de l’érosion continentale. Mécanismes, bilan global actuel et fluctuations au cours des 500 derniers millions d’années. Sciences Géologiques Mémoire 94, Strasbourg.
- Regnoult, J.M., 1986. Synthèse géologique du Cameroun. Yaoundé: Ministère des Mines et de l’Energie.
- Santoir, C. and Bopda, A., 1995. Atlas régional du Sud-Cameroun. Paris: ORSTOM-MINREST.
- Segalen, P., 1967. Les sols et la géomorphologie du Cameroun. Cahiers ORSTOM, Série Pédologie, 5 (2), 137–188.
- Servat, E., et al., 1998. Identification, caractérisation et conséquences d’une variabilité hydrologique en Afrique de l’ouest et centrale. In: E. Servat, et al., eds. Water resources variability in Africa during the XXth century. Wallingford, UK: International Association of Hydrological Sciences, IAHS Publi. 252. 323–337.
- Seyler, P., et al., 2005. Organic carbon transported by the equatorial rivers: example of Zaire–Congo and Amazon basins. In: E.J. Roose, et al., eds. Soil Erosion and carbon dynamics. Boca Raton, FL: CRC Press, 255–274.
- Sigha-Nkamdjou, L., et al., 1998. Qualité de l’eau à certains sites du Lom, du Pangar et de la Sanaga. Technical Report. Yaoundé: IRGM.
- Sigha-Nkamdjou, L., 1994. Fonctionnement hydrochimique d’un écosystème forestier de l’Afrique Centrale : la Ngoko à Moloundou (Sud-Est du Cameroun). Thesis (PhD). University of Paris XI. Coll. TDM n° 111. Paris: ORSTOM.
- Sigha-Nkamdjou, L., et al., 2005. Impacts des modifications climatiques et anthropiques sur les flux de matières de quelques bassins fluviaux du Cameroun. In: A.J. Horowitz and D.E. Walling, eds. Sediment budgets 2. Wallingford, UK: International Association of Hydrological Sciences, IAHS Publ. 292. 291–298.
- Sighomnou, D., 2004. Analyse et redéfinition des régimes climatiques et hydrologiques du Cameroun : perspectives d’évolution des ressources en eau. Thesis (Doctorat d’Etat). University of Yaoundé 1.
- Sighomnou, D., et al., 2007. Impacts des fluctuations climatiques sur le régime des écoulements du fleuve Sanaga au Cameroun, prospectives pour le XXIème siècle. In: G. Mahé, ed. Climatic and anthropogenic impacts on the variability of water resources. Technical Document in Hydrology 80. Paris: UNESCO, 173–182.
- Steegen, A., et al., 2000. Sediment export by water from an agricultural catchment in the loam Belt of central Belgium. Geomorphology, 33 (1–2), 25–36. doi:10.1016/S0169-555X(99)00108-7
- Summerfield, D.M.A. and Hulton, N.J., 1994. Natural controls of fluvial denudation rates in major world drainage basins. Journal of Geophysical Research, 99 (B7), 13871–13883. doi:10.1029/94JB00715
- Tamene, L., et al., 2006. Reservoir siltation in the semi-arid highlands of northern Ethiopia: sediment yield-catchment area relationship and a semi-quantitative approach for predicting sediment yield. Earth Surface Processes and Landforms, 31, 1364–1383. doi:10.1002/esp.1338
- Tardy, Y., 1971. Characterization of the principal weathering types by the geochemistry of waters from some European and African crystalline massifs. Chemical Geology, 7, 253–271. doi:10.1016/0009-2541(71)90011-8
- Thébé, B., 1987. Hydrodynamique de quelques sols du Nord-Cameroun : bassins versants de Mouda : contribution à l’étude des transferts d’échelles. Thesis (PhD), University of Sciences and Techniques of Languedoc, Montpellier 2.
- Walling, D.E., 1984. The sediment yields of Africa. In: D.E. Walling, S.S.D. Foster, and P. Wurzel, eds. Challenges in Africa hydrology and water resources. Wallingford, UK: International Association of Hydrological Sciences, IAHS Publ. 144. 265–283.
- Walling, D.E., 1994. Measuring sediment yield from river basins. In: R. Lal, ed Soil erosion research methods. 2nd ed. Akeny: Soil and Water Conservation Society.
- Walling, D.E. and Fang, D., 2003. Recent trends in the suspended sediment loads of the world’s rivers. Global Planetary Change, 39 (1–2), 111–126. doi:10.1016/S0921-8181(03)00020-1
- Walling, D.E. and Webb, B.W., 1981. The reliability of suspended sediment load data. In: Erosion and sediment transport measurement. Wallingford, UK: International Association of Hydrological Sciences, IAHS Publ. 133. 177–194.