
Abstract
Adequate water resources management at the basin level needs quality downscaling of climate change scenarios for application to impact assessment and adaptation work. This study evaluates the ability of a regional climate model (RegCM3) to simulate the present-day climate and regional water balance over the Niger River Basin (NRB). RegCM3 gives a good simulation of the NRB hydroclimatic features. The mean bias error for monthly temperature is 1.5°C, 0.3 mm d-1 for rainfall, and 0.4 mm d-1 for runoff. Moderate to high correlations (0.66–0.95) were found between the modelled and the observed variables. RegCM3-based water cycling indices were not statistically different from the observation. Seasonal moistening efficiency (m) ranges between 19% and 37%; 66% of the available atmospheric moisture over NRB precipitates between June and September, of which 21% originates from local evaporation. The result suggests that the moisture sink period is July to October with very high precipitation efficiency over the basin. The model reproduces the hydroclimatology of the NRB and hence is a suitable tool for further studies relating to the assessment of climate change impacts on river basin water systems.
Editor Z. W. Kundzewicz; Associate editor D. Hughes
1 Introduction
Information regarding hydroclimatological issues is important within the context of global warming, water and energy cycles, and increasing demand for water due to population and economic growth (Oguntunde et al. Citation2006, Citation2011). Worldwide, observations and models have been used for different studies on regional climate and hydrology. Simulation models remain crucial tools in gaining insight into the interactions between climate and water systems, especially in data-sparse environments (van de Giesen et al. Citation2002). Although global circulation models (GCMs) are primary tools for simulating past climate and projecting the future climate under different climate forcing scenarios, their typical horizontal resolution (about 300 km) makes their results less applicable at local or national scale because they cannot resolve local-scale features that play important roles in regional climate (Jung and Kunstman Citation2007, Abiodun et al. Citation2012, Gbobaniyi et al. Citation2013). Thus, regional climate modelling is one of the downscaling techniques to translate the GCMs simulations to societally relevant scales for effective adaptation planning (Winter and Eltahir Citation2012, Abiodun et al. Citation2013).
Recent studies have confirmed the skill of regional climate models (RCMs) to simulate the West African monsoon climatology (Afiesimama et al. Citation2006, Omotosho and Abiodun Citation2007, Sylla et al. Citation2009), as well as its variability (Paeth et al. Citation2005, Sylla et al. Citation2010, Diallo et al. Citation2012). It has been demonstrated that RCMs can help to improve the understanding of the interactions between the different dynamical features affecting precipitation (Jenkins et al. Citation2005, Sylla et al. Citation2011, Abiodun et al. Citation2012) and the influence of land-use changes on monsoon circulation dynamics (Paeth et al. Citation2005; Abiodun et al. Citation2008, Citation2012, Citation2013).
There have been concerted efforts to comparatively evaluate several RCMs over West Africa. For example, the West African Monsoon Modelling and Evaluation (WAMME) regional model intercomparison experiment (Druyan et al. Citation2010) and the Coordinated Regional Climate Downscaling Experiment (CORDEX), a new initiative by the World Climate Research Programme, aiming to coordinate international efforts in regional climate downscaling (Giorgi et al. Citation2009). Druyan et al. (Citation2010) evaluated five RCMs skills in representing the mean summer climate and the timing of monsoon onset. Four of the five models generate positive precipitation biases and all simulate negative surface air temperature biases over broad areas of West Africa. The CORDEX African Group examined the ability of 10 RCMs, between 1990 and 2008, and found acceptable performance in simulating the spatial distribution of the main precipitation and temperature features over West Africa with varied biases from model to model (Gbobaniyi et al. Citation2013, Mounkaila et al. Citation2014). Based on its good skill over West Africa, RegCM3 is one of the most frequently used RCMs for West Africa in the last few years. However, there is a need to evaluate how well RegCM3 simulates the variables that are essential for understanding the key hydroclimatological fluxes over the Niger River Basin (NRB). This understanding will provide the background and context for basin-wide environmental change analyses and the assessments of hydrological impacts under future climate scenarios.
Previous studies on the NRB have used hydrological models to investigate the flow regimes (e.g. Maidment et al. Citation2000, Mahé et al. Citation2004, Andersen et al. Citation2005, Conway and Mahé Citation2009, Mounir et al. Citation2011). Li et al. (Citation2007) applied a land-surface model and a hydrological routing model to investigate the hydrological variability in the Lake Chad Basin (LCB) and the NRB, over the period 1950–1995. However, most of the above listed studies have been restricted to a small part of the basin, making generalization and discussion over the entire basin, as a unit, difficult. Perhaps, poor data availability in most of the riparian states, which is still likely to pose problems for some time to come, is responsible for this lack of a holistic study of the NRB. The use of RCMs could help address this data paucity challenge. RCMs have been used successfully in other large basins elsewhere: for example, in the Nile basin (Sun et al. Citation1999, Mohamed et al. Citation2005, Soliman et al. Citation2008, Citation2009), in the Amazon basin (Eltahir and Bras Citation1994, Coe et al. Citation2009, Citation2011), in the Mississippi basin (Benton et al. Citation1950, Betts et al. Citation1999) and in the Volta basin (van de Giesen et al. Citation2002, Jung and Kunstmann Citation2007, Kasei Citation2009). The MM5 model was validated and applied over the Volta basin for current and future climatology with satisfactory results (van de Giesen et al. Citation2002, Jung and Kunstmann Citation2007). Kasei (Citation2009) successfully used the outputs of MM5 to drive the hydrological model WaSiM for climate change impacts assessment on Volta River flow.
The aim of this study, therefore, is to evaluate the performance of RegCM3 in simulating the NRB hydroclimatology and moisture recycling ratios. This evaluation is unique because of its extensive comparison to observations, which include rainfall, temperature, evapotranspiration, runoff, soil moisture, shortwave radiation, longwave radiation, and the basin-wide water recycling indices.
2 Materials and methods
2.1 Study area
The NRB is located in West Africa and covers 2.27 million km2 between latitudes 5°N and 24°N, and longitudes 12°W and 17°E. The source of the Niger is located close to the Fouta Djallon Mountains in the south of Guinea at an altitude of about 800 m. With a length of 4200 km, the Niger River is the third longest river in Africa after the Nile and the Congo. The Niger traverses four countries: Guinea, Mali, Niger and Nigeria. The river basin is shared by 10 countries, namely Algeria, Benin, Burkina Faso, Cameroon, Chad, Côte d’Ivoire, Guinea, Mali, Niger and Nigeria. However, the active drainage area () of the basin, which is the focus of this study, excludes Algeria.
Figure 1. Model domain and topography used in this study. The regions designated as Guinea, Savanna and Sahel over West Africa are indicated. The Niger River Basin is shown with a blue line.

The Niger crosses areas with different climatic characteristics. A large part of the river basin is located in the Sahel, a semi-arid area between the Sahara desert and the Sudanian savannas. Precipitation ranges from 250–750 mm year-1 in the sahelian/desert zone to over 2000 mm year-1 close to the river mouth in the Guinean/coastal zone, with length of rainy season varying from 3 to 7 months (Andersen et al. Citation2005, Entwicklungsbank Citation2010). Due to the topographical and hydrological characteristics, the river is often divided into four sub-basins (Entwicklungsbank Citation2010): the Upper Niger, the Central Delta, the Middle Niger and the Lower Niger. The river flows northeast through the Upper Niger basin and enters the Central Delta in Mali. During the rainy season, the delta forms a large flood plain of 20 000 to 30 000 km2, facilitating the cultivation of rice, cotton and wheat, as well as cattle herding and fishing (Entwicklungsbank Citation2010). The size of the flooded area is subject to strong annual variations, depending on the discharge of the Upper Niger. A large part of the water is lost in the delta due to evaporation and seepage. Its main tributary, the Benue River, flows from the highlands of Cameroon and joins the Niger at Lokoja, Nigeria, before reaching the Atlantic Ocean at the Gulf of Guinea. Average river flows in the Niger Basin, based on observations made before 1960 and over 1980–2004 at the last monitoring station (Onitsha, Nigeria), are 7000 m3 s-1 and 4720 m3 s-1, respectively (Andersen et al. Citation2005).
2.2 Model description
This study used the International Centre for Theoretical Physics (ICTP) Regional Climate Model (version 3; RegCM3) as described in Pal et al. (Citation2007). The model configuration and physics options for the study are identical to those described in Pal et al. (Citation2007) and Afiesimama et al. (Citation2006). Radiative transfer is represented using the package in the National Center for Atmospheric Research (NCAR) Community Climate Model, version 3 (Kiehl et al. Citation1996). Interactions between the land surface and the atmosphere are described using the Biosphere–Atmosphere Transfer Scheme (BATS1E; Dickinson et al. Citation1993). The Zeng et al. (Citation1998) scheme is used to represent fluxes from water surfaces. The model uses the Holtslag et al. (Citation1990) counter gradient planetary boundary layer (PBL) scheme. For moist processes, the sub-grid explicit moisture and cloud scheme (SUBEX) developed by Pal et al. (Citation2000) is used. SUBEX is a physically based parameterization that includes variation of clouds, cloud water accretion, and evaporation of raindrops at the sub-grid scale. The Grell (Citation1993) mass-flux based cumulus convection scheme, with the Fritsch and Chappell (Citation1980) closure, is used for the convection parameterization.
2.3 Experiment design and boundary conditions
The model domain extends from about 9°S to 29°N and 28°W to 28°E (), with horizontal grid resolution of 40 km. In the vertical, the model extends from the surface to 50 hPa with 18 vertical grid points. Both horizontal and vertical resolutions used in the study are higher than those used in Afiesimama et al. (Citation2006) and Abiodun et al. (Citation2008), but the same as those used in Sylla et al. (Citation2010). The experiment lateral boundaries are set far away from our domain of interest in order to reduce the influence of the time-dependent inflow/outflow boundary conditions (i.e. to minimize problems with lateral boundary conditions) over the domain and to be able to fully capture the primary features that control the annual cycle of the West African monsoon. The region of focus extends from 5°N to 18°N and 12°W to 17°E.
The initial and lateral boundary conditions data for the multiyear simulation experiments are from the Max Planck Institute for Meteorology GCM, the European Centre/Hamburg model version 5 (ECHAM5) simulations (Roeckner et al. Citation2003). ECHAM5 is coupled to the MPIOM ocean model (Jungclaus et al. Citation2006), which provides 6-hourly sea-surface temperature data for the present day and future. The ECHAM5 and MPIOM simulated data for present-day (1980–2000) climate were interpolated onto the RegCM3 grid and used for the simulation. The simulation started from 1980 and ran for 21 years. The first year was used for spin-up while the remaining 20 years were analysed.
2.4 Niger River Basin water cycle
The water cycle over the entire basin was characterized using four dimensionless indices of precipitation efficiency (ρ), moistening efficiency (m), precipitation recycling ratio (β) and feedback ratio (Mohamed et al. Citation2005). The precipitation recycling in a region is the process by which evaporation from the region contributes to precipitation in the same region. The precipitation (P) over a region can be decomposed into two components—local (Pl) and advective (Pa). The advective atmospheric moisture that generates Pa can be of either oceanic and/or land evaporation source. The recycling ratio is the ratio of locally generated precipitation to total precipitation. For the NRB we have computed moisture recycling and other water cycle indices using RegCM3 and ERA-Interim reanalysis (ERAIM) outputs following the formula reported in Mohamed et al. (Citation2005). It should be noted that different definitions and formulae exist in the literature for recycling ratio. However, the Schär et al. (Citation1999) equation was used because recent studies pointed out that the earlier equations commonly used may underestimate precipitation recycling in general, because of their inherent assumptions (Brubaker et al. Citation1993, Eltahir and Bras Citation1994).
2.5 Validation dataset
The NRB falls within a data-sparse environment, therefore model evaluation is based on observational datasets of various sources. Rainfall and temperature data were taken from the Global Gridded Climatology (CRU TS 2.1) presented at 0.5 degree resolution (New et al. Citation1999, Mitchell and Jones Citation2005). The dataset of monthly surface-based climate parameters is available for the past century. Among these parameters, monthly accumulations of precipitation are generated from available station datasets, which by 1981 had increased to 14 579 gauges. Detailed information on CRU data quality control and interpretation can be found in relevant publications (Mitchell and Jones Citation2005).
Runoff, evaporation, soil moisture and atmospheric fluxes were taken from the ERA-Interim reanalysis data. Several problems experienced in the ERA-40 reanalysis were eliminated or substantially improved in the ERAIM (Berrisford et al. Citation2009). Improved performance was seen in the humidity and hydrologic cycle over the tropics. The quality of the analysis was also additionally validated; including fit of background forecasts to the observations, fit of surface winds to independent buoy winds, agreement with independent tropical-cyclone track data, and comparison of precipitation with independent estimates from the Global Precipitation Climatology Project (GPCP).
Monthly and yearly river discharges at some gauging stations on the main Niger River and its tributaries are available for different periods, especially before the 1990s, and in different reports (JICA Citation1995). Data between 1980 and 1989 were taken for Onitsha (6°10′N, 6°45′E) gauging station at the downstream of the NRB, which is the last measurement point before the river discharges into the Atlantic Ocean. The validation statistics used in comparing the observed and the simulated values are non-parametric correlation coefficient (R) and mean bias error (MBE). The MBE was computed as:
where Xi* is the simulated value and Xi is the observed value. The MBE quantifies the bias of the prediction and should be close to zero for unbiased predictions, while the square of R explains the variations in observed values captured by the simulation. The closer the value of R to 1, the better the performance of the model for a given variable. A monthly time step was used to smoothen out irregularities of the climate fields, which exist at higher temporal resolution in both ERAIM and model results. A monthly time step was considered adequate for the objectives of this study especially because the CRU data, a major source of observation, are only available at this time resolution.
3 Results and discussion
In this study, RegCM3 present-day (1981–2000) simulation results were compared with observations in the Niger River Basin, West Africa. Monthly time series results and mean annual cycles are presented for the NRB. The variables presented include precipitation, evapotranspiration, runoff, soil moisture content, surface temperature, humidity, radiation and basin-wide moisture recycling.
3.1 Niger River Basin hydroclimatology
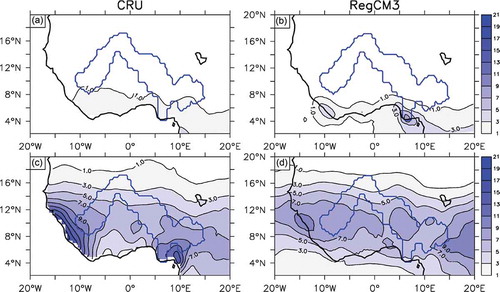
The spatial distributions of rainfall during dry (January–March; JFM) and wet (July–September; JAS) seasons are shown in . The model reproduces the zonal pattern in the rainfall fields, with the local minima and maxima. The observed 20-year average rainfall for JFM from the CRU dataset shows that the NRB is generally dry. The period corresponds to the dry season when the low-pressure system, the inter-tropical convergence zone (ITCZ), has retreated to the south and the monsoon system features are inactive. However, precipitation rates of about 1 mm d–1 are located in the southern part of the basin in the Niger Delta and along the Cameroon border. RegCM3 captures the location of the few precipitation events along the coast and Cameroon border but simulates a higher value of about 3 mm d-1 close to the NRB outlet. During the wet season (JAS), CRU () shows heavy precipitation of about 7–9 mm d-1 along the western part of the basin, in the Guinea highlands, and over most of the Cameroon Mountains and Nigerian portion of the NRB. There is a north–south gradient where rainfall increases from the desert to the Guinea coast around the Niger Delta. Higher precipitation rates in the wet season are related to the migration of the ITCZ to the north and of mesoscale convective systems (Abiodun et al. Citation2008). The RegCM3 simulation, shown in , simulates the heaviest precipitation rates, up to 7 mm d-1, in the west of the NRB and the northwestern part of Nigeria. However, RegCM3 fails to capture the precipitation maximum near the coastal regions of the basin. Similar biases (underestimation of rainfall) were reported by Afiesimama et al. (Citation2006) and Sylla et al. (Citation2010).
Figure 2. Observed (a, c) and simulated (b, d) rainfall (mm d-1) for January–March (a, b) and July–September (c, d). The Niger River Basin is shown with a blue line.
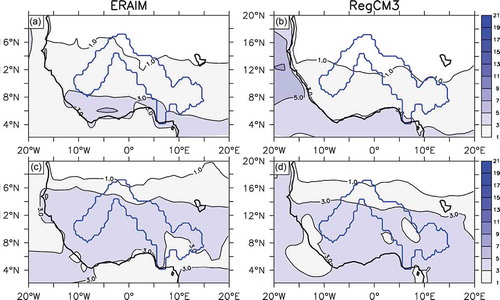
The spatial distribution of evapotranspiration (E) during JFM and JAS is shown in . Similarly to rainfall, RegCM3 reproduced the evapotranspiration data taken from ERAIM. The minimum values (<1 mm d-1) are located in the desert and the maxima of up to 3 mm d-1 are found in the southern Niger hydrological area around the coast during JFM. ERAIM () shows a north–south gradient where evaporation decreases from the desert (<1 mm d-1) to the southern part of the basin (about 3 mm d-1) along the coastal areas of the NRB during the wet season. The minima for JAS are located in the desert in Mali and in the Benue sub-basin in southeastern Nigeria and western Cameroon. RegCM3 captures the general spread and pattern of E as well as the first minimum in the desert, but locates the second one in central Nigeria away from the ERAIM location.
Figure 3. Observed (a, c) and simulated (b, d) evapotranspiration (mm d-1) for January–March (a, b) and July–September (c, d). The Niger River Basin is shown with a blue line.
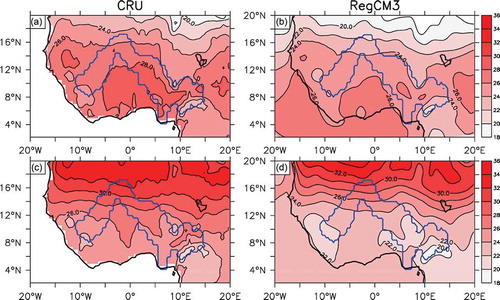
The distribution of surface air temperature is shown in –. During JFM, the observed CRU mean surface temperature distribution () shows a general latitudinal pattern but locates the lowest values (22°C) in the Cameroon Mountains and the highest (30°C) in northwestern Nigeria and along the west Niger part of the NRB. The RegCM3 model () is in good agreement with observations in simulating the mean distribution; however, it underestimates temperatures in most areas of the NRB. represents the mean JAS surface temperature distribution from CRU over the NRB. In contrast to JFM, the warmest temperatures (about 34°C) are found in the north-most part and the lowest (about 20°C) in the Benue sub-basin around the Cameroon border. In the northern parts of the basin, the RegCM3 simulation is closer to the observations than in the southern part. Despite the biases, the RegCM3 simulation captures the temperature minima over the Guinea Highlands, the Jos Plateau and the Cameroon Mountains. Similar cold bias was reported with the RegCM3 simulation driven by observed boundary conditions (Afiesimama et al. Citation2006, Sylla et al. Citation2010) and by ECHAM5 simulations (Sylla et al. Citation2010).
Figure 4. Observed (a, c) and simulated (b, d) temperature (°C) for January–March (a, b) and July–September (c, d). The Niger River Basin is shown by a blue line.
Modelled and observed data based on monthly values are presented for rainfall, evaporation, runoff and soil moisture in , while those for air temperature, humidity, shortwave and longwave radiation are shown in . RegCM3 captures the annual cycle of the surfaces over the NRB as indicated by strong correlations and low mean bias errors with respect to observed data. Observed precipitation (CRU) averaged over the basin exhibits a mono-modal peak in August (7.7 mm d-1) and a minimum in January (0.1 mm d-1). ERAIM also showed a similar but lower peak in August (6.5 mm d-1) and least rainfall of 0.34 mm d-1 in January. The observed maximum may be connected to the ITCZ migration which causes instability over the NRB during these periods. RegCM3 captures the peak rainfall (7.1 mm d-1) in August, but the lowest value is shifted to December (<1 mm d-1). In addition, the model simulates less precipitation during the first 8 months (January to August) and higher precipitation afterwards. In contrast, ERAIM estimates are lower during the monsoon season (June−September) but higher for other months. However, monthly variability of precipitation from RegCM3 is strongly correlated (0.93 and 0.98) to the observations (CRU and ERAIM), as shown in . Sylla et al. (Citation2010) also reported similar values of correlation for the Sahel and Soudano-Sahel regions of West Africa, which also constitute a major portion of the NRB.
Table 1. Evaluation statistics for validating regional climate model (version 3, RegCM3) simulations with ERA-Interim reanalysis (ERAIM). Values shown in parentheses are for comparison with CRU (Climate Research Unit) data and river discharge in the case of runoff.
Figure 5. Simulated and observed annual cycle of (a) rainfall (mm d-1), (b) evapotranspiration (mm d-1), (c) runoff (mm d-1), and (d) soil moisture (%).
Figure 6. Simulated and observed annual cycle of (a) temperature (°C), (b) relative humidity (mm d-1), (c) shortwave radiation, and (d) longwave radiation.
Similarly, RegCM3 captures the general intra-annual pattern of E (), with both peaks in September, and ERAIM values under-predicted throughout the year. The correlation between RegCM3 and ERAIM evapotranspiration is 0.82 and MBE is −0.72 mm d-1. Observed runoff exhibits a similar intra-annual distribution as rainfall with good correlations (0.73) with RegCM3. The discharge was generally under-predicted virtually all year round by both RegCM3 and values from ERAIM. The correlation between ERAIM and modelled soil moisture is 0.88 and the MBE is −4.5%. The values agree very well during the wet season compared to dry months (). Monthly distributions for air temperature, humidity and radiation (observed and simulated) are shown in –. The CRU temperature showed two maxima: it peaks at 30.6°C in April and drops to 25.8°C in August before rising to 27.2°C in October. Both RegCM3 simulations and ERAIM capture follow the annual cycle in simulating phase and amplitude, with correlation between RegCM3 and CRU (0.88) higher than that between RegCM3 and ERAIM (0.70). Average MBE was estimated as −1.5°C and −1.2°C compared to CRU and ERAIM, respectively (). Relative humidity estimated from CRU data peaks at 79% in August and showed the lowest value of 34% in February. The correlation between CRU, ERAIM and RegCM3 simulated humidities are 0.93 and 0.94 with the MBE of −5.1% and 8%, respectively. Humidity was underestimated during dry and transition months, but the values agree very well for the wet season (). The amplitudes and phases of both shortwave and longwave solar radiation in ERAIM are well captured by RegCM3 (, ). However, as shown in and , RegCM3 consistently under-predicts temperature and rainfall (some of the months) compared to the CRU data. As these two variables are very important input parameters to hydrological models, not just their seasonal pattern but also the actual values should be estimated fairly accurately. Therefore, where these are consistently under- or over-estimated, bias correction is necessary to make them useful as inputs to hydrological models for qualitative hydrological impact assessment in the NRB.
3.2 Niger River Basin water cycling
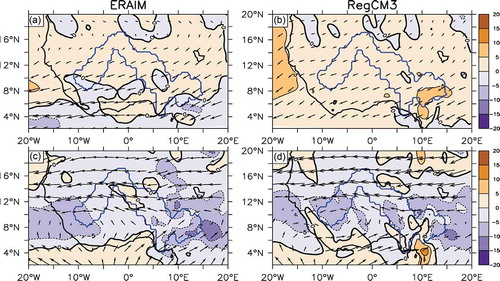
The spatial distribution of observed and simulated moisture flux (arrows) and moisture flux convergence for JFM and JAS are shown in –. The model reproduces the zonal pattern in the atmospheric moisture fields, with the local minima and maxima over the mountains. During the dry season (JFM), slight convergence occurs over some highlands that were not captured by RegCM3, but the considerable divergence that takes place over most of the NRB was adequately captured. During JAS, convergence occurs over most of the basin, with the direction of net moisture transport from the southwest, the direction of the Atlantic Ocean, over the southern part of the NRB (below 10°N) and especially in northeast Nigeria and Cameroon. The simulated southwesterlies transport cool and moist air from the Atlantic Ocean over the region, in response to the ocean–continent temperature gradient in summer. However, for locations within the basin north of 10°N, the easterly direction of net moisture transport may originate from East and/or Central Africa. RegCM3 simulated both magnitude and direction of the convergence fields very well, except that a weak divergence was located in northeastern Nigeria as against northern Burkina Faso in ERAIM. The simulated result is in agreement with a recent study by van der Ent et al. (Citation2010), who reported that the main source of rainfall in the Congo basin in Central Africa is moisture evaporated over East Africa, and, in turn, the Congo basin is a major source of moisture for rainfall in the Sahel.
Figure 7. Observed (a, c) and simulated (b, d) moisture flux (arrow) and moisture flux convergence (shaded) for January–March (a, b) and July–September (c, d). The Niger River Basin is shown by a blue line.
The monthly values of Fin and Fout derived from RegCM3 and ERAIM and averaged over 1981–2000 are presented in . Similarly, monthly NRB precipitation recycling ratio, precipitation efficiency and moistening efficiency are shown in . The comparison between RegCM3 and ERAIM based recycling ratios provides another set of indirect validation for RegCM3 hydrological processes. The monthly values of moisture fluxes showed a very similar distribution to fluxes estimated from ERAIM, slightly higher during dry months and lower during the wet months. The evaluation statistics for some NRB fluxes and water cycle are shown in . Values of Fin and Fout from RegCM3 are highly correlated with those from ERAIM (0.85 and 0.88, respectively). The underestimation of Fin (MBE = −0.68) is more than that of Fout (MBE = −0.38). The correlation computed for precipitation efficiency is 0.97 as compared to 0.47 and 0.52 for recycling ratio and moistening efficiency, respectively (). All the correlations were found to be statistically significant at the 5% level of confidence. Intra-annual water fluxes () indicated that, except during the months of July to October, the NRB is a net source of atmospheric moisture.
Table 2. Atmospheric water flux at the boundaries of Niger River Basin. Fin denotes flux into the basin and Fout flux out of the basin estimated from regional climate model (version 3, RegCM3) output and ERA-Interim reanalysis (ERAIM) data.
Table 3. Evaluation statistics for validating computed moisture fluxes and recycling ratios from regional climate model (RegCM3) output.
Figure 8. Simulated and observed annual cycle of (a) moisture recycling, (b) precipitation efficiency, and (c) moistening efficiency.
Following the seasonal pattern of P and E, ρ and to some extent m and β are relatively high during the wet months (). Based on the RegCM3 results, the lowest β (15%) was found in May and the highest (22%) in August. The lowest value of ρ (1%) was estimated for December and the peak (85%) in August. Moistening efficiency displayed similarities to β ranging between 19% and 37%. About 66% of the available atmospheric moisture in the NRB precipitates between June and September, of which around 21% originates from local evaporation. The local evaporation contributes about 32% of the atmospheric moisture over the NRB during these months. Brubaker et al. (Citation1993) found similar results of moisture sink over a selected region of West Africa only for May and June; they explained that during this period the lower Niger marshlands dry out leading to reduced E over the region and hence the advected moisture feeds the precipitation. The results of this study from both ERAIM and RegCM3 suggest that the moisture sink period is July to October and, during this time, evaporation is highest (). A critical look at showed that the difference between incoming and outgoing fluxes during this period is generally small, of the order of 1 mm d-1. Thus, the use of locally generated E, as well as Fin, lead to higher precipitation efficiency around this period. In addition, during the period when the basin acts as a moisture source, locally generated E contributes more to the atmospheric moisture, especially during onset and cessation of rains, when the Fin is lower than Fout and E is high.
Mohamed et al. (Citation2005) compared the annual water cycle over the Amazon, Mississippi and Nile basins using data presented in previous reports (e.g. Benton et al. Citation1950, Eltahir and Brass Citation1994) and a RCM over the Nile. A similar comparison for those three basins, and the NRB is presented in . The Schäl et al. (Citation1999) equation was used for the recycling ratio for all the basins, and the annual fluxes are normalized by the annual precipitation. The precipitation is 1950, 750, 557 and 1005 mm year-1 (cf. 1117 mm year-1 for ERAIM) for the Amazon, Mississippi, Nile and Niger basins, respectively. In general, the Amazon shows the largest precipitation recycling within the catchment (29%), followed by the Niger (20%), then the Nile (19%), and the Mississippi (14%). This suggests that the land–atmosphere interaction is strongest in the Amazon and weakest in the Mississippi for the four basins compared. The same is true when considering the precipitation and moistening efficiencies. However, runoff and evaporation coefficients do not exactly follow the same sequence. The runoff ratio is smallest in the Nile, followed by the Niger, and highest in the Amazon. Mohamed et al. (Citation2005) attributed this observation to excessive evaporation in the swamps and marshes within the Nile basin. Similarly, Brubaker et al. (Citation1993) also reported considerable excess evaporation from the expansive lower Niger marshlands. A comparison of the atmospheric moisture fluxes in the Nile (East Africa) to the Niger (West Africa) showed that values of Fin, Fout, P and E for the Nile are 60%, 56%, 55% and 59% of the respective parameters in the NRB.
Table 4. Annual average of parameters for the regional precipitation cycle over the Amazon, Mississippi, Nile and Niger. Values in parentheses are computed with ERA-Interim reanalysis (ERAIM) data.
4 Conclusion
This study evaluated the ability of a regional climate model (RegCM3) to simulate the Niger River Basin hydroclimatology. Observational data from various sources were used to assess the model performance. The results this study show that RegCM3 simulations gave a credible simulation of the climatology and water cycling of the basin that is in agreement with the available observed data. The model reproduced precipitation, solar radiation, relative humidity, evapotranspiration and soil moisture with moderate to very high significance (p < 0.01) based on correlation coefficients and relatively low mean bias errors. The atmospheric fluxes and recycling ratios were reproduced very well. In agreement with ERAIM data, RegCM3 output suggests that the moisture sink period is July to October, and during this period the precipitation efficiency is very high; the basin acts as a net moisture source during the other months. Based on the satisfactory performance of RegCM3, the study suggests that the model can be used for climate change impact analysis and land-use change sensitivity studies on the water systems of the Niger River Basin. However, because of obvious biases in some of the RegCM3 simulations, especially in rainfall and temperature, it is recommended that the outputs from this regional climate model be bias-corrected before they are used as inputs in hydrological models for impact studies in the basin.
Disclosure statement
No potential conflict of interest was reported by the authors.
Acknowledgements
The first author gratefully acknowledges the support of the Alexander von Humboldt Foundation, Bonn, Germany. The second author was partly supported by grants from the National Research Foundation and the Water Resource Commission of South Africa.
References
- Abiodun, B.J., et al., 2012. Modeling the impacts of reforestation on future climate in West Africa. Theoretical and Applied Climatology, 110 (1–2), 77–96. doi:10.1007/s00704-012-0614-1
- Abiodun, B.J., et al., 2008. Simulation of West African monsoon using RegCM3 Part II: impacts of deforestation and desertification. Theoretical and Applied Climatology, 93, 245–261. doi:10.1007/s00704-007-0333-1
- Abiodun, B.J., et al., 2013. Potential impacts of afforestation on climate change and extreme events in Nigeria. Climate Dynamics, 41 (2), 277–293. doi:10.1007/s00382-012-1523-9
- Afiesimama, E.A., et al., 2006. Simulation of West African monsoon using the RegCM3 Part I: model validation and interannual variability. Theoretical and Applied Climatology, 86, 23–37. doi:10.1007/s00704-005-0202-8
- Andersen, I., et al., 2005. The Niger River Basin: a vision for sustainable management, World Bank-Washington, DC Available online at http://www.worldbank.org.
- Benton, G.S., Blackburn, R.T., and Snead, V.W., 1950. The role of the atmosphere in the hydrological cycle. EOS Transaction, AGU, 31, 61–73.
- Berrisford, P., et al., 2009. The ERA-Interim archive. ERA Report Series 1, ECMWF, 16.
- Betts, A.K., Ball, J.H., and Viterbo, P., 1999. Basin-scale water and energy budgets for the Mississippi from the ECMWF reanalysis. Journal of Geophysical Research, 104, 293–306. doi:10.1029/1999JD900056
- Brubaker, K.L., Entekhabi, D., and Eagleson, P.S., 1993. Estimation of continental precipitation recycling. Journal of Climate, 6 (6), 1077–1089. doi:10.1175/1520-0442(1993)006<1077:EOCPR>2.0.CO;2
- Coe, M.T., Costa, M.H., and Soares-Filho, B.S., 2009. The influence of historical and potential future deforestation on the stream flow of the Amazon River—land surface processes and atmospheric feedbacks. Journal of Hydrology, 369, 165–174. doi:10.1016/j.jhydrol.2009.02.043
- Coe, M.T., et al., 2011. The effects of deforestation and climate variability on the streamflow of the Araguaia River, Brazil. Biogeochemistry. doi:10.1007/s10533-011-9582-2
- Conway, D. and Mahé, G., 2009. River flow modelling in two large river basins with non-stationary behaviour: the Parana and the Niger. Hydrological Processes, 23, 3186–3192. doi:10.1002/hyp.7393
- Diallo, I., et al., 2012. Interannual variability of rainfall and circulation features over the Sahel based on multiple regional climate models simulations. Theoretical and Applied Climatology. doi:10.1007/s00704-012-0791-y
- Dickinson, R.E., Henderson-Sellers, A., and Kennedy, P.J., 1993. Biosphere–atmosphere transfer scheme (BATS) version 1 as coupled to the NCAR Community Climate Model. NCAR Tech. Note TN-3871STR, National Center for Atmospheric Research, Boulder, CO, USA.
- Druyan, L.M., et al., 2010. The WAMME regional model intercomparison study. Climate Dynamics, 35, 175–192. doi:10.1007/s00382-009-0676-7
- Eltahir, E.A.B. and Bras, R.L., 1994. Precipitation recycling in the Amazon basin. Quarterly Journal of the Royal Meteorological Society, 120, 861–880. doi:10.1002/qj.49712051806
- Entwicklungsbank., 2010. Adaptation to climate change in the upper and middle Niger River Basin. River Basin snapshot, draft for discussion, Entwicklungsbank, May, 2010.
- Fritsch, J.M. and Chappell, C.F., 1980. Numerical prediction of convectively driven mesoscale pressure systems Part 1: convective parameterisation. Journal of Atmospheric Science, 37, 1722–1733. doi:10.1175/1520-0469(1980)037<1722:NPOCDM>2.0.CO;2
- Gbobaniyi, E., et al., 2013. Climatology, annual cycle and interannual variability of precipitation and temperature in CORDEX simulations over West Africa. International Journal of Climatology. doi:10.1002/joc.3834
- Giorgi, F., Jones, C., and Asrar, G.R., 2009. Addressing climate information needs at the regional level: the CORDEX framework. Geneva, Switzerland: World Meteorological Organization, Bulletin no. 58, 175.
- Grell, G.A., 1993. Prognostic evaluation of assumptions used by cumulus parameterizations. Monthly Weather Review, 121 (3), 764–787. doi:10.1175/1520-0493(1993)121<0764:PEOAUB>2.0.CO;2
- Holtslag, A.A.M., De Bruijn, E.I.F., and Pan, H.L., 1990. A high resolution air mass transformation model for short-range weather forecasting. Monthly Weather Review, 118 (8), 1561–1575. doi:10.1175/1520-0493(1990)118<1561:AHRAMT>2.0.CO;2
- JICA (Japan International Cooperation Agency), 1995. The Study on the National Water Resources. Master Plan of the Federal Ministry of Water Resources and Rural Development, Federal Republic of Nigeria, volume III.
- Jenkins, G.S., Gaye, A.T., and Sylla, B., 2005. Late 20th century attribution of drying trends in the Sahel from the regional climate model (RegCM3). Geophysical Research Letters, 32, L22705. doi:10.1029/2005GL024225
- Jung, G. and Kunstmann, H., 2007. High-resolution regional climate modeling for the Volta region of West Africa. Journal of Geophysical Research, 112, D23108. doi:10.1029/2006J
- Jungclaus, J.H., et al., 2006. Ocean circulation and tropical variability in the coupled model ECHAM5/MPI-OM. Journal of Climate, 19, 3952–3972. doi:10.1175/JCLI3827.1
- Kasei, R.A., 2009. Modelling impacts of climate change on water resources in the Volta Basin, West Africa. Thesis (PhD), Rheinische Friedrich-Wilhelms-Universität Bonn.
- Kiehl, J.T., et al., 1996. Description of the NCAR Community Climate Model (CCM3). NCAR Tech. Note TN-420STR, National Center for Atmospheric Research, Boulder, CO, USA.
- Li, K.Y., et al., 2007. Modeling the hydrological impact of land-use change in West Africa. Journal of Hydrology, 337, 258–268. doi:10.1016/j.jhydrol.2007.01.038
- Mahé, G., et al., 2004. Impact of land use change on soil water holding capacity and river modelling of the Nakambe River in Burkina-Faso. Journal of Hydrology, 300 (1–4), 33–43. doi:10.1016/j.jhydrol.2004.04.028
- Maidment, D.R., et al., 2000. Water Balance of the Niger River Basin in West Africa. In: 17th annual ESRI user conference, San Diego, CA. http://www.ce.utexas.edu/prof/maidment/atlas/esri97/ESRI.htm
- Mitchell, T.D. and Jones, P.D., 2005. An improved method of constructing a database of monthly climate observations and associated high-resolution grids International. Journal of Climatology, 25, 693–712. doi:10.1002/joc.1181
- Mohamed, Y.A., et al., 2005. Impact of Sudd wetland on the Nile hydroclimatology. Water Resources Research, 41, W08420. doi:10.1029/2004WR003792
- Mounir, Z.M., Ma, C.M., and Amadou, I., 2011. Application of water evaluation and planning (WEAP): a model to assess future water demands in the Niger River (In Niger Republic). Modern Applied Science, 5 (1), 38–49. doi:10.5539/mas.v5n1p38
- Mounkaila, M.S., Abiodun, B.J., and Omotosho, J.B., 2014. Assessing the capability of CORDEX models in simulating onset of rainfall in West Africa. Theoretical and Applied Climatology. doi:10.1007/s00704-014-1104-4.
- New, M., Hulme, M., and Jones, P.D., 1999. Representing twentieth century space–time climate variability part I: development of a 1961–90 mean monthly terrestrial climatology. Journal of Climate, 12, 829–856. doi:10.1175/1520-0442(1999)012<0829:RTCSTC>2.0.CO;2
- Oguntunde, P.G., et al., 2011. Trends and variability in pan evaporation and other climatic variables at Ibadan, Nigeria, 1973–2008. Meteorological Applications, 19, 464–472. doi:10.1002/met.281
- Oguntunde, P.G., et al., 2006. Hydroclimatology of the Volta River Basin in West Africa: trends and variability from 1901 to 2002. Physics and Chemistry of the Earth, 31, 1180–1188. doi:10.1016/j.pce.2006.02.062
- Omotosho, J. and Abiodun, B.J., 2007. A numerical study of moisture build-up and rainfall over West Africa. Meteorological Applications, 14, 209–225 doi:10.1002/met.11
- Paeth, H., et al., 2005. Regional dynamical downscaling over West Africa: model evaluation and comparison of wet and dry years. Meteorol Z, 14 (3), 349–368. doi:10.1127/0941-2948/2005/0038
- Pal, J.S., et al., 2007. The ICTP RegCM3 and RegCNET: regional climate modeling for the developing world. Bulletin American Meteorol Social, 88, 1395–1409. doi:10.1175/BAMS-88-9-1395
- Pal, J.S., Small, E.E., and Eltahir, E.A.B., 2000. Simulation of regional-scale water and energy budgets: representation of sub-grid cloud and precipitation processes within RegCM. Journal of Geophysical Research, 105, 29579–29594. doi:10.1029/2000JD900415
- Roeckner, E., et al., 2003. The atmospheric general circulation model ECHAM5 Part I: model description. Report no. 349, Max-Planck-Institut für Meteorologie, Hamburg, Germany.
- Schär, C., et al., 1999. The soil precipitation feedback: a process study with a regional climate model. Journal of Climate, 12 (3), 722–741. doi:10.1175/1520-0442(1999)012<0722:TSPFAP>2.0.CO;2
- Soliman, E.S.A., et al., 2008. Integration of NFS with regional climate model to simulate the Nile Basin hydro-climatology. Nile Basin Water Engineering Scientific Magazine, 1, 75–85.
- Soliman, E.S.A., Sayed, M.A.A., and Jeuland, J., 2009. Impact assessment of future climate change for the Blue Nile Basin, using a RCM nested in a GCM. Nile Basin Water Engineering Scientific Magazine, 2, 15–30.
- Sun, L., et al., 1999. Application of the NCAR regional climate model to eastern Africa: simulation of interannual variability of short rains. Journal of Geophysical Research, 104, 6549–6562. doi:10.1029/1998JD200050
- Sylla, M.B., et al., 2010. Simulation of the intra-seasonal and the inter-annual variability of rainfall over West Africa with RegCM3 during the monsoon period. International Journal of Climatology, 30, 1865–1883.
- Sylla, M.B., et al., 2009. High resolution simulations of West African climate using regional climate model (RegCM3) with different lateral boundary conditions. Theoretical and Applied Climatology, 98, 293–314. doi:10.1007/s00704-009-0110-4
- Sylla, M.B., et al., 2011. The impact of deep convection on the West African summer monsoon climate: a regional climate model sensitivity study. Quarterly Journal of the Royal Meteorological Society, 137, 1417–1430.
- van de Giesen, N., et al., 2002 The GLOWA-Volta project: integrated assessment of feedback mechanisms between climate, landuse and hydrology. Advances in Global Change Research, 10, 151–170. doi:10.1007/0-306-47983-4_9
- van der Ent, R.J., et al., 2010. Origin and fate of atmospheric moisture over continents. Water Resources Research, 46, W09525. doi:10.1029/2010WR009127
- Winter, J.M. and Eltahir, E.A.B., 2012. Modeling the hydroclimatology of the midwestern United States. Part 1: current climate. Climate Dynamics, 38, 573–593. doi:10.1007/s00382-011-1182-2
- Zeng, X., Zhao, M., and Dickinson, R.E., 1998. Intercomparison of bulk aerodynamic algorithms for the computation of sea surface fluxes using TOGA, COARE and TAO data. Journal of Climate, 11, 2628–2644. doi:10.1175/1520-0442(1998)011<2628:IOBAAF>2.0.CO;2