
Abstract
Understanding the relative impact of land use, land cover (LULC) and climate change (CC) on basin runoff is necessary in assessing basin water stress, for which long-term observed rainfall time series and LULC spatial data are required. However, there are challenges with the availability of spatio-temporal data, particularly the limited range of available historical hydro-meteorological measurements. The study used long-term (1961–2007) rainfall data to drive the Pitman monthly rainfall–runoff model to assess changes to the water resources of three basins in Nigeria—Asa, Ogun and Owena. Three CGCMs—CSIRO Mark3.5, MIROC3.2-medres and UKMO-HadCM3—dynamically downscaled to a 60 km by 60 km grid using the Conformal-Cubic Atmospheric Model (C-CAM) are used to simulate impacts of future climate changes on water resources. These three models were found suitable for simulating rainfall–runoff based on the insignificant differences of the modelled mean with mean of observed rainfall and temperature for pre-2010 data compared to other downscaled C-CAM models (GFDL-CM2.0, GFDL-CM2.1 and ECHAM5/MPI-Ocean model). The model results show increases in the runoff coefficient with decreases in forest cover between 1981 and 2007, with average runoff coefficients of 5.3%, 12.0% and 6.4% for Asa, Ogun and Owena basins respectively. Based on annual reduction in rainfall trend projected by CSIRO, MIROC and UKMO, the future scenarios revealed a low runoff coefficient for the three basins—Asa (CSIRO 6.0%, MIROC 6.0% and UKMO 5.9%), Ogun (CSIRO14.6%, MIROC 14.6% and UKMO 14.4%) and Owena (CSIRO 8.5%, MIROC 8.7% and UKMO 8.9%). In all scenarios, Asa basin has a lower runoff coefficient when compared to Ogun and Owena basins, indicating that future water stress in Asa basin would be much greater.
Editor Z.W. Kundzewicz; Guest editor D. Hughes
Résumé
Comprendre l’impact relatif de l’occupation des terres, du couvert végétal et du changement climatique (LULCC) sur l’écoulement d’un bassin est nécessaire pour évaluer son stress hydrique, ce qui nécessite des longues chroniques de précipitation et des données spatiales d’occupation des terres et du couvert végétal. La disponibilité des données spatio-temporelles est cependant souvent problématique, en particulier pour les mesures hydrométéorologiques historiques. L’étude a utilisé les données pluviométriques à long terme (1961-2007) dans le modèle pluie-débit mensuel de Pitman pour évaluer les modifications des ressources en eau de trois bassins du Nigeria : Asa, Ogun et Owena. Trois MCG, CSIRO Mark3.5, MIROC3.2-MEDRES et UKMO-HadCM3, dynamiquement réduits à des mailles de 60 km par 60 km en utilisant le modèle atmosphérique cubique conforme (C-CAM), ont été utilisés pour simuler les impacts des changements climatiques sur les ressources en eau. Ces trois modèles ont été jugés aptes à simuler la relation pluie-débit du fait de différences insignifiantes entre moyennes modélisées et observées des précipitations et des températures pour la période précédant 2010, en comparaison avec d'autres modèles désagrégés (GFDL-CM2.0, GFDL-CM2 0,1 et ECHAM5 / MPI-Océan). Les résultats du modèle montrent des augmentations du coefficient d’écoulement avec des diminutions du couvert forestier entre 1981 et 2007, les coefficients d’écoulement moyen étant respectivement de 5,3%, 12,0% et 6,4% pour les bassins Asa, Ogun et Owena. Sur la base de la tendance à la réduction des précipitations annuelles projetée par les modèles CSIRO, Miroc et UKMO, les scénarios prévoient un coefficient d’écoulement faible pour les trois bassins : Asa (CSIRO 6,0%, Miroc 6,0%, UKMO 5,9%), Ogun (CSIRO14.6%, Miroc 14,6%, UKMO 14,4%), et Owena (CSIRO 8,5%, 8,7% Miroc, UKMO 8,9%). Dans tous les scénarios, le bassin d'Asa a un coefficient d’écoulement inférieur à ceux d'Ogun et d'Owena, ce qui indique que le futur stress hydrique dans le bassin Asa serait beaucoup plus important.
1 Introduction
Humans have exerted large-scale changes on the terrestrial biosphere, primarily through land-use/land-cover (LULC) and climate change (CC). Optimal and sustainable water resource management requires an understanding of the impacts of LULC and climate changes on the hydrological cycle and water balance (Scanlon et al. Citation2005). The impacts of land-use/land cover changes (LULCC) on land and atmospheric components of the hydrological cycle at regional and global climate levels are increasingly recognized, but their impacts on subsurface components of the hydrological cycle are poorly understood (Pielke et al. Citation1998, Pitman et al. Citation2004, Batra et al. Citation2007). The LULCC impacts on the hydrological cycle may surpass those of climate change if human-induced LULCCs are not addressed and remedial action taken (Scanlon et al. Citation2005). Both LULCC and CC, as well as climate variability, may significantly modify the hydrological regime of basins, affecting the regional environment, ecosystems and water resources, in particular river flow regimes. In some places, they induce a temporal (and often destructive) increase in surface flows, resulting in floods, or in other places they may reduce, or even eliminate flows due to devastating drought conditions (Batra et al. Citation2007).
The above challenges, coupled with the complex and rapidly changing geography of water supply and use, make the future adequacy of water resources, especially surface water, difficult to assess. Data on climate change, socio-economic studies and river runoff, and numerical evidence on global freshwater availability have revealed that a large proportion (about two thirds) of the global population is currently experiencing water stress (Vörösmarty et al. Citation2000, OCHA Citation2010). A common explanation is that, even though there is a lot of water on Earth, only about 2.5% is fresh, and, since a large proportion of this freshwater is stored as glaciers or deep groundwater, only a small proportion is easily accessible for increasing human use (Oki Citation2005, Oki and Kanae Citation2006). However, human interference on the water cycle has also been important in explaining water stress situations in many places, especially in the developing world. In order to ‘increase’ the small proportion of available water, sustainability assessments should be carried out based on river flow regimes (Oki and Kanae Citation2006).
Climate variability, CC and LULCC remain the major drivers of the Earth’s water balance. The Earth’s surface has been extensively altered through LULCC by conversion from one land-use class to another (e.g. from forest to cultivation, or through urbanization processes), with impacts including low flows, flooding, erosion and water quality degradation (Foley et al. Citation2005, Vimal et al. Citation2010), thereby intensifying water scarcity and stress in many regions (Oki and Kanae Citation2006). Water control structures (dams and reservoirs) designed to relieve water stress may exacerbate the problem, as upstream users with limited knowledge on the hydrological processes of the catchment may influence when, how much, and what quality of water downstream users receive (Padowski and Jawitz Citation2009).
Scenario analyses help us to understand the hydrological system and processes, and provide insight into the future catchment system state as well. These analyses use a model-based approach to identify the key factors in environmental change/variability; for example, climate models are used to project future changes in climate under different emissions scenarios. In the quest to understand the complex human–environment relationships, scenario study is gaining widespread acceptance among research scientists and policy makers as a practical tool for describing the uncertainties associated with the changing attributes of aspects such as floods, runoff and drought (Light et al. Citation2013). The scenario development process provides the ability to project, assess and explore the potential risks, benefits, and management options of the conceived extremes (Kepner et al. Citation2008).
Long-term rainfall and temperature play important roles in water resources and hydrology. The amount of basin runoff considerably depends on the spatio-temporal variability of rainfall (Webb et al. Citation2004, Kumar and Duffy Citation2009). In addition to climate, the basin’s anthropogenic and physiographic (particularly the edaphic and LULC) characteristics are also of significance in generating and explaining monthly runoff patterns (Kumar and Duffy Citation2009, Peel Citation2009, Potter et al. Citation2010, Davidson et al. Citation2012, Ayeni et al. Citation2013a). Presently, hydrological simulations still face various challenges in many countries of the world where hydrological data are scarce and/or difficult to access (Kumar and Duffy Citation2009). The Fourth Assessment Report of the Intergovernmental Panel on Climate Change (IPCC Citation2007) predicts an intensification of the global hydrological cycle due to climate change and concludes that the negative impacts of climate change on freshwater systems may significantly outweigh its benefits, with runoff projected to decline in most streams and rivers. Groundwater recharge is also projected to decrease (IPCC Citation2007). River basins may therefore experience severe water stress under climate change for different reasons. For example, in low-flow periods induced by climate change, high water consumption may increase the pressure on both water quality and quantity (Amber and Matlock Citation2011).
To address the the potential impacts of climate change in southwestern Nigeria, a series of studies was carried out on climate change and water resource assessment in the region. However, extended research making use of the projections of coupled general circulation models (CGCMs) and regional climate models (RCMs) is needed to assess future water stress over the region in more detail. For the generation of river flow time series data for this study, observed rainfall data, basin physiographic (soil properties, land-use factors etc.) and detailed projections of changing rainfall and temperature patterns over southwestern Nigeria were used to force a hydrological model, in order to generate both present and future scenarios of runoff. The results of LULCC generated from remotely sensed datasets were also used to parameterize the model, to generate more realistic river flows and predict the likely future change implications on water stress.
2 Study area
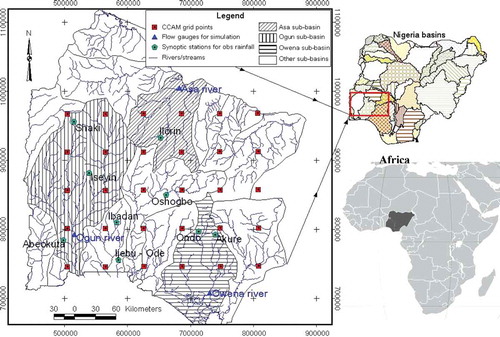
The derived savanna of southwestern Nigeria is located in the southern corridor of the River Niger. It cuts across five basins: Ogun, Oshun, Ose, Kampe and part of the Niger basin. The sub-basins within these five major basins are many and include Asa, Apoje, Opeki, Ofiki, Ose, Osun and Owena. Three basins were selected for this study—one major basin, Ogun, and two sub-basins, Asa and Owena ().
Fig. 1 Location of the study area.
2.1 General characteristics of the basins
The region is located primarily within the lowland humid tropics. As a result, the mean temperature ranges between 32°C in the northern part, around Asa sub-basin, and 26°C in the southern part of Ogun basin and Owena sub-basin. The annual rainfall ranges between 1000 and 1800 mm year-1 from north (Asa and northern part of Ogun basin) to south (southern parts of Ogun and Owena). The whole area has two distinguishable seasons—a wet season between April and October and a dry season from November to March. In the region, potential evaporation decreases towards the south due to higher air humidity.
The geology of the whole area is dominated by the Precambrian Basement complex, mainly granite, schist, gneisses, meta-sediment and older granite rocks (Adekunle et al. Citation2007, Ayeni Citation2012). These rocks are, by their nature, impervious, with limited storage capacity, except where they are weathered in situ over long periods of time, which has resulted in deep weathered saprolite capable of holding substantial amounts of water. The Ogun and Owena basin soils are classified as Ferric Acrisols with relatively higher cation profiles (Jaji et al. Citation2007, Ayeni et al. Citation2011). Asa basin has a relatively flat to undulating landscape, with interspersed hills and valleys, and is characterized by ferruginous tropical soils of crystalline acid rocks. The vegetation cover of the area is a derived secondary forest with trees, grasses, fern and bush (Fasona et al. Citation2007, Alo et al. Citation2008).
3 Materials and methods
This study assessed the impact of LULCC and CC on water stress using long-term observed and future projected rainfall data to generate monthly runoff information through hydrological simulation ().
Fig. 2 Flow chart of the methodology followed in this study to assess the water stress and scarcity.
Given the paucity of observed streamflow data, basin hydro-meteorological and physiographic characteristics were used to directly estimate the parameters of the model (Kapangaziwiri and Hughes Citation2008, Kapangaziwiri Citation2011). The conceptual Pitman monthly rainfall–runoff model (Hughes et al. Citation2006) was chosen for the generation of monthly time series of flow.
The Pitman model has found favour for water resource assessment purposes in the southern Africa region because of its relatively simple and flexible structure. The relatively low data demands (monthly rainfall totals and estimates of evaporation demand are used to drive the model) could generally be met in the study area. For this study, the revised semi-distributed version of the model that incorporates surface water–groundwater interactions (Hughes Citation2004, Hughes et al. Citation2006) was used. The choice of a coarse-scale Pitman model is premised on the understanding that, in water resources studies where medium- to long-term resource estimation and planning based on monthly data are the primary target, a monthly input model is quite adequate (Pitman Citation1978). Besides, there are very few sub-basins in the study area to provide adequate data for input to any model requiring inputs of fine time resolution.
Long-term observed rainfall and temperature data, obtained from eight different weather stations across the study area, were used to characterize the climate of the region and to drive the model to simulate streamflows. The observed rainfall and discharge data for the three selected basins—Asa, Ogun and Owena—were collected from Lower Niger Basin Authority at Ilorin, the Ogun-Osun Basin Authority at Abeokuta, and Benin-Owena at Benin, respectively. Mmonthly rainfall records of 50 years’ length (1960–2010) for Asa and Owena basins, and 30 years’ length (1980–2010) for Ogun basin were available for the study. As a result of challenges in accessing historical observed river flow data in the area, only limited monthly data for seven hydrological years (1966–1973) for Asa and nine water years (1990–1999) for Owena were available. No discharge data were available for Ogun. While these two periods are too short for any meaningful conclusions to be reached about the success of a model’s application, especially at the monthly time scale, they are the only data available and parameterizing these sub-basins (to simulate representative flows) was essential for the modelling exercise. They were thus used merely to guide the modelling to evaluate the applicability of the model. Given that the model application is based on direct parameter estimation using basin physical property data, and not calibration, this use of the available data could be instructional and adequate (see Bergstrom Citation1991, Uhlenbrook and Sieber Citation2005, Seibert and Beven Citation2009). The data on estimates of evapotranspiration demand used as input into the model were obtained from the International Water Management Institute (IWMI) database.
For the assessment of CC impacts, projected climate data (rainfall and temperature) up to the year 2050 from three of the six A2 emissions scenario CGCMs, forced with SST and sea ice, were used. The CGCMs were dynamically downscaled to a 60 km × 60 km grid over the Africa region, using the Conformal-Cubic Atmospheric Model (C-CAM). The CGCMs used in this study are:
CSIRO Mark3.5 (version 3.5 CGCM of the Commonwealth Scientific and Industrial Research Organisation, Australia);
MIROC3.2-medres (Model for Interdisciplinary Research on Climate 3.2, medium resolution version, of the Japanese Agency for Marine-Earth Science and Technology); and
UKMO-HadCM3 (the UK Met Office Hadley Centre third coupled ocean–atmosphere GCM).
Details of these models can be found in McGregor (Citation2005), Engelbrecht et al. (Citation2009, Citation2011) and Malherbe et al. (Citation2012), respectively. The C-CAM model was adopted because it employs a wide range of physical parameterizations of the CSIRO mass-flux cumulus convection scheme, which includes downdrafts and the evaporation of rainfall (Engelbrecht et al. Citation2009). The model, which also functions as a RCM, was applied in stretched-grid mode (Engelbrecht et al. Citation2009), uses lower boundary forcing in the form of SSTs and sea ice, and was specified from a transient (1871–2100) simulation from the host model (CSIRO Mk3.0 CGCM) (Engelbrecht et al. Citation2009, Citation2012). Greenhouse gas forcing in the CGCM and C-CAM simulations was specified according to the A2 emissions scenario of the IPCC’s Special Report on Emission Scenarios (SRES; Engelbrecht et al. 2009, 2012). In addition, its configuration had a resolution of about 60 km over the area of interest, which amounted to about 30 grid points, and these capture all the selected basins at uniform resolution. The experimental design, description of the numerical settings and physical parameterizations of C-CAM are detailed in Engelbrecht et al. (Citation2009, Citation2011).
This study was not designed to focus on climate model comparison; nonetheless, since C-CAM has the ability to simulate both yearly and intra-annual rainfall totals, the validation of C-CAM over the study area was based on the ensemble of CSIRO Mark3.5, MIROC3.2-medres and UKMO-HadCM3 (hereafter CSIRO, MIROC and UKMO), and qualitatively verified against observed data from eight synoptic stations in the study area before the simulation of rainfall–runoff projection. The validation of the three-model ensemble and the observed data expressed reasonable results for rainfall and temperature. On average, the results show that, between 1961 and 2008, the ensemble has deviations of −24.6 mm (CSIRO: –25.6 mm, MIROC: –23.0 m and UKMO: –25.2 mm) and 2.1°C (CSIRO: –2.0°C, MIROC: –2.1°C and UKMO: –2.2°C) from observed data for mean annual rainfall and temperature, respectively. These differences are insignificant and give a good representation of rainfall and temperature compared to the other three CGCMs, GFDL-CM2.0, GFDL-CM2.1 and MPI, with deviation of 2.4°C and 26.7 mm.
Both historical observed and C-CAM-simulated future climate data were input into the rainfall–runoff model to generate probable time series of river flows that were used to evaluate the impacts of LULCC and CC on the water resources of the basins and assess conditions of water stress. For study validation, regional features of the observed rainfall and temperature patterns over the study area were used. These include: the south–north gradient in rainfall totals over the Nigerian derived savanna; the band of relatively low rainfall that stretches from the northwest of Ogun basin to the northeast of Owena basin; and the increase in the intensity of temperature towards the northern part of the region.
3.1 Brief description of the Pitman rainfall–runoff model used
The main purpose of the modelling component of this study was to set up both the hydrological baseline and projection of the study area. Given the paucity of historical observed data (in both quantity and quality) for model calibration in the study area, the application of the model used the physically-based parameter estimation routines described in Kapangaziwiri and Hughes (Citation2008) and Kapangaziwiri (Citation2011).
The Pitman model includes explicit routines to simulate interception, infiltration excess surface runoff, soil moisture (or unsaturated zone) runoff, groundwater recharge and drainage to streamflow, evaporative losses from the unsaturated zone, as well as the groundwater storage (in the vicinity of the river channel). The model therefore has a relatively large number of parameters and it is typically impossible to establish parameter sets that generate unique results through conventional calibration approaches. However, the potential advantage of the model is that the different contributions to streamflow can be determined and should be sensitive to changes that occur within sub-basins. These changes may involve climate, land use and land cover, or different types of abstractions and water use. contains a list of the main model parameters that influence volumes of runoff generation, as well as a brief summary of the estimation approaches that are followed to quantify them. The biggest challenge was the availability of groundwater recharge data to condition the groundwater parameters of the model. These parameters were thus calibrated guided by available general global data on groundwater recharge, based on Struckmeier et al. (Citation2006) and Döll and Fiedler (Citation2008). The parameters relating to the main runoff generation and water accounting parameters were all estimated from the available basin physical property data.
Table 1 Main Pitman model parameters and a summary of the estimation methods (Hughes et al. Citation2010).
The parameter estimation routines used in this study are based on conceptual hydrology interpretation of the model parameters at the model application scale (typically 50–10 000 km2) and use basin physical property data to directly estimate parameter values. The information required includes soil depth, soil texture (which is then translated into soil hydraulic properties), topographic slope and sub-surface geological conditions of the sub-basins being modelled. The global FAO maps provided a baseline indication of the general soil types and were used in conjunction with the available national maps. However, the information on critical soil attributes such as soil depth and texture is not available on these maps and these were inferred from dominant soils map of Nigeria and literature (Sonneveld Citation1996, Aregheore Citation2009).
The model parameters derived from the estimation process and all other available relevant information on water use were then input into the model to generate time series data of the hydrology of the sub-basins. Where there were limited observed runoff data (i.e. for some parts of the Asa and Ogun basins), these were used to guide the model simulations. However, the period covered by these flow records and the quality of the data made them highly uncertain. In addition, water use in the basins is either poorly quantified or unavailable, which makes the representativeness of the available flow records of the natural hydrology of the basins dubious. In spite of these limitations in the available data, the simulations were deemed acceptable based on comparisons of the observed and simulated flows for the period between January 1990 and December 2000 at the outlet of Owena sub-basin ( and ). For a monthly time step model this length of the observed data is not adequate to make firm conclusions. However, the reasonable success of the model in reproducing the available flows for this basin is encouraging. The measure of the performance of the model is based on six objective functions: coefficient of determination (R2), coefficient of efficiency (Nash and Sutcliffe Citation1970) and the percentage error in the simulated mean monthly flow relative to the observed value (%Error), all based on untransformed and natural log transformed values. The results for Owena are given in .
Fig. 3 Time series plots of the observed and simulated monthly flows for Owena sub-basin.
Fig. 4 Flow duration curves of the simulation results of the Owena sub-basin.
Table 2 Results of the simulation of the hydrology of Owena basin. R2(Q), R2ln(Q), CE(Q) and CEln(Q) are the coefficient of efficiency values (Nash and Sutcliffe Citation1970) based on untransformed and natural log transformed values, respectively. %Error is the percentage error in the simulated mean monthly flow relative to the observed value.
While the model managed to reproduce the general water balance of the basin, it can be noted in that the low flows were generally a challenge. This could be a result of poor rainfall representation, as a limited number of gauges was available to estimate catchment average rainfall, and they were all a far distance from the flow gauging station and could not represent the local conditions properly, coupled with the poor water-use data for the basins, especially dry season abstractions that affect low flows. While the poor quality rainfall and runoff data may not have had a significant impact on the parameter estimation of the model (given that parameters were estimated directly from available basin physical data), there are still uncertainties related to the parameter estimation process (Kapangaziwiri et al. Citation2012) and the resulting predicted hydrology for the basin. However, the success of the simulations in this (poorly) gauged basin provided the confidence to apply the parameter estimation approach in the ungauged parts of the basins for this study. It is prudent to state here that, for the analysis of the impacts of climate and land-use/land cover changes, the parameters of the Pitman model were ‘dynamically adjusted’ in relation to expected changes in surface vegetation cover, rainfall magnitudes and number of rain days, storm duration, etc. inferred from the modelled LULC and future projected climate information.
3.2 Analysis of impacts of climate change
For the assessment of future water resources of the basins, most of the estimated parameters were assumed constant, except for the rainfall and evapotranspiration inputs that were changed based on the projections from the regional climate model and the surface absoption parameters based on the LULC analysis. This was a necessary assumption given that information on projected future basin characteristics could only, at best, be guesswork. For the C-CAM projected future rainfall data to be comparable to the historical observed rainfall data, some form of standardization was required given that, for the same baseline period, there were substantial differences between them. The approach adapted by the Institute for Water Research (IWR) at Rhodes University for correction of GCM data was used in this study. The method is based on correcting the main statistical distribution characteristics of the GCM baseline data to the historical data and then applying the same correction to the future data to remove bias in both means and standard deviations (Hughes et al. Citation2011).
The method used to remove this bias from the projected future rainfall estimates expresses the projected monthly rainfall as standard deviates of the baseline monthly distributions (using log values) and to scale the standard deviates with the monthly distribution statistics of the historical rainfall data as follows (Hughes et al. Citation2011):
where FRCi is the future rainfall after correction for month i and calendar month j in the time series of GCM k; LFRi is the logarithm of future rainfall for month i and calendar month j in the time series of GCM k; LBRMj is the mean of the logarithms of baseline rainfalls for GCM k and calendar month j; LBRSDj is the standard deviation of the logarithms of base line rainfalls for GCM k and calendar month j; LWRMj is the mean of the logarithms of observed rainfalls for calendar month j; and LWRSDj is the standard deviation of the logarithms of observed rainfalls for calendar month j.
The transformation removes the bias in the monthly means and variations between the historical and GCM baseline estimates, while preserving the differences between the GCM baseline and the projected future scenarios.
3.3 Land-use/land cover analysis methods
The LULCC analysis was based on spatio-temporal orthorectified Landsat imagery datasets for the period 1972–2007. The datasets were sourced from the Global Land Survey (GLS) portal (http://glovis.usgs.gov/) and include the following scenes: the Multispectral Scanner (MSS) in the 1970s, the Thematic Mapper (TM) in 1990, and the Enhanced Thematic Mapper Plus (ETM+) in 2000 and 2006. The path and row images for each year T were downloaded and processed within the ENvironment for Visualizing Images (ENVI) software using the maximum likelihood (MLH) classification technique. The ENVI software, commonly used for remote sensing and image analysis, is a state-of-the-art image processing system application designed to process and analyse geospatial imagery. For this study, four major land uses were identified and classified—built-up, forest (the study target), cultivation/others and waterbodies. The images were subjected to LULCC classification analysis and interpretation within the ENVI environment. The classified images were later imported into ArcGIS where LULCC maps were produced for visual interpretation of the spatio-temporal changes over time.
4 Results and discussion
4.1 LULCC
The LULCC analysis shown in and reveals that forested areas have reduced significantly and cultivation and built-up areas have increased within the derived savanna between 1972 and 2006.
Fig. 5 LULCC over the study area between 1972 and 2007.
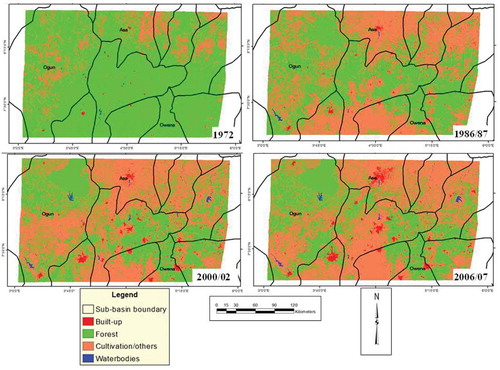
Table 3 Land-use and land-cover change between 1972 and 2007.
In 1972, forest covered almost 42 819 km2 (76.4%) of the total land cover of 56 072 km2. This was followed by cultivation/other, which occupied an area of 13 144 km2 (23%), while built-up area and waterbodies together represented only 109.3 km2 (0.25%) of the total area. In 2000–2002, a massive increase had occurred in cultivation/other (67.4%), with slight increases in built-up area (1.4%) and waterbodies (0.3%), as forest land cover continue to decrease in spatial extent (28.8%). The trend continued until 2007, as forest lost more area to built-up, cultivation/other and waterbodies (see also Ayeni et al. Citation2013b). Deforestation has the potential to influence rates of runoff and thereby increase the risks of flooding and evaporation (Amber and Matlock Citation2011). In such cases, more deforested areas experience higher runoff and evaporation, whereas cultivated areas are susceptible to more infiltration and less surface flow.
4.2 Climate change
The CC trends were analysed to evaluate its influence on water resources and to assess water stress conditions in the derived savanna of southwest Nigeria. The present-day climate and model-predicted future climatic changes, in connection with the anthropogenic LULCC, can be used to provide vital information on the evolution of freshwater dynamics in the study area.
4.2.1 Trends in rainfall and temperature
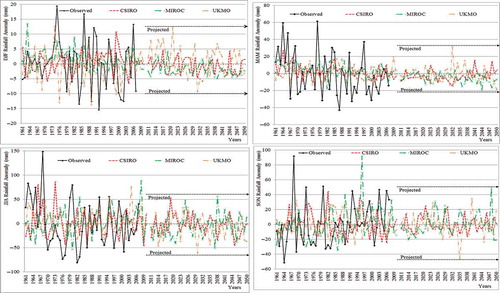
This study uses trend analysis for rainfall and temperature to smooth out events that may be extreme, but quite rare. If a model can correctly predict trends from a starting point somewhere in the past, it is expected to predict with reasonable accuracy what might happen in the future. Rainfall and temperature anomalies were generated using both observed, CSIRO, MIROC and UKMO simulated datasets, and prepared as input for the Pitman model to simulate the runoff. The seasonal average rainfall for CSIRO, MIROC and UKMO from 1961 to the year 2010 showed a decrease in inter-annual variability ()–()). This inter-annual variability is more obvious for the high-rainfall seasons of March-April-May (MAM) and June-July-August (JJA). By analysing the post-2010 period, CSIRO, MIROC and UKMO simulated reductions of 3.1%, 5.7% and 5.0%, respectively, in the region’s future rainfall scenarios.
Fig. 6 Rainfall anomalies for observed and projected C-CAMs over the area (a) DJF, (b) MAM, (c) JJA, and (d) SON).
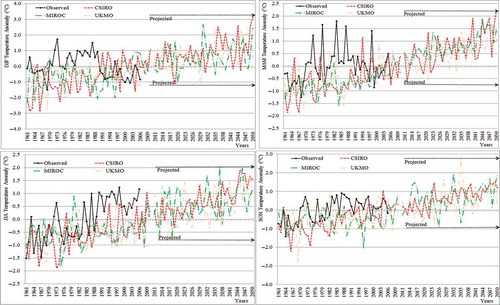
The temperature anomaly time series clearly present an increasing trend for all the seasons except for the December-January-February (DJF) averaged observed temperature ()–()). The temperature is almost 1°C warmer than the 40-year mean in 2010. The future scenario predictions vary among the three models: CSIRO prediction is highest for DJF with more than 3°C increase in 2050 ()), slightly more than 2°C increase for MAM ()), and more than 1°C but less 2°C increase for JJA and SON () and ()); MIROC only predicted more than 2°C increase for DJF ()), and for other seasons less than 2°C (), () and ()); however, UKMO predicted less than 1°C increase for DJF and SON () and ()), but a more than 1°C increase for MAM and JJA in 2050 () and ()). The post-2010 temperature analysis for CSIRO, MIROC and UKMO revealed increases of 2.2°C, 1.7°C and 0.8°C, respectively, in the year 2050 future scenarios over the region.
Fig. 7 Temperature anomalies for observed and projected C-CAMs over the area (a) DJF, (b) MAM, (c) JJA, and (d) SON).
These results imply that the area will be at greater risk of water stress in 2050, since increases in temperature and continuous deforestation may result in a high rate of evaporation, particularly over the central part of Ogun basin and the entire Asa basin where forest cover is continuously disappearing. For instance, based on analysis of mean temperatures in Africa that have risen by 1°C between 1900 and 2000, the IPCC projected an increase of 3°C by 2050 (IPCC Citation2007). In addition, Boko et al. (2007) predicted a decrease in mean annual rainfall by up to 20% along the Mediterranean coast and the northern Sahara compared to a 7% increase in tropical and eastern Africa. 2006. According to IPCC (Citation2007), these predictions imply that there will be an increase in the number of people experiencing water stress in Africa.
4.3 Runoff
The three basins demonstrated spatio-temporal variability in their simulated mean annual runoff (MAR). As at 2008, MAR was 146.5, 433.2 and 150.3 × 10⁶ m3 for Asa, Ogun and Owena basins, respectively (). As observed from , the runoff coefficient showed average increases commensurate with decreases in forest cover between 1981 and 2000 () and ()). Since the magnitude of runoff cannot be predicted with certainty at any point in the future, the model prediction results only suggest probable changes in runoff (Peel Citation2009). On average, the model results indicate that between 1981 and 2008, Asa, Ogun and Owena basins had runoff coefficients of 15.6%, 20.3% and 11.6%, respectively. The decadal time series analysis for 1981/1990 and 1991/2000 depicted an increase in the runoff coefficient for the three basins, while only Asa experienced an increase for the decades 1991/2000 and 2001/2008 (). One of the most important concerns regarding these results was that the period experienced relatively continuous deforestation and rapid urbanization between 1986/87 and 2000/02 ().
Table 4 Hydroclimatic and runoff coefficient for the observed data.
The simulations do not exhibit consistent changes in runoff for the three basins as well as for the whole period (i.e. 1981–2008); nevertheless, there were conspicuous changes in runoff that, in the absence of proper trend analyses, could be loosely inferred to reflect changes in climate and LULC (). Increases in runoff coefficient predominantly occur within the two basins (Asa and Ogun) that have more than 50% of deforested area. The Pitman model parameters used for the 2010 simulation were assumed unchanged for future scenarios. Based on this, the 40-year (2011–2050) model predictions based on CSIRO, MIROC and UKMO predicted reduction in annual rainfall under the future scenarios resulted in a low runoff coefficient for the three models (). The CSIRO model generated runoff coefficients of 6.04%, 14.58% and 8.54%; MIROC generated 5.98%, 14.57% and 8.70%, and UKMO simulated 5.87%, 14.43% and 8.87% for Asa, Ogun and Owena basins, respectively.
Table 5 Hydroclimatic and runoff coefficient for CSIRO, MIROC and UKMO scenarios.
The analyses show a significant difference in runoff coefficient for the three river basins in the 2011–2050 scenarios when compared with the observed values. The CSIRO-modelled runoff coefficient decreased by 61.3%, 61.7% and 62.4% for the Asa, Ogun and Owena basins, respectively; and corresponding values for MIROC were decreases of 28.3%, 28.3% and 29.0%, and for UKMO, decreases of 26.2%, 24.8% and 23.3%. On average, the runoff coefficients of all models decreased in the order of 61.8%, 28.6% and 24.8% for the Asa, Ogun and Owena basins, respectively. In all scenarios, the Asa basin has a lower runoff coefficient when compared to the Ogun and Owena basins. This could indicate serious water stress in the Asa basin in the future based on the Falkenmark (Citation1989) indicator, which expressed water stress as the fraction of the total annual runoff available for human use. This would imply that, in the future, the productive time of women and children living in the Asa basin area will be jeopardized by the search for domestic water, while farming activities may also suffer water deficiency.
The basin runoff coefficients resulting from hydrological responses to LULC and climate changes were evaluated using the Pitman rainfall–runoff model baseline information. This study revealed that increased deforestation and built-up are between 1980–2002 correlates with a reduction in the decadal flows between 1981 and 2000 in the three basins. This is an indication that the selected basins’ hydrology is sensitive to LULCC (Ncube and Taigbenu 2005), with a general pattern of increasing transformation and unregulated changes from forest to cultivation and built-up area, as well as decreasing transpiration. This result is consistent with the findings of Thanapakpawin et al. (Citation2006), who reported that deforestation and extensive cultivation may alter the streamflow pattern.
5 Hydro-Climate scenarios: uncertainties and challenges in the West Africa region
Globally, the availability and interpretation of appropriate hydro-climatic information form the basis of adequate assessment of the impacts and risks associated with climate change and water resources assessment, as well as effective adaptation strategies. However, disparities between hydro-climate datasets have posed challenges in the West Africa region, particularly Nigeria where direct measurements are sparse. As a result, the spatio-temporal rainfall distribution datasets and soil property information on basins remain the dominant uncertainties for water resources assessment (Bormann et al. Citation2005, Pedinotti et al. Citation2012). Other uncertainties that also influence the West Africa region’s hydro-climate datasets include socio-economic assumptions, emissions scenarios, greenhouse gas concentrations, global climate response to radiative forcing (i.e. choice of GCM, model configuration and parameters, natural climate variability), climate change information (choice of best RCM and driving GCM, model configuration and parameters, climate variability observation, downscaling methods—dynamical or statistical), and climate change impacts (Giorgi Citation2008, MacKellar et al. Citation2010). These make research capacity in the region to some degree problematic. In West Africa, generally, sparse spatial distribution and poor quality of observed hydro-climatic datasets have made it difficult for climate researchers to provide valid results (Giertz Citation2004, Bormann et al. Citation2005).
The Nigerian Meteorological Agency is under great pressure to cope with the world standard maintenance of climate measuring stations, while the methods of collecting and archiving data are not well organized. For instance, the limited raingauge stations in the country, particularly southwestern Nigeria, are at irregular intervals and are underlain with frequent malfunctions. As a result, data on the simulation results reveal an increasing uncertainty in river discharge information. In many West African countries, meteorological stations still operate manually, with measurements being recorded by hand and available to end users in paper format. In some regions, data dissemination is still very difficult since the information is not in digital format; and where it is in digital format, stations may not have an Internet connection and/or, where available, it may be marred by poor connections.
Furthermore, bureaucracy and the cost of accessing data hampers the dissemination of observed hydro-climatic datasets in some countries/regions, and the downloading of large-scale hydro-climatic datasets, such as CGCM/RCM for hydro-climate modelling, from certain internet domains is often restricted, making spatial representation of the downscaling materials even more difficult. The availability of projections of climate change at relevant spatial scales is also problematic: GCM simulations are widely available, but many are at coarse resolution and not appropriate for most applications related to impacts and adaptation, although this can be overcome by dynamical downscaling of CGCM data to RCM multimodal climate scenarios for stations in the region.
Reliable data (statistical/dynamical), particularly river flow for validation, also poses challenges in the region. Historical data are not available, or, where available, they are discontinuous and therefore cannot be used to validate the performance of climate models. Nonetheless, full spatial coverage of global gridded datasets (CRU, GRDC, GPCC and satellite observations, e.g Tropical Rainfall Measuring Mission—TRMM) based on interpolated station observations are available for validations, but their quality is questionable in regions where the station density is sparse and not uniform (Giertz Citation2004, Bormann et al. Citation2005, MacKellar et al. Citation2010).
To address the problem, it is therefore necessary for researchers/modellers in West Africa to come up with a West African regionally-based model to address the uncertainties problem. Partners (hydro-climate institutes) in developed nations should be further encouraged to assist in producing such model scenarios that can be used to address the question of uncertainty in the West Africa region (MacKellar et al. Citation2010). In addition, there should be more coordinated modelling activities and input from multiple institutes and models in the region. Although there are institutes in the region that are producing quality work in the area of hydro-climate research, further efforts are needed to adequately address critical issues and communicate effectively with decision makers to ensure that policy on climate adaptation is relevant and well-informed (MacKellar et al. Citation2010).
6 Conclusions and recommendations
Based on the findings from this study, it was observed that the changes in LULC and CC influenced the hydrology of the three selected basins. The Pitman rainfall–runoff simulation results indicate that LULCC and CC have significant impacts in the basins’ runoff. Deforestation, urbanization and increasing cultivation were commensurate with significant changes in runoff coefficient over the three selected basins. As a result, these land-use changes could possibly increase evaporation over the three basins and, therefore, result in a significantly sustained decrease in coefficient of runoff in the future. Thus, the results suggest that all water-user stakeholders in the area should adopt various options for increasing water supply schemes and capacity, as well as reducing LULC and activities that might trigger climate changes, such as excessive logging and deforestation around river catchments. For future adaptation, communities in the water-stressed basins should embrace community water development and management strategies through the following recommendations:
Government should prioritize environmental education, raise awareness on climate change and adaptation in rural areas using appropriate communication tools, such as meetings, local radio, framing messages, drama, flyers, posters, workshops, video. Awareness and strong inter-community cooperation is also required to avoid conflicts on resource access and use (Fasona et al. Citation2013). Ecosystems management should be seen as an important adaptation measure to prevent the occurrence of future extreme events, by communities and individuals, particularly in the northern and central parts of the region.
Government should encourage communities to adopt improved land-clearing methods and embrace re-afforestation around surface waters, such as streams, springs, ponds, rivers, reservoirs and lakes, since the recharge process is mainly governed by physical characteristics of the surface and the drainage system underneath. Farmers should cultivate land without completely depleting soil resources and resorting to more land protected and canopy-like crops. Some shrubs and small trees should be allowed to grow together with the crops in the farm to facilitate the re-growth of vegetation and also reduce the high rate of evaporation (Sahel and West Africa Club/OECD Citation2009). For surface water catchments, conservation in the rural communities, trees such as cashew, banana, kolanut, cocoa, almond, mango and other rain forest trees, are recommended for re-afforestation due to their dense canopy and high adaptation with the tropical environment (Buijs Citation2009, Tran et al. Citation2010), as well as their economic value. Communities should also take into account the careful selection of local vegetation for developmental purposes, and the concept that the improvement of inhabitants’ livelihood is the most important long-term objective in efforts to enhance natural resources management (Merrey et al. Citation2005, Combest-Friedman et al. Citation2012). Grazing reserves should be established in respective domains to reduce excessive grazing and also combat climate change induced grazing conflicts.
Finally, Government should encourage scenario modelling using finer spatial resolution to ascertain future climate changes and incorporating the resultant information into decision-making processes with fundamental goals to improve environmental security and ecosystems management in the rural development plans and programmes (Fasona et al. Citation2013). The results can be used to quantify future impacts for water availability and adaptation options. The adaptation should encapsulate a wide variety of related development activities (environmental and health education and programmes) that moderate climate change associated risk to potential benefits and processes of reducing vulnerability and water shortage stresses. Therefore, this study suggests the development of climate models with finer spatial resolution than the commonly-used dynamically downscaled CGCMs
Disclosure statement
No potential conflict of interest was reported by the authors.
Acknowledgements
Natural Resources and the Environment (NRE) is gratefully acknowledged for granting access to research infrastructure/materials for this study during first Author’s postdoctoral fellowship at the Council for Scientific and Industrial Research (CSIR), Pretoria, South Africa.
Additional information
Funding
REFERENCES
- Adekunle, I.M., et al., 2007. Assessment of ground—water quality in a typical rural settlement in Southwest Nigeria. International Journal Environment ResearchPublic Health, 4 (4), 307–318. doi:10.3390/ijerph200704040007
- Alo, O.A., Raruna, O.J., and Suleiman, Y., 2008. The health implications of retirement: empirical evidence from Akko area of Ondo State-Nigeria. Pakistan Journal of Social Sciences, 5 (8), 722–733.
- Amber, B. and Matlock, M.D., 2011. A review of water scarcity indices and methodologies—food, beverage & agriculture, the sustainability consortium [online]. White Paper #106. University of Arkansas, 18. Available from: http://www.sustainabilityconsortium.org/food-beverage-agriculture/ [Accessed 6 January 2014].
- Aregheore, E.M., 2009. Country pasture/forage resource profiles: Nigeria. Rome: Office of Knowledge Exchange, Research and Extension, FAO, Viale delle Terme di Caracalla.
- Ayeni, A., et al., 2013a. Assessing the impact of land use/land cover and climate changes on water stress in the derived Savanna. In: E. Bogh, et al., eds. Climate and land surface changes in hydrology. Proceedings of H01, IAHS-IAPSO-IASPEI Assembly (Gothenburg, Sweden). Wallingford, UK: International Association of Hydrological Sciences, IAHS Publ. 359, 92–98.
- Ayeni, A.O., 2012. Spatial access to domestic water sources in southwestern Nigeria. Germany: Lambert Academic Publishing & Co. KG.
- Ayeni, A.O., et al., 2013b. Could local perceptions of water stress be explained by LULCC? Geoinformation Geostatistics: An Overview, S1. http://dx.doi.org/10.4172/2327-4581.S1-001
- Ayeni, A.O., et al., 2011. Water resources development optimization in a climate change scenario: case study of Benin-Owena Basin, Nigeria. Research Journal of Environment Sciences, 5 (1), 56–64.
- Batra, N., et al., 2007. Assessing the impact of land use and land cover change on global water resources. Eos, Transactions American Geophysical Union, 88(52), Fall Meet (Suppl.), Abstract GC51B-06.
- Bergstrom, S., 1991. Principles and confidence in hydrological modelling. Nordic Hydrology, 22, 123–136.
- Bormann, H., Giertz, S., and Diekkruger, B., 2005. Hydrological catchment models between process representation, data availability and applicability for water management—case study for Benin. In: T. Wagener, ed. Regional hydrological impacts of climatic change—impact assessment and decision making. Wallingford: International Association of Hydrological Sciences. IAHS Publ. 295, 86–93.
- Boko, M., et al., 2007. Africa. Climate Change 2007: Impacts, Adaptation and Vulnerability. In: M.L. Parry, et al., eds. Contribution of Working Group II to the Fourth Assessment Report of the Intergovernmental Panel on Climate Change. Cambridge: Cambridge University Press, 433–467.
- Buijs, A.E., 2009. Public support for river restoration. A mixed-method study into local residents’ support for and framing of river management and ecological restoration in the Dutch floodplains. Journal of Environmental Management, 90 (8), 2680–2689. doi:10.1016/j.jenvman.2009.02.006
- Combest-Friedman, C., Christie, P., and Miles, E., 2012. Household perceptions of coastal hazards and climate change in the Central Philippines. Journal of Environmental Management, 112 (15), 137–148. doi:10.1016/j.jenvman.2012.06.018
- Davidson, E.A., et al., 2012. The Amazon basin in transition. Nature, 481, 321–328. doi:10.1038/nature10717
- Döll, P. and Fiedler, K., 2008. Global-scale modelling modeling of groundwater recharge. Hydrology and Earth System Sciences, 12, 863–885. doi:10.5194/hess-12-863-2008
- Engelbrecht, C.J., Engelbrecht, F.A., and Dyson, L.L., 2012. High-resolution model-projected changes in mid-tropospheric closed-lows and extreme rainfall events over southern Africa. International Journal of Climatology, [online] Wiley Online Library, doi:10.1002/joc.3420.
- Engelbrecht, F.A., et al., 2011. Multi-scale climate modelling over Southern Africa using a variable-resolution global model. Water SA, 37 (5), 647–658. doi:10.4314/wsa.v37i5.2
- Engelbrecht, F.A., McGregor, J.L., and Engelbrecht, C.J., 2009. Dynamics of the conformal- cubic atmospheric model projected climate-change signal over southern Africa. International Journal of Climatology, 29, 1013–1033. doi:10.1002/joc.1742
- Falkenmark, M., 1989. The massive water scarcity threatening Africa-why isn’t it being addressed. Ambio, 18 (2), 112–118.
- Fasona, A.S., et al., 2007. Granite derived soils in humid forest of Southwestern Nigeria—genesis, classification and sustainable management. America—Eurasian Journal Agricultural & Environment Science, 2 (2), 189–195.
- Fasona, M., et al., 2013. Some implications of terrestrial ecosystems response to climate change for adaptation in Nigeria’s wooded savannah. Environmental Development, 5, 73–95. doi:10.1016/j.envdev.2012.11.003
- Foley, J.A., et al., 2005. Global consequences of land use. Science, 309, 570–574. doi:10.1126/science.1111772
- Giertz, S. 2004. Analyse der hydrologischen Prozesse in den subhumiden Tropen Westafrikas unter besonderer Berucksichtigung der Landnutzung am Beispiel des Aguima-Einzugsgebietes in Benin. Dissertation, Math.-Nat.-Fakultät, Universität Bonn, Germany.
- Giorgi, F. 2008. Uncertainty in RCM-based regional climate change projections. Presentation at the Fourth ICTP Workshop on the Theory and Use of Regional Climate Models, Trieste 3- 4 March 2008.
- Hughes, D.A., 2004. Incorporating ground water recharge and discharge functions into an existing monthly rainfall-runoff model. Journal of Hydrology science, 29(2), 297–311.
- Hughes, D.A., et al., 2006. Regional calibration of the Pitman model for the Okavango River. Journal of Hydrology, 331, 30–42. doi:10.1016/j.jhydrol.2006.04.047
- Hughes, D.A., Kapangaziwiri, E., and Sawunyama, T., 2010. Hydrological model uncertainty assessment in southern Africa. Journal of Hydrology, 387, 221–232. doi:10.1016/j.jhydrol.2010.04.010
- Hughes, D.A., Mantel, S.K., and Slaughter, A. 2011. Quantifying Water Quantity and Quality Impacts Associated with Climate Change: Preliminary Results for the Buffalo River System. Deliverable 2. Unpublished Report. Water Research Commission Project K5/2018/2. Institute for Water Research, Rhodes University. http://www.ru.ac.za/static/institutes/iwr/climate/K52018_2ndDeliverable.pdf.
- IPCC, 2007. Climate change 2007: impacts, adaptation and vulnerability. In: M.L. Parry, et al., eds. Contribution of working group II to the fourth assessment report of the intergovernmental panel on climate change. Cambridge, UK: Cambridge University Press, 976.
- Jaji, M.O., et al., 2007. Water quality assessment of Ogun river, South West Nigeria. Environment Monitoring Assessment, 133, 473–482. doi:10.1007/s10661-006-9602-1
- Kapangaziwiri, E., 2011. Physically-based parameter estimation methods for hydrological models: revised calibration and application procedures for the Pitman monthly rainfall runoff model in southern Africa. Berlin, Germany: Lambert Academic Publishing. ISBN: 978-3-8443-8737-7.
- Kapangaziwiri, E. and Hughes, D.A., 2008. Towards revised physically-based parameter estimation methods for the Pitman monthly rainfall–runoff model. Water SA, 32 (2), 183–191.
- Kapangaziwiri, E., Hughes, D.A., and Wagener, T., 2012. Incorporating uncertainty in hydrological predictions for gauged and ungauged basins in southern Africa. Hydrological Sciences Journal, 57 (5), 1000–1019. doi:10.1080/02626667.2012.690881
- Kepner, W., et al., 2008. Evaluating hydrological response to forecasted land-use change. In: J.C. Campbell, et al., eds. North America Land Cover Summit. Washington DC: Association of American Geographers, 275–292.
- Kumar, M. and Duffy, C.J., 2009. Detecting hydroclimatic change using spatio-temporal analysis of time series in Colorado River Basin. Journal of Hydrology, 374, 1–15. doi:10.1016/j.jhydrol.2009.03.039
- Light, S., Medema, W., and Adamowski, J., 2013. Exploring collaborative adaptive management of water resources. Journal of Sustainable Development, 6 (3), 31–46. doi:10.5539/jsd.v6n3p31
- MacKellar, N., Christensen, J.H., and Lucas-Picher, P. 2010. Climate models, projections and uncertainties in Sub-Saharan Africa: An introduction for researchers and decision makers. A joint UNEP/UNDP program for sub-Saharan Africa funded by the Danish Ministry of Foreign Affairs
- Malherbe, J., Engelbrecht, F.A., and Landman, W.A., 2012. Projected changes in tropical cyclone climatology and landfall in the Southwest Indian Ocean region under enhanced anthropogenic forcing. Climate Dynamics. doi:10.1007/s00382-012-1635-2
- McGregor, J.L., 2005. Geostrophic adjustment for reversibly staggered grids. Monthly Weather Review, 133, 1119–1128. doi:10.1175/MWR2908.1
- Merrey, D.J., et al., 2005. Integrating ‘‘livelihoods’’ into integrated water resources management: taking the integration paradigm to its logical next step for developing countries. Regional Environment Change, 5, 197–204. doi:10.1007/s10113-004-0088-5
- Nash, J.E., Sutcliffe, J.V., 1970. River flow forecasting through conceptual models, Part I – A discussion of principles. Journal of Hydrology, 10, 282–290.
- Ncube, M., and Taigbenu, A.E., 2005. The Impact of land cover and land use on hydrological response in the Olifants Catchment. In: Proceedings of special colloquium: water research showcase, August 2005, Universities of Johannesburg and Witwatersrand. WaterNet, 52–54.
- OCHA, 2010. Water scarcity and humanitarian action: key emerging trends and challenges. Policy Development and Studies Branch, UN Office for the Coordination of Humanitarian Affairs (OCHA). OCHA occasional policy briefing series, Brief no. 4.
- Oki, T., 2005. The hydrologic cycles and global circulation, In: M.G. Anderson and J. McDonnell, eds. Encyclopaedia of hydrological sciences. Chichester, UK: John Wiley and Sons, Vol. 1, 13–22.
- Oki, T. and Kanae, S., 2006. Global hydrological cycles and world water resources. Science, 313, 1068–1072. doi:10.1126/science.1128845
- Padowski, J.C. and Jawitz, J.W., 2009. The future of global water scarcity: policy and management challenges and opportunities [online]. The Whitehead Journal of Diplomacy and International Relations, Summer/Fall, 99–114. http://blogs.shu.edu/diplomacy/files/archives/08%20Jawitz_Layout%201.pdf [Accessed 7 September 2015].
- Pedinotti, V., et al., 2012. Evaluation of the ISBA-TRIP continental hydrologic system over the Niger basin using in situ and satellite derived datasets. Hydrology and Earth System Sciences, 16, 1745–1773. doi:10.5194/hess-16-1745-2012
- Peel, C.M., 2009. Hydrology: catchment vegetation and runoff. Progress in Physical Geography, 33 (6), 837–844. doi:10.1177/0309133309350122
- Pielke, S.R.A., et al., 1998. Interactions between the atmosphere and terrestrial ecosystems: influence on weather and climate. Global Change Biology, 4, 461–475. doi:10.1046/j.1365-2486.1998.t01-1-00176.x
- Pitman, A.J., et al., 2004. Impact of land cover change on the climate of southwest Western Australia. Journal of Geophysical Research, 109, doi:10.1029/2003JD004347.
- Pitman, W.V., 1978. Flow generation by catchment models of differing complexity—a comparison of performance. Journal of Hydrology, 38, 59–70. doi:10.1016/0022-1694(78)90132-4
- Potter, C., et al., 2010. Modeling river discharge rates in California watersheds. Journal of Water and Climate Change, 01, 36–54. doi:10.2166/wcc.2010.012
- Sahel and West Africa Club/OECD, 2009. Climate change in West Africa: Sahelian adaptation strategies. SWAC Briefing Note (3), January 2009.
- Scanlon, B.R., et al., 2005. Impact of land use and land cover change on groundwater recharge and quality in the southwestern US. Global Change Biology, 11, 1577–1593. doi:10.1111/j.1365-2486.2005.01026.x
- Seibert, J. and Beven, K., 2009. Gauging the ungauged basin: how many discharge measurements are needed? Hydrology and Earth System Sciences, 13, 883–892. doi:10.5194/hess-13-883-2009
- Sonneveld, B. G. J. S., (1996). Dominant soils of Nigeria. Amsterdam: Stichting Onderzoek Wereldvoedselvoorziening Van de Vrije Universiteit (SOW-VU).
- Struckmeier, W.F., et al., 2006. WHYMAP and the world map of transboundary aquifer systems at the scale of 1:50,000,000. Hannover, Germany: Federal Institute for Geosciences and Natural Resources and UNESCO.
- Thanapakpawin, P., et al., 2006. Effects of landuse change on the hydrologic regime of the Mae Chaem river basin, NW Thailand. Journal of Hydrology, 334, 215–230. doi:10.1016/j.jhydrol.2006.10.012
- Tran, P., Marincioni, F., and Shaw, R., 2010. Catastrophic flood and forest cover change in the Huong river basin, central Viet Nam: A gap between common perceptions and facts. Journal of Environmental Management, 91 (11), 2186–2200. doi:10.1016/j.jenvman.2010.05.020
- Uhlenbrook, S. and Sieber, A., 2005. On the value of experimental data to reduce the prediction uncertainty of a process-oriented catchment model. Environmental Modelling & Software, 20, 19–32. doi:10.1016/j.envsoft.2003.12.006
- Vimal, M., et al., 2010. A regional scale assessment of land use/land cover and climatic changes on water and energy cycle in the upper Midwest United States. International Journal of Climatology, Published online in Wiley Inter Science, doi:10.1002/joc.2095.
- Vörösmarty, C.J., et al., 2000. Global water resources: vulnerability from climate change and population growth. Science, 289, 284–288. doi:10.1126/science.289.5477.284
- Webb, R.H., et al. 2004. Climatic Fluctuations, Drought, and Flow on the Colorado River, U.S. Geological Survey Fact Sheet, 3062-04. http://pubs.usgs.gov/fs/2004/3062/.