
ABSTRACT
This study describes the assessment of reservoir sedimentation of the Patratu Reservoir using Satellite Remote Sensing (SRS). The sedimentation assessment was carried out using satellite data and reservoir water level data from 2006 to 2012. Water spread area was analysed from satellite data. The Normalized Difference Water Index (NDWI) has been used to delineate open water features and to enhance the presence of water surface in satellite imagery of the Patratu Reservoir. Water spread area of the reservoir at a particular elevation on the date of the passing of the satellite was used to develop an elevation-area curve. For the present case, fluctuation of water level was found to vary from 387.096 to 406.152 m. The linear interpolation/extrapolation technique has been employed to assess the water spread area of Patratu Reservoir at different elevations. Further, these areas were used to compute the live storage capacity of the reservoir between two elevations by the Prismoidal formula. From the study, it was found that due to sedimentation, the live storage capacity of Patratu Reservoir has reduced from 101.95 to 89.96 hm3, thus showing capacity loss of 11.76% in a span of 44 years. To increase the live storage capacity of the reservoir it is proposed to adopt manual and mechanical digging combined with flushing for desilting of the deposited sediment.
EDITOR D. Koutsoyiannis ASSOCIATE EDITOR S. Kanae
Introduction
The sedimentation process is very complex, especially deposition in reservoirs. The sediments carried through the fluvial system are primarily settled in a reservoir due to the lowering in velocity because of a sudden increase in cross-sectional area of a stream. As sediments are accumulated in the lake, its water storage capacity is reduced (Hasan et al. Citation2011). The reduction in storage capacity with sediment deposition in a reservoir over a period of time can be correlated with the reduction in water spread area at different elevations.
Reservoir construction may currently exert the most important influence on land–ocean sediment fluxes (Walling and Fang Citation2003). The transport of sediment is a fundamental feature of the morphology and biochemistry of rivers (Vörösmarty et al. Citation1997, Citation2003). Possible changes in the sediment transportation are important since sediment trapping in the reservoir may have large impacts on the downstream ecosystems (Kummu and Varis Citation2007). Changes in the natural sedimentation action through human activities such as reservoir construction have largely changed sediment flow processes as well as the river morphology and ecosystem in different ways (Kummu et al. Citation2010). Sedimentation processes related with watershed activities, river characteristics and reservoir design are lowering the water storage capacity and threaten reservoir functionality (Bunyasi et al. Citation2013). It is estimated that 0.5–1% of the existing storage volume in the world is lost each year due to sedimentation (Walling Citation2006).
This phenomenon of sedimentation, progressively impairing the utility of the reservoir needs attention not only at the project planning stage but also during the operation stage. Depending upon the shape of the reservoir, mode of reservoir operation, sediment inflow rates and grain size distribution, the incoming sediment will be deposited in different zones of the reservoir. In the Central Asian region, the primary source for irrigation is the surface flow from rivers and man-made reservoirs (Rakhmatullaev et al. Citation2010). Hence, systematic sedimentation assessment during the operation stage is essential to have an up-to-date knowledge of the sedimentation process going on in the reservoir, in order to plan reservoir operation for the optimum utilization of water.
In India, the Central Board of Irrigation and Power (CBIP) started systematic surveys in 1958 and undertook a major reservoir sedimentation surveys scheme and 28 major reservoirs were covered (CBIP Citation1981).With the widespread use of remote sensing technology, it has turned out to be economical and convenient to evaluate the reservoir sedimentation rate.
Out of the methods presently in use for assessment and prediction of sediment deposition in reservoirs such as Satellite Remote Sensing, Hydrographic Survey, Stream flow analysis and Area Reduction method, the Satellite Remote Sensing (SRS) technique provides a relatively cost and time effective method for assessing reservoir sedimentation during the operation stage. In the recent past, the availability of multispectral satellite data using remote sensing is receiving broader application for capacity surveys of reservoirs. Remote sensing and geographical information systems (GIS) have capabilities for reducing the cost, time and workload for reservoir sedimentation studies (Rakhmatullaev et al. Citation2011). Remote sensing in conjunction with GIS provides temporal changes in water spread area and evaluates the sediment deposition pattern of a reservoir through its spatial, spectral and temporal attributes (Goel et al. Citation2002, Kiruthika et al. Citation2011) and this technology allows a fast and accurate estimation of the live storage capacity loss due to reservoir sedimentation (Jain et al. Citation2002).
Soil erosion leads to siltation, which is a major problem for lake and reservoir management (UNEP Citation1994, Keller et al. Citation2000). Depending on the rate of sedimentation, the outlet works may be clogged and the storage of the reservoir would reduce. Reservoir siltation has direct negative economic and environmental consequences, since water availability for irrigation, water supply and flood control is reduced (Jebari et al. Citation2010).Therefore, an appropriate measure to protect the reservoir from sedimentation is essential.
Nalkari River (a tributary of Damodar River upstream) flow in the monsoon season and particularly flood water usually contain high sediment concentration due to rain induced soil erosion from the catchment of Patratu Reservoir. If there are no effective measures undertaken, the useful volume of the Patratu Reservoir will be lost. There is a strong need to limit sediment accumulation in the Patratu Reservoir or make a suitable plan for the removal of the deposited sediment in order to ensure the sustainable use of reservoir.
In the past, several researchers have conducted remote sensing based studies for reservoir sedimentation (Manvalan et al. Citation1991, Gupta Citation1999, Jain et al. Citation2002, Mukherjee et al. Citation2007). Many studies are conducted for modelling the soil erosion employing remote sensing and GIS (Pandey et al. Citation2007, Citation2009). Looking to the aforementioned problems, the present study is carried out with the specific objective of the assessment of reservoir sedimentation using remote sensing technique and a desilting plan for Patratu Reservoir, Jharkhand State, India.
Material and methods
Study area
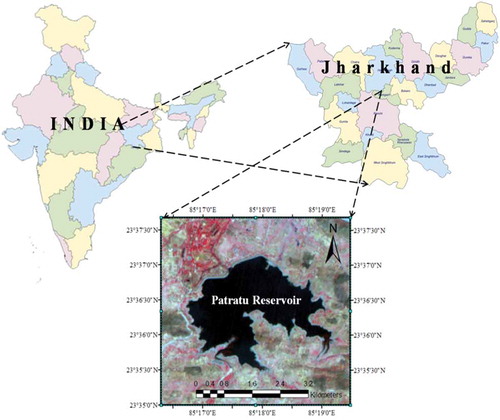
The Patratu Reservoir is located between Latitude 23°36ʹ13ʹʹN to 23°36ʹ18ʹʹN and Longitude 85°16ʹ50ʹʹE to 85°18ʹ54ʹʹE and lies in the catchment of Tenughat dam in the upper Damodar valley (). The catchment area at the Patratu Dam site is 212.38 km2. The reservoir was commissioned in the year 1968 and its average annual inflow is 101.95 hm3. The gross and dead capacities of the reservoir are 110.73 hm3 (full reservoir level (FRL) = 406.152 m) and 8.8 hm3 (minimum draw down level, MDDL = 387.096 m) thus creating live storage of 101.95 hm3. The designed sedimentation rate of the Patratu Reservoir is 11.73 ha-m/year or 0.11733 hm3 /year and trap efficiency is 96%.
Figure 1. Index map of the study area.
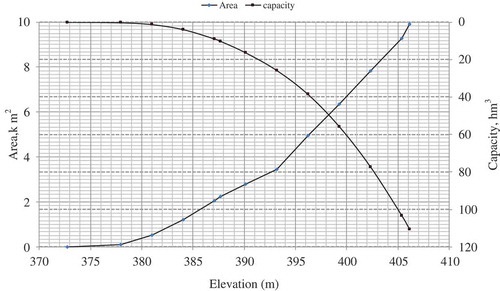
The available elevation–capacity curve (1968) was taken as base in this study and is presented in and . To date, a hydrographic survey has not been carried out for this project. In order to study the sedimentation pattern since the impoundment of the reservoir, the capacity of the reservoir in the year 2012 was estimated using satellite remote sensing data (SRS).
Table 1. Elevation–area–capacity of Patratu Reservoir.
Figure 2. Original elevation–area–capacity curve of Patratu Reservoir.
Data used
For the quantification of the volume of sediment deposited in the reservoir, the satellite data were used to extract basic information, i.e. water spread area at different water surface elevations. The data for reservoir water levels were collected from project authorities. The selection of water year for analysis is from consideration of maximum variation in reservoir levels (ideally FRL to MDDL) and availability of images. It is generally desirable to carry out remote sensing based reservoir sedimentation analysis from the highest to lowest reservoir level chronologically. In this study, due to non-availability of satellite data, lower elevation images have been taken from the year 2006–2007 while high elevation images have been taken from the year 2011–2012. This is one of the limitations of the present analysis.
The multispectral data of IRS-P6 satellites for LISS-III Sensor (Payload: LISS-3; Swath (km) = 141; Spectral bands: 0.52–0.59 (Blue); 0.62–0.68 (Green); 0.77–0.86 (Red); 1.55–1.70 (Near Infra-Red) were available for the analysis period and these data were used in this study. The Patratu Reservoir water spread area was covered in one scene of path 105 row 55 of IRS P6 (LISS-III) satellite.
Analysis of daily reservoir water levels and other field data
The original elevation–area–capacity curves and the reservoir water levels on the date of the passing of the satellite were obtained from the Water Resources Department, Jharkhand. After comparing the availability of imageries for different dates of pass with water level variation for different dates collected from the dam site, it was observed that there were few imageries for one single year which could show the maximum fluctuation (FRL to MDDL) in reservoir water levels. Therefore, the imageries for the period from 2006 to 2012 were collected in order to show variation from near FRL to MDDL. It was found that the satellite dates near to FRL (406.152 m) and close to MDDL (387.096 m) were 29 October 2011 and 22 April 2006, respectively ().
Table 2. Satellite data for different dates of pass for the Patratu Reservoir w.r.t. water levels.
Estimation of water spread area and capacities at different elevations using satellite data
The basic output from the remote sensing analysis is the water-spread area on the date of satellite pass. For delineation of water-spread area, there are two techniques of remote sensing data interpretation, viz. visual and digital are practised. The normalized difference water index (NDWI) is a new method that has been adopted to delineate open water features and enhance their presence in remotely-sensed digital imagery. The NDWI makes use of reflected near-infrared radiation and visible green light to enhance the presence of such features while eliminating the presence of soil and terrestrial vegetation features. The NDWI was derived using principles similar to the normalised difference vegetation index (NDVI). In NDVI (the comparison of differences of two bands, red and near-infra-red (NIR)), the presence of terrestrial vegetation and soil features is enhanced while the presence of open water features is suppressed because of the different ways in which these features reflect these wavelengths (McFeeters Citation1996).
The NDVI index is calculated as follows:
If the equation is reversed and the green band is used in place of the red, then the result would also be inverted, the vegetation suppressed and the open water features enhanced (McFeeters Citation1996). The equation for NDWI is:
The selection of these wavelengths maximises the reflectance properties of water as follows:
Maximise the typical reflectance of water features by using green wavelengths;
Minimise the low reflectance of NIR by water features; and
Maximise the high reflectance of NIR by terrestrial vegetation and soil features.
The NDWI value ranges from −1 to 1 and zero is the threshold (McFeeters Citation1996). As suggested by McFeeters (Citation1996) if, NDWI > 0, cover type is water and if, NDWI ≤ 0 cover type is non-water. According to McFeeters (Citation1996), “If the digital number (DN) value is near-IR spectral region, the DN value of water pixels is appreciably less than the DN value of Band 2 and Band 3, then it must be classified as water, otherwise not”.
In the near-IR spectral region, the absorption of electromagnetic radiation by water is maximum and the DN of water pixels are significantly lower than the other land uses. Even if the water depth is very shallow, the increased absorption in Band 4 will restrict the DN value to be less than Band 3 and Band 2. If the soil is exposed and saturated at the surface, the reflectance will be as per the soil signatures, which increases with wavelength. Therefore, water pixels were clearly separated from the neighbouring pixels (Jain et al. Citation2002).
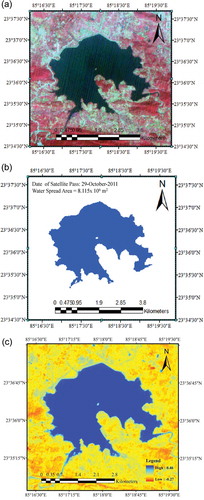
The original water spread areas at different levels were obtained from the original elevation–area curve received from the project authorities. The submergence area corresponding to FRL was 9.91 km2 in the Patratu Reservoir and water spread area at river bed level was assumed as zero. To know the capacities at different elevations, the Prismoidal formula was applied to solve simultaneous equations. In the masks, isolated water pixels within and near the periphery of the reservoir which show no hydraulic connectivity were removed. Similarly, water pixels downstream of the reservoir were not a part of the reservoir, hence were removed. The areas of islands present in the reservoir were deducted from the total water spread area from all the imageries. After applying corrections for clouds, vegetation, islands, tail and discontinuous pixels, the actual water spread areas were obtained through remote sensing technique and it was compared with the original areas. The water spread areas extracted from false colour composite (FCC) images of Patratu Reservoir near FRL and MDDL are presented in and . NDWI maps of the Patratu Reservoir near MDDL and near FRL are also presented at and .
Figure 3. (a) False colour composite of Patratu Reservoir (22 April 2006) near MDDL, (b) extracted water spread areas of Patratu Reservoir near MDDL (22 April 2006), and (c) NDWI map of Patratu Reservoir near MDDL (22 April 2006).
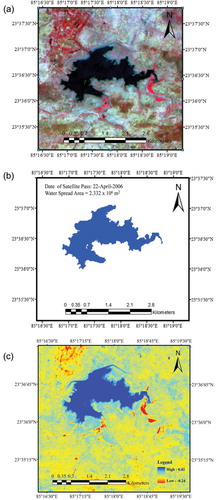
Figure 4. (a) False colour composite of Patratu Reservoir (29 October 2011) near FRL, (b) extracted water spread areas of Patratu Reservoir (29 October 2011) near FRL, and (c) NDWI map of Patratu Reservoir (29 October 2011) near FRL.
After applying the above corrections, the actual water spread area was obtained as detailed in . Estimated water spread areas for different dates (dates of satellite pass) obtained by digital analysis of satellite data corresponding to different elevations were plotted to generate an elevation–area curve. The remote-sensing technique is limited to providing water spread area mostly in a live storage zone. In the present study, variations of minimum and maximum water level were 387.096 to 406.152 m, respectively. Water spread areas below MDDL and at FRL are not available. The linear interpolation/extrapolation technique was used to assess these areas. The overall reduction in capacity between the lowest and the highest observed water levels was obtained by adding the reduced capacities at all levels.
The reservoir capacity between two elevations was computed by the Prismoidal formula using the water spread areas obtained above:
where, is the volume between elevations E2 and E1 (E2 > E1);
are the water spread areas at elevations E1 and E2 respectively; and
= E2 − E1.
Estimation of sediment deposition
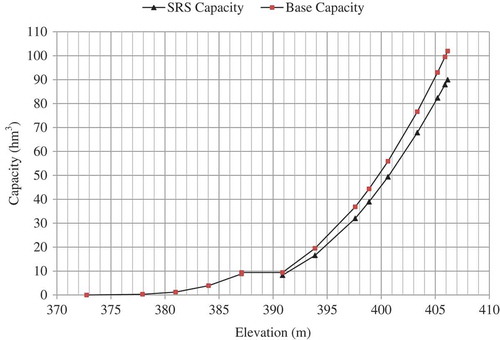
The water spread area of the Pataratu Reservoir was calculated using satellite data. The gross storage capacity of the Patratu Reservoir was found to be 110.7 hm3 at FRL 406.152 m. In order to calculate loss in storage and to know the sedimentation rate, a capacity survey by remote sensing technique was carried out for the years 2006–2012 in the zone of fluctuation between 387.096 and 406.152 m. The difference between the cumulative capacities of the original (base year = 1968) and latest (2012) surveys gave loss in storage in the live storage zone as shown in . The comparative capacity elevation curves for the above periods are shown in .
Table 3. Patratu Reservoir capacity loss estimation due to sedimentation.
Figure 5. Comparison of elevation–capacity curves of Patratu Reservoir.
Discussion
Using the Prismoidal formula, the revised capacity between the maximum (406.152 m) and minimum (387.096 m) observed levels were obtained. The loss in live storage capacity since the base period (year 1968) to the recent remote sensing survey in 2012 was 11.99 hm3, which was 11.76% of the original live storage capacity. Based on the SRS survey the annual sedimentation rate is 0.4720 hm3/year and seems to be quite high against the designed sedimentation rate of 11.73 ha-m/year or 0.11733 hm3. The gross, dead and live storage capacity of the Patratu Reservoir for the base year (1968) was found to be 110.73, 8.78 and 101.95 hm3, respectively. The original live storage capacity of the Patratu Reservoir (101.95 hm3) reduced to 89.96 hm3, i.e. by 11.76% to date. In the study, SRS survey could be done for the available imageries of live storage zone only. Therefore, it is recommended to carry out hydrographic survey for dead storage zone and SRS survey for live storage zone to provide more accurate sedimentation deposition volume and rate with an integrated system.
The results show that the estimation of sedimentation by remote sensing is highly sensitive in determining the water spread area, water level information and original elevation–area–capacity table (). The major constraint of remote sensing technique is that the sedimentation below the lowest observed level and above the highest observed level cannot be ascertained. However, this limitation is not important since the zone of interest of sedimentation analysis from the operation point of view is the live storage zone. Further, if sedimentation assessment is required for the whole reservoir, then the hydrographic survey for the water spread area at the lowest observed elevation can be accomplished.
Measures against reservoir sedimentation
There is a strong need to limit sediment accumulation in reservoirs in order to ensure their sustainable use. Several measures against reservoir sedimentation have been proposed in the past but not all of them are sustainable, efficient and affordable. Sediment management is not limited to the reservoir itself; it begins in the catchment areas and extends to the downstream river (Asthana et al. Citation2007).
As suggested by Asthana et al. (Citation2007), generally two methods, hydraulic and mechanical, are used for removing deposited sediment from reservoirs. Hydraulic methods comprise flushing and siphoning and mechanical methods comprise excavation and dredging. Sometimes combinations of the two types are used to improve efficiency.
Recommendation for desilting of Patratu Reservoir
Satellite-based reservoir sedimentation study of the Patratu Reservoir revealed that the amount of silting which has occurred in the live storage zone is about 12 hm3. It is proposed to de-silt the reservoir by adopting the following measures:
Mechanical/manual excavation, transportation and dumping of the excavated material to low lying areas downstream of the dam and the distance of transportation shall be about 1 km. It is assumed that 50% of the 12 hm3 silt deposit shall be excavated and transported to the downstream by dumpers. Manual excavation work will provide employment to the local workforce.
Mechanical/manual excavation, dredging of the material to deeper portion near sluices (within the reservoir) for hydraulic flushing during flood period. It is assumed that 50% of the 12 hm3 silt deposit shall be excavated and hydraulically flushed through the sluices.
Manual and mechanical digging combined with flushing is recommended for the desilting of the Patratu Reservoir. Earlier digging and flushing operations in Kundah Palam Reservoir in Tamil Nadu (India) were employed to remove the deposited sediment (Stephen Citation1999). During non-monsoon season, the deposits are mechanically excavated and dozed in the deep pool near the scour sluices in the dam. Excavation can be planned to start after the monsoon season. Water level in the reservoir is at its highest level (near to or equal to FRL) at the end of the monsoon season. Then it gradually decreases exposing areas along the periphery. As the water is withdrawn from the reservoir for the thermal power plant and other purposes, more and more reservoir area is exposed to drying up. Thus instead of waiting until the start of the summer season, excavation work can start much earlier.
Dredging is an ancient art and has been practised to maintain waterways and reclaim land. In the year 2012, Water Resource Department, Jharkhand had a proposal to the Drinking Water and Sanitation Department to carry out desilting of Getalsud Dam. Excavation work can be done manually or mechanically. The Patratu Reservoir is located in an under-developed region of Jharkhand state. Central and state governments are implementing several social welfare programmes in under-developed regions all over the country; such as food for work programme, drought area protection programme, rural area development works, etc. Therefore it is suggested that the local work force be involved in manual excavation work and paid for in cash or kind. Coal and/or electricity can be provided to the labourers at a subsidized rate for the manual labour done. The excavated material can be mechanically transported to a safe disposal place downstream. During the flood season, loose material can be flushed downstream through sluices. There is plenty of monsoon runoff in Patratu River as compared to the capacity of the reservoir. Sluices can be effectively utilized to flush the excavated material along with the flood runoff. The Drinking Water and Sanitation Department, Jharkhand was of the view that desiltation is the only way to save the water bodies from becoming completely dry even before the onset of summer.
Conclusion
From the satellite remote sensing survey of Patratu Reservoir, it was found that the live storage capacity of the reservoir was reduced to 89.96 hm3 from 101.95 hm3 showing an 11.76% loss in its original capacity. On the basis of analysis of a SRS survey, the sedimentation rate in the Patratu Reservoir seems to be on the higher side. Moreover in order to get true picture of sediment deposition in the reservoir, an integrated survey by carrying out a hydrographic survey below MDDL and multispectral analysis from MDDL to FRL would be more appropriate. Manual and mechanical digging combined with flushing is recommended for desilting of the Patratu Reservoir.
Acknowledgements
The authors would also like to thank the anonymous referees and Dr Shinjiro Kanae, Associate Editor, for contributing insightful remarks and useful suggestions which led to a substantially improved manuscript.
Disclosure statement
No potential conflict of interest was reported by the author(s).
Additional information
Funding
References
- Asthana, B.N., 2007. Sediment management in Water Resources Projects. In: G.N. Mathur and A.C. Gupta, eds. Sediment management in Water Resources Projects. New Delhi: Central Board of Irrigation and Power.
- Bunyasi, M.M., Onywere, S.M., and Kigomo, M.K., 2013. Sustainable catchment management: assessment of sedimentation of Masinga Reservoir and its implication on the dam’s hydropower generation capacity. International Journal of Humanities and Social Science, 3 (9), 166–179.
- CBIP (Central Board of Irrigation and Power), 1981, Sedimentation studies in reservoirs. Tech. Report no. 20, (vol. 2). New Delhi: CBIP (Central Board of Irrigation and Power).
- Goel, M.K., Jain, S.K., and Agarwal, P.K., 2002. Assessment of sediment deposition rate in Bargi Reservoir using digital image processing. Hydrological Sciences Journal, 47 (supp 1), S81–S92. doi:10.1080/02626660209493024
- Gupta, S.C., 1999, Status paper on reservoir sedimentation assessment using remote sensing techniques. In: Proceeding national workshop on reservoir sedimentation assessment using remote sensing data. National Institute of Hydrology, Roorkee, India.
- Hasan, Z.A., Yusoff, M.S.B., and Talib, S.H.B.A. 2011. Bukit Merah reservoir sedimentation assessment. In: Proceedings of international conference on environment science and engineering (ICESE 2011), 1–3 April, Bali Island. Nibong Tebal, Penang: Universiti Sains Malaysia, River Engineering and Urban Drainage Research Centre, 86–90.
- Jain, S.K., Singh, P., and Seth, S.M., 2002. Assessment of sedimentation in Bhakra Reservoir in the western Himalayan region using remotely sensed data. Hydrological Sciences Journal, 47 (2), 203–212. doi:10.1080/02626660209492924
- Jebari, S., et al., 2010. Spatial soil loss risk and reservoir siltation in semi-arid Tunisia. Hydrological Sciences Journal, 55 (1), 121–137. doi:10.1080/02626660903529049
- Keller, A., Sakthivadivel, R., and Seckler, D., 2000. Water scarcity and the role of storage in development. Colombo: International Water Management Institute, IWMI Research Report 39.
- Kiruthika, A.M., et al., 2011. Silt sediment analysis for Devarabelekere Reservoir using remote sensing and GIS. International Journal of Earth Sciences and Engineering, 04 (01), 24–30.
- Kummu, M., et al., 2010. Basin-wide sediment trapping efficiency of emerging reservoirs along the Mekong. Geomorphology, 119, 181–197. doi:10.1016/j.geomorph.2010.03.018
- Kummu, M. and Varis, O., 2007. Sediment–related impacts due to upstream reservoir trapping, the Lower Mekong River. Geomorphology, 85, 275–293. doi:10.1016/j.geomorph.2006.03.024
- Manvalan, P., Rajegowda, G.E., and Srinivas, M.V., 1991, Capacity evaluation of Ghatprabha Reservoir using digital analysis of 1RS L1SS-II data. Bangalore, India: Regional Remote Sensing Service Centre, Project report no. B/003/91.
- McFeeters, S.K., 1996. The use of the Normalized Difference Water Index (NDWI) in the delineation of open water features. International Journal of Remote Sensing, 17 (7), 1425–1432. doi:10.1080/01431169608948714
- Mukherjee, S., et al., 2007. Sedimention study of Hirakud Reservoir through remote sensing techniques. Journal of Spatial Hydrology, 7 (1), 122–130.
- Pandey, A., Chowdary, V.M., and Mal, B.C., 2007. Identification of critical erosion prone areas in the small agricultural watershed using USLE, GIS and Remote Sensing. Water Resource Management, (Springer). 21 (4), 729–746. doi:10.1007/s11269-006-9061-z
- Pandey, A., et al., 2009. Soil erosion modeling of a Himalayan watershed using RS and GIS. Environmental Earth Sciences, 59 (2), 399–410. doi:10.1007/s12665-009-0038-0
- Rakhmatullaev, S., et al., 2011, Sedimentation of reservoirs in Uzbekistan: a case study of the Akdarya Reservoir, Zerafshan River Basin. In: Proceedings of the ICCE Workshop, Hyderabad, IAHS Publ. 349, pp. 1–11.
- Rakhmatullaev, S., et al., 2010. Groundwater resources use and management in the Amu Darya River Basin (Central Asia). Environmental Earth Sciences, 59, 1183–1193. doi:10.1007/s12665-009-0107-4
- Stephen, A., 1999, The control of silting in power reservoirs-A pragmatic approach. In: Proceedings 1st international conference on silting problems in hydropower plants. New Delhi: CBI&P.
- UNEP, 1994. The pollution of lakes and reservoirs (UNEP Environment Library). Kenya: UNEP/Nairobi.
- Vörösmarty, C.J., et al., 1997. The storage and aging of continental runoff in large reservoir systems of the world. Ambio, 26, 210–219.
- Vörösmarty, C.J., et al., 2003. Anthropogenic sediment retention: major global impact from registered river impoundments. Global and Planetary Change, 39, 169–190.
- Walling, D.E., 2006. Human impact on land–ocean sediment transfer by the world’s rivers. Geomorphology, 79, 192–216. doi:10.1016/j.geomorph.2006.06.019
- Walling, D.E. and Fang, D., 2003. Recent trends in the suspended sediment loads of the world’s rivers. Global and Planetary Change, 39, 111–126. doi:10.1016/S0921-8181(03)00020-1