
ABSTRACT
This study assessed the utility of EUDEM, a recently released digital elevation model, to support flood inundation modelling. To this end, a comparison with other topographic data sources was performed (i.e. LIDAR, light detection and ranging; SRTM, Shuttle Radar Topographic Mission) on a 98-km reach of the River Po, between Cremona and Borgoforte (Italy). This comparison was implemented using different model structures while explicitly accounting for uncertainty in model parameters and upstream boundary conditions. This approach facilitated a comprehensive assessment of the uncertainty associated with hydraulic modelling of floods. For this test site, our results showed that the flood inundation models built on coarse resolutions data (EUDEM and SRTM) and simple one-dimensional model structure performed well during model evaluation.
Editor Z.W. Kundzewicz; Associate editor S. Weijs
Introduction
There has been a remarkable development of remote sensing technology over the past decades. As a result, low-cost digital elevation model (DEM) products have become more and more available. The exploitation of these new data to support flood inundation modelling is still an ongoing research challenge (Bates Citation2012, Di Baldassarre and Uhlenbrook Citation2012). A better understanding of the utility of these emerging data and the associated uncertainty (Montanari Citation2007) in supporting flood inundation models, would improve flood hazard mapping, especially where high-resolution (and high-accuracy) DEMs are unavailable (Bates Citation2005, Bates et al. Citation2014). Concurrently, two-dimensional (2D) flood inundation models with numerical schemes that solve either complete or approximations of the St Venant equations have been developed. Several of these models explicitly take into account either the rectangular or square grid nature of these remote-sensed datasets (Dottori and Todini Citation2011, de Almeida and Bates Citation2013). Consequently, 2D model simulations of large spatial flood inundation studies have been achieved within acceptable computational time limits and margins of error (e.g., Bates and De Roo Citation2000, Bates Citation2005, McMillan and Brasington Citation2007, Hunter et al. Citation2008, Neal et al. Citation2012, de Almeida and Bates Citation2013).
Topographic data is one of the essential inputs for hydraulic modelling (Farr et al. Citation2007). light detection and ranging (LIDAR) data have a vertical accuracy of 10–15 cm and approximate resolution of 1–5 m. It is a relatively accurate and precise representation of the floodplain geometry (Bates Citation2012). However, high data acquisition cost is a major drawback in the proliferation of these datasets for use in flood inundation modelling, especially for large-scale studies. Thus, in many cases, LIDAR data are confined to small study areas. Given that LIDAR and ground surveyed topography data are still limited in many areas, globally free (or low-cost) topographic data offer increasing opportunities for hydraulic modelling of floods. For example, the Shuttle Radar Topography Mission (SRTM) provides the most complete topographic data at a near-global scale. The SRTM elevation product covers areas between 60°N and 56°S, about 80% of Earth’s land surface (Farr et al. Citation2007). SRTM data are available at a resolution of 3 arc sec (approximately 90 m) globally and 1 arc sec (approximately 30 m) in the US territory. However, due to SRTM’s radar-based interferometric synthetic aperture radar (SAR) technology, the dataset is affected by random noise and radar speckles. As a result, the accuracy of SRTM topographic data is between 5.6 and 9.0 m at 90% confidence level, in terms of absolute height error (Rodríguez et al. Citation2006). Previous studies have shown that the absolute height error of SRTM is strongly influenced by relief where large vertical errors are frequent in high-relief terrain, while in the low- to medium-relief areas, the vertical errors are smaller (e.g., Falorni et al. Citation2005, Sanders Citation2007, Patro et al. Citation2009, Wang et al. Citation2012). Thus, this dataset is suitable for hydraulic modelling in low-relief areas, such as floodplains, rivers (lower and mid-reaches) and deltas. In this context, a number of scientists have explored the potential of SRTM in supporting large-scale modelling of rivers and floodplains (e.g., LeFavour and Alsdorf Citation2005, Sanders Citation2007, Neal et al. Citation2012, Yan et al. Citation2013, Mersel et al. Citation2013). Yan et al. (Citation2013) found that results obtained, using SRTM data as topographic input to a 1D hydraulic model, were close (between 1 m and 1.5 m in terms of high-water levels) to results from models based on high-resolution, higher-accuracy topography data. These discrepancies are not negligible but nonetheless are within the accuracy typically associated with large-scale flood inundation modelling.
ASTER (Advanced Space-borne Thermal Emission and Reflection Radiometer) GDEM (global digital elevation model) is a 30-m spatial resolution DEM developed using stereo-photogrammetry. The first version of the dataset was released in 2009 and later an updated second version was released with improved coverage and accuracy. However it has been reported that the dataset contains imperfections that limit its use. Its vertical accuracy of 17 m at 95% confidence level (Tachikawa et al. Citation2011a, Citation2011b) indicates that it is difficult to use for flood inundation modelling. Few authors have tested the ASTER GDEM for hydraulic modelling studies (e.g., Wang et al. Citation2012, Gichamo et al. Citation2012). With respect to the errors in the ASTER data, Gichamo et al. (Citation2012) proposed the use of an error-correction method to exploit the data.
Very recently, the EUDEM (EEA Citation2014) dataset was released. EUDEM is a weighted combination of ASTER GDEM and SRTM, at a resolution of 1 degree (~30 m), covering several European countries. Its potential for flood inundation modelling is still unexplored. In this context, we tested the usefulness of the recently released EUDEM in supporting flood inundation models. Two more topographic data (LIDAR and SRTM) and diverse model structures were used to carry out a comprehensive study and account for observation, parameter and structural uncertainty associated to hydraulic modelling of floods.
Hydrodynamic modelling and uncertainty
Case study
This study was performed on a 98-km reach of the River Po, Italy () that is characterised by river widths of approximately 200–300 m and is embanked on either side (Castellarin et al. Citation2011).
Figure 1. Case study location: the reach of River Po from Cremona to Borgoforte.
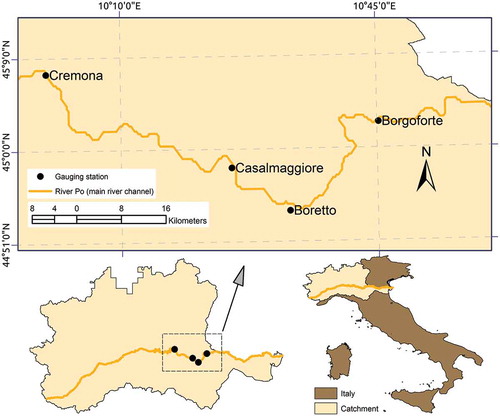
River Po flood conditions are dominated by rainfall, thus resulting in two flood periods around the months of June and November (Marchi et al. Citation1996). Long-duration rainfall in October 2000 in the basin resulted in an extreme flood event with a return period estimated at around 60 years (Maione et al. Citation2003). Additionally, a relatively similar high-magnitude event on the same river reach previously occurred in November 1994 (Marchi et al. Citation1995).
For these two events, observed water-level information for the upstream gauging station (Cremona) and two internal gauging stations (Boretto and Casalmaggiorre) were used for model set-up and evaluation (). This data was available at an hourly resolution (AIPO Citation2014).
Figure 2. Measured water levels for (a) 1994 and (b) 2000 flood events.
Model set-up
Six model configurations were set-up using two model structures, i.e. 1D US Corps of Engineers River Analysis System (HEC-RAS) and 2D LISFLOOD-FP (Bates et al. Citation2010, de Almeida and Bates Citation2013) and three topographies (the recently released EUDEM in addition to SRTM and LIDAR).
Several studies have demonstrated that the observed river discharge (derived from the use of rating curves) is affected by significant uncertainty, especially during flood conditions, whereas water levels observations tend to be much more precise and accurate (e.g., Pappenberger et al. Citation2006, Di Baldassarre and Montanari Citation2009). For instance, using erroneous measurements of discharge and water levels (from the velocity–area method) to parameterise the rating curve, results in interpolation and extrapolation errors. Commonly an assumption of channel stationarity is made, which differs from reality (Di Baldassarre and Montanari Citation2009). Extrapolation errors are particularly important (and in our opinion largely epistemic) since it is impractical to carry out velocity–area measurements during flood conditions. These errors grossly exaggerate the discharge values (see Pelletier Citation1988, Boiten Citation2008, Di Baldassarre and Montanari Citation2009, McMillan et al. Citation2010, Domeneghetti et al. Citation2012).
In this study, discharge inaccuracy arising from the parameterisation of the rating curve was considered. An ensemble of flow hydrographs was generated using observed water levels and rating curve parameter distributions. In particular, the rating curve was described by a power law function (Herschy Citation1999) and its parameters, alpha and beta, were sampled from uniform distribution. An ensemble of hydrographs reflecting observation uncertainty (see equation 1) were generated:
where Q is the discharge, h is the water-level, alpha and beta are parameters. Ho is a parameter that is derived from the channel bathymetry (Boiten Citation2008). Due to lack of knowledge about the actual parameter distributions, uniform distributions were chosen and the parameter ranges were based on a feasibility analysis of rating curve records produced by the river basin authority (ARPA Citation1994, Citation2000). A priori uniform distributions for alpha ~U(2.0, 15.0) and beta ~U(1.5, 5.0) were selected.
For parameter uncertainty, wide ranges of effective roughness coefficients were used. The main channel roughness varied from 0.01 to 0.05 and the floodplain roughness varied from 0.05 to 0.11
(Chow Citation1959).
As previously mentioned, two model structures were considered in this study. The HEC-RAS model code was used for 1D simulation. This model solves the full dynamic St Venant 1D momentum equation, i.e. taking into account the local acceleration, the convective term, the pressure term and the friction term. The solution of the shallow water equations in the 1D model are achieved using the Preissman Numerical Scheme (Preissmann Citation1961). Thus the equations are:
where: u is the velocity, t is time, h is the depth, x is the distance, g is gravitational acceleration, so is the slope, sf is the friction slope, A is the cross-sectional area and Tw is the top width of flow (Brunner Citation2010).
HEC-RAS is a commonly used 1D flood inundation model (e.g., Horritt and Bates Citation2002, Castellarin et al. Citation2011, Domeneghetti et al. Citation2014). Seventy-six cross-sections at an approximate spacing of 1.2 km were extracted from the DEM topographies with two values of the roughness coefficient for the main channel and the floodplain. A normal depth derived from Manning’s equation using the main channel slope was applied as the downstream boundary condition and model simulations were run at a computational time step of 1 min.
The LISFLOOD-FP model code (Bates et al. Citation2010, de Almeida and Bates Citation2013) was used for 2D simulations. This code solves the local inertial formulation approximation of the 1D St Venant equation. This formulation neglects the convective acceleration term of the full dynamic momentum conservation equation. The partial differential equations are solved using a finite difference numerical scheme. Subsequent calculation of the inertial approximation in the x and y directions and water levels in the cells are updated by taking into account the conservation of mass (Bates et al. Citation2010, de Almeida et al. Citation2012, de Almeida and Bates Citation2013). Thus the equations are:
where x and y are represent 2D Cartesian directions, t is the time, h is the water depth, qx and qy are the x and y components of the unit discharge.
The 2D model code uses an adaptive time step that is dependent on the maximum water depth. This was implemented to achieve maximum allowable computation time steps during model runs. Two effective roughness values for the main channel and floodplain were used. LISFLOOD-FP has been used in several studies with positive results (e.g., Horritt and Bates Citation2002, Hunter et al. Citation2008, Trigg et al. Citation2009, Neal et al. Citation2009, Citation2012, de Almeida and Bates Citation2013). Riverine floods are low-amplitude waves taking days to travel downstream with resulting low Froude numbers, thus the inertial approximation of the St Venant equation is adequate. Initial model conditions were simulated using water depths derived from steady flow simulation of the initial hydrograph discharge values.
With respect to the topographic input, both EUDEM and LIDAR datasets were aggregated by averaging elevation data to the same resolution of SRTM (approximately 80 m). Thus, a consistent comparison of model performance was achieved. Re-sampling to a lower resolution also reduces random noise in DEMs (Rodríguez et al. Citation2006).
Model conditioning and evaluation
Model uncertainty output due to four parameters, i.e. the two roughness coefficients and the two rating curve parameters, was analysed using the Generalised Likelihood Uncertainty Estimation (GLUE) approach (Beven and Binley Citation1992, Beven Citation2006).
During model conditioning, model performance was evaluated by comparing simulated water levels to observed water levels (October 2000 flood event) in terms of Root Mean Square Error (RMSE).
where h, , N, t and θ represent the observed and simulated water level at time t, number of elements of the simulated water levels, time and the parameter set, respectively.
Higher weights were assigned to models that simulated water levels with lower errors, i.e. RMSE. In particular, the weights were calculated as:
Given the objective function of a simulation (RMSE), wi is the corresponding weight, and
.
Models that achieved RMSE values greater than 1 m were rejected as non-behavioural. This threshold corresponds to the standard freeboard used in this test site for the design of the flood protection structures (Brandimarte and Di Baldassarre Citation2012). The behavioural models (conditioned on the October 2000 flood event) were then used to simulate observed water levels during the November 1994 flood event.
Results
The models built on the three topographic datasets were independently calibrated and validated. Specifically, three independent sets of calibrated parameter sets were used to evaluate the model. Results of this evaluation showed the potential of these datasets for use in flood inundation modelling.
(1D model conditioning) shows that all the models simulated the dominant flow dynamics in the reach, especially during the peak whereby all the models simulated the peak water level within the 90% confidence interval. This was attributed to predominantly 1D flow in the heavily embanked river (Marchi et al. Citation1996), particularly during high flow as observed during the October 2000 flood event (Mukolwe et al. Citation2014). However, discrepancies can be seen in the rising limbs (of the hydrographs) where the observed values do not fall within the 90% confidence interval of the simulation ensemble.
Figure 3. 1D model conditioning: water levels simulation at Casalmaggiore station (upper panels) and Boretto station (lower panels) for October 2000 flood event. CI refers to the confidence interval.
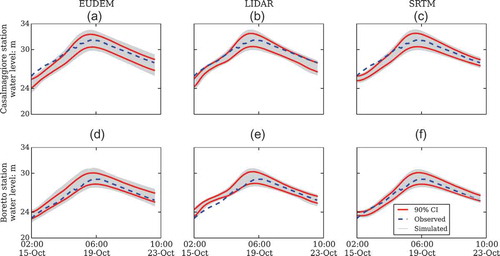
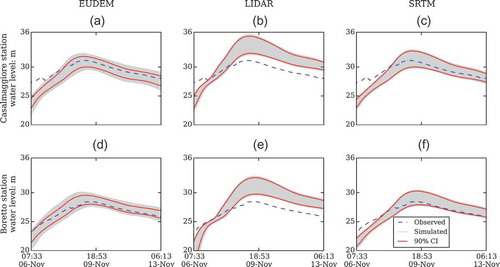
For the 2D model conditioning, both the SRTM- and the EUDEM-based models (at the two gauging stations, ) approximately replicated the flow dynamics as compared to the recorded data. Though ) and () show an underestimation of the rising limb of the recorded water level hydrograph for EUDEM at Boretto and SRTM at Casalmaggiore. This is an indication of decreased wave celerity for the models built on these two datasets.
Figure 4. 2D model conditioning: water levels at Casalmaggiore station (upper panels) Boretto station (lower panels) for October 2000 flood event.
Poor performance of the 2D LIDAR-based model at Boretto () showing flood wave attenuation was contrary to expectation. The results show that the models underestimate the peak water levels at the lower gauging station. This differs from previous studies (e.g., McMillan et al. Citation2010) that have shown inclusion of rating curve uncertainty increases the flexibility of the model and improves performance.
The results of 1D model evaluation () show that models based on EUDEM and SRTM simulated the peak water levels within 90% confidence interval of the simulation ensemble. It should be noted that for the LIDAR-based models there is a consistent overestimation of the observed water levels. This was attributed to (effective) parameter non-stationarity (Romanowicz and Beven Citation2003), whereby hydrographs generated in the model evaluation phase exhibit different characteristics when compared to the model conditioning phase. This is also due to the non-uniformity and complexity of causal flood generation processes across events, affecting the peak and shape of the hydrograph (Bracken Citation2013). Water level simulation results for LIDAR-based models are significantly different to results obtained for SRTM- and EUDEM-based models (). Comparatively, the significant difference between these datasets is the quality and accuracy of the original data. LIDAR data is much more accurate and thus contains more flood-controlling features, such as minor dikes. This river reach is characterised by complex flow interactions due to a complex system of minor embankments and flood wave controlling artefacts (Prestininzi et al. Citation2011). Thus, the results of the LIDAR-based models are more sensitive to parameter changes () and ()). These results suggest that the LIDAR-based model parameters were over-fitted during model conditioning. For this reason, a more appropriate model structure that accounts for the complex topographic nature of the dataset should yield better results. Castellarin et al. (Citation2011), for instance, showed that ad hoc modelling (quasi-2D) based on accurate topography can enable a better schematization of the complex inundation processes resulting from the large amount of dike-protected areas in the Po River floodplains.
Figure 5. 1D model evaluation: water levels simulation at Casalmaggiore station (upper panels) and Boretto station (lower panels) for November 1994 flood event.
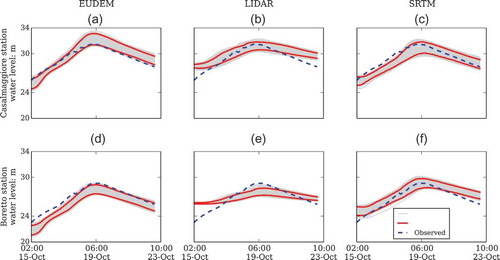
Results of the 2D model evaluation () show a consistent overestimation of the falling limb (of the water level hydrograph). In addition to the foregoing discussion of results, this set of 2D models was expected to perform better in terms of simulating flood wave propagation dynamics. This implies that this is either due to slower simulation of floodplain dewatering or an increased discharge (due to differences in the actual peaks flows of the flood events) being routed through the model. Having chosen wide parameter ranges for the rating curve (power law), these parameter sets result in large discharge values that would be located in the extrapolation zone of the rating curve (see Di Baldassarre and Claps Citation2010, Domeneghetti et al. Citation2012). The routing of these discharge values result in high simulated water levels and consequently overestimation of the floodplain dewatering by the 2D models.
Figure 6. 2D model evaluation: water levels simulation at Casalmaggiore station (upper panels) and Boretto station (lower panels) for November 1994 flood event.
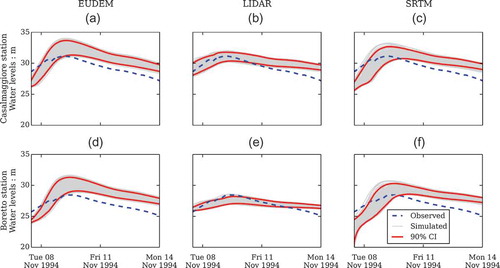
With respect to 1D- and 2D-modelling approaches, dominant 1D flow is expected, especially for peak flows. However, flood wave propagation especially during the rising and falling limbs of the input hydrographs are expected to result in energy losses as complex flows are expected at the lower discharges of floodplain flow. The 1D SRTM and EUDEM based were more robust (than the LIDAR-based models) in simulating the peak water levels during the model evaluation phase. It is expected that the use of 2D models based on LIDAR data would better simulate the changing flow dynamics, and complex floodplain (and storage areas) to main channel water interchange during the rising limb, peak flow and the falling limb of the input hydrograph. However, these sets of models did not perform well.
Conclusions
Multiple sources of uncertainty (model structure, flow hydrographs, and roughness coefficients) were accounted for to test the utility of new topographic data (EUDEM) in supporting hydraulic models. These models were compared to water level simulation results derived from models built on SRTM data and higher-quality LIDAR data, while accounting for uncertainty in the rating curve and roughness parameters. The model evaluation was based on two internal gauging stations.
This study shows that, for these specific test sites and flood events, generally HEC-RAS performs better than LISFLOOD-FP. This result, however, can be attributed to the use of flood water levels as evaluation data. For instance, Horritt and Bates (Citation2002) found that LISFLOOD-FP performs much better when flood extent maps (rather than water levels) are used to calibrate and validate the models.
Significant differences between the performance of EUDEM and SRTM were not noted. However, on wider floodplains, the added value of the weighted EUDEM dataset with respect to SRTM may be more apparent. It is expected that the weighted DEM should preserve embankments to a better degree than the SRTM DEM, having been fused with a higher-resolution dataset. On the other hand, considering reported errors in ASTER GDEM datasets and the low usage in flood inundation studies, fusing two datasets may have increased noise in the EUDEM dataset.
In this specific study, our results suggest the feasibility of a parsimonious approach based on a simple model structure (1D) and a coarse resolution dataset. The use of a higher-quality dataset (LIDAR) to build more complex models did not yield satisfactory results, being more susceptible (and sensitive) to differences in the conditioning and evaluation stages of the modelling process. However, it is expected that use of a high-resolution dataset and a correspondingly appropriate model structure would yield acceptable results.
Regarding the form of the rating curve, spuriously high discharge values are obtained in the extrapolation zone of the rating curve (Di Baldassarre and Claps Citation2010, Domeneghetti et al. Citation2012). The method applied in this study used a single segment power law function and a wide range of parameter values. Further studies are necessary to constrain the parameters of a multi-segment rating curve using a ‘limits of acceptability approach’ (e.g., Liu et al. Citation2009, Beven Citation2009). This would limit generated unrealistically high discharge values according to acceptability criteria and constrain the simulated model outputs to acceptable levels of accuracy.
Acknowledgements
The authors are grateful to Dr Gerald Corzo for high-performance computing technical assistance and the SURFsara high-performance computing centre (www.surfsara.nl) for facilitating a cloud environment to run model simulations. The authors are thankful to Dr Steven Weijs, Dr Alessio Domeneghetti and the anonymous reviewer whose input improved the quality of this paper.
Disclosure statement
No potential conflict of interest was reported by the author.
Additional information
Funding
References
- AIPO, 2014. Interregional Agency for the Po River - AIPO [ online]. Available from: http://www.agenziainterregionalepo.it/ [ Accessed 31 March 2014].
- ARPA, 1994. Area hydrology (Hydrological Records - Emilia Romagna) part two. Italy: Regional Agency for Prevention and Environment of Emilia - Romagna (Hydrometeorological Service).
- ARPA, 2000. Area hydrology (Hydrological Records - Emilia Romagna) part two. Italy: Regional Agency for Prevention and Environment of Emilia - Romagna (Hydrometeorological Service).
- Bates, P.D., 2005. Flood routing and inundation prediction. Encyclopedia of hydrological sciences. New York, NY: John Wiley & Sons.
- Bates, P.D., 2012. Integrating remote sensing data with flood inundation models: how far have we got? Hydrological Processes, 26 (16), 2515–2521. doi:10.1002/hyp.9374
- Bates, P.D., et al., 2014. Observing global surface water flood dynamics. Surveys in Geophysics, 35 (3), 839–852. doi:10.1007/s10712-013-9269-4.
- Bates, P.D. and De Roo, A.P.J., 2000. A simple raster-based model for flood inundation simulation. Journal of Hydrology, 236 (1–2), 54–77. doi:10.1016/S0022-1694(00)00278-X
- Bates, P.D., Horritt, M.S., and Fewtrell, T.J., 2010. A simple inertial formulation of the shallow water equations for efficient two-dimensional flood inundation modelling. Journal of Hydrology, 387 (1–2), 33–45. doi:10.1016/j.jhydrol.2010.03.027
- Beven, K., 2006. A manifesto for the equifinality thesis. Journal of Hydrology, 320 (1–2), 18–36. doi:10.1016/j.jhydrol.2005.07.007
- Beven, K., 2009. Environmental modelling: an uncertain future? London: Routledge.
- Beven, K. and Binley, A., 1992. The future of distributed models: model calibration and uncertainty prediction. Hydrological Processes, 6 (3), 279–298. doi:10.1002/hyp.3360060305
- Boiten, W., 2008. Hydrometry: a comprehensive indroduction to the measurement of flow in open channels. Rotterdam, Netherlands: CRC Press, Balkema.
- Bracken, L.J., 2013. Flood generation and flood waves. In: J.F. Shroder, ed. Treatise on geomorphology. San Diego: Academic Press, 85–94.
- Brandimarte, L. and Di Baldassarre, G., 2012. Uncertainty in design flood profiles derived by hydraulic modelling. Hydrology Research, 43 (6), 753–761. doi:10.2166/nh.2011.086
- Brunner, G., 2010. HEC-RAS, River analysis system – hydraulic reference manual. Hydrologic Engineering Center - HEC. Davis, CA: US Army Corps of Engineers.
- Castellarin, A., Baldassarre, G.D., and Brath, A., 2011. Floodplain management strategies for flood attenuation in the river Po. River Research and Applications, 27, 1037–1047. doi:10.1002/rra.1405
- Chow, V.T., 1959. Open-channel hydraulics: international student ed. Tokyo: McGraw-Hill Kogakusha.
- de Almeida, G.A.M., et al., 2012. Improving the stability of a simple formulation of the shallow water equations for 2-D flood modeling. Water Resources Research, 48 (5), W05528. doi:10.1029/2011WR011570
- de Almeida, G.A.M. and Bates, P., 2013. Applicability of the local inertial approximation of the shallow water equations to flood modeling. Water Resources Research, 49 (8), 4833–4844. doi:10.1002/wrcr.20366
- Di Baldassarre, G. and Claps, P., 2010. A hydraulic study on the applicability of flood rating curves. Hydrology Research, 42 (1), 10–19. doi:10.2166/nh.2010.098
- Di Baldassarre, G. and Montanari, A., 2009. Uncertainty in river discharge observations: a quantitative analysis. Hydrology and Earth System Sciences, 13 (6), 913–921. doi:10.5194/hess-13-913-2009
- Di Baldassarre, G. and Uhlenbrook, S., 2012. Is the current flood of data enough? A treatise on research needs for the improvement of flood modelling. Hydrological Processes, 26 (1), 153–158. doi:10.1002/hyp.8226
- Domeneghetti, A., et al., 2014. The use of remote sensing-derived water surface data for hydraulic model calibration. Remote Sensing of Environment, 149, 130–141. doi:10.1016/j.rse.2014.04.007
- Domeneghetti, A., Castellarin, A., and Brath, A., 2012. Assessing rating-curve uncertainty and its effects on hydraulic model calibration. Hydrology and Earth System Science, 16 (4), 1191–1202. doi:10.5194/hess-16-1191-2012
- Dottori, F. and Todini, E., 2011. Developments of a flood inundation model based on the cellular automata approach: testing different methods to improve model performance. Physics and Chemistry of the Earth, Parts A/B/C, 36 (7–8), 266–280. doi:10.1016/j.pce.2011.02.004
- European Union Environmental Agency (E.E.A.), 2014. EU-DEM [ online]. Available from: http://www.eea.europa.eu/data-and-maps/data/eu-dem#tab-metadata [ Accessed 31 March 2014].
- Falorni, G., et al., 2005. Analysis and characterization of the vertical accuracy of digital elevation models from the shuttle radar topography mission. Journal of Geophysical Research: Earth Surface, 110 (F2), F02005. doi:10.1029/2003JF000113
- Farr, T.G., et al., 2007. The shuttle radar topography mission. Reviews of Geophysics, 45 (2), RG2004. doi:10.1029/2005RG000183
- Gichamo, T.Z., et al., 2012. River cross-section extraction from the ASTER global DEM for flood modeling. Environmental Modelling & Software, 31, 37–46. doi:10.1016/j.envsoft.2011.12.003
- Herschy, R.W., 1999. Hydrometry: principles and practices. 2nd ed. Chichester: John Wiley & Sons.
- Horritt, M.S. and Bates, P.D., 2002. Evaluation of 1D and 2D numerical models for predicting river flood inundation. Journal of Hydrology, 268 (1–4), 87–99. doi:10.1016/S0022-1694(02)00121-X
- Hunter, N.M., et al., 2008. Benchmarking 2D hydraulic models for urban flooding. Water Management, 161 (1), 13–30.
- LeFavour, G. and Alsdorf, D., 2005. Water slope and discharge in the Amazon River estimated using the shuttle radar topography mission digital elevation model. Geophysical Research Letters, 32 (17), L17404. doi:10.1029/2005GL023836
- Liu, Y., et al., 2009. Towards a limits of acceptability approach to the calibration of hydrological models: extending observation error. Journal of Hydrology, 367 (1–2), 93–103. doi:10.1016/j.jhydrol.2009.01.016
- Maione, U., Mignosa, P., and Tomirotti, M., 2003. Regional estimation of synthetic design hydrographs. International Journal of River Basin Management, 1 (2), 151–163. doi:10.1080/15715124.2003.9635202
- Marchi, E., Roth, G., and Siccardi, F., 1995. The November 1994 flood event on the Po River: structural and non-structural measures against inundations. US – Italy Research Workshop on the Hydrometeorology, Impact, and Management of Extreme Floods.
- Marchi, E., Roth, G., and Siccardi, F., 1996. The Po: centuries of river training. Physics and Chemistry of The Earth, 20 (5–6), 475–478.
- McMillan, H., et al., 2010. Impacts of uncertain river flow data on rainfall-runoff model calibration and discharge predictions. Hydrological Processes, 24 (10), 1270–1284.
- McMillan, H.K. and Brasington, J., 2007. Reduced complexity strategies for modelling urban floodplain inundation. Geomorphology, 90 (3–4), 226–243. doi:10.1016/j.geomorph.2006.10.031
- Mersel, M.K., et al., 2013. Estimation of river depth from remotely sensed hydraulic relationships. Water Resources Research, 49, 3165–3179. doi:10.1002/wrcr.20176
- Montanari, A., 2007. What do we mean by ‘uncertainty’? The need for a consistent wording about uncertainty assessment in hydrology. Hydrological Processes, 21 (6), 841–845. doi:10.1002/hyp.6623
- Mukolwe, M.M., et al., 2014. Flood modelling: parameterisation and inflow uncertainty. Proceedings of the ICE - Water Management [online], 167. Available from: http://www.icevirtuallibrary.com/content/article/10.1680/wama.12.00087.
- Neal, J., Schumann, G., and Bates, P., 2012. A subgrid channel model for simulating river hydraulics and floodplain inundation over large and data sparse areas. Water Resources Research, 48 (11), W11506. doi:10.1029/2012WR012514
- Neal, J.C., et al., 2009. Distributed whole city water level measurements from the Carlisle 2005 urban flood event and comparison with hydraulic model simulations. Journal of Hydrology, 368 (1–4), 42–55. doi:10.1016/j.jhydrol.2009.01.026
- Pappenberger, F., et al., 2006. Influence of uncertain boundary conditions and model structure on flood inundation predictions. Advances in Water Resources, 29 (10), 1430–1449. doi:10.1016/j.advwatres.2005.11.012
- Patro, S., et al., 2009. Hydrodynamic modelling of a large flood-prone river system in India with limited data. Hydrological Processes, 23 (19), 2774–2791. doi:10.1002/hyp.7375
- Pelletier, P.M., 1988. Uncertainties in the single determination of river discharge: a literature review. Canadian Journal of Civil Engineering, 15 (5), 834–850. doi:10.1139/l88-109
- Preissmann, A., 1961. Propagation of translatory waves in channels and rivers. Proceedings of the First Congress of French Association for Computation, Genoble, France, 433–442.
- Prestininzi, P., et al., 2011. Selecting the appropriate hydraulic model structure using low-resolution satellite imagery. Advances in Water Resources, 34 (1), 38–46. doi:10.1016/j.advwatres.2010.09.016
- Rodríguez, E., Morris, C.S., and Belz, J.E., 2006. A global assessment of the SRTM performance. Photogrammetric Engineering and Remote Sensing, 72 (3), 249–260. doi:10.14358/PERS.72.3.249
- Romanowicz, R. and Beven, K., 2003. Estimation of flood inundation probabilities as conditioned on event inundation maps. Water Resources Research, 39 (3), 1073. doi:10.1029/2001WR001056
- Sanders, B.F., 2007. Evaluation of on-line DEMs for flood inundation modeling. Advances in Water Resources, 30 (8), 1831–1843. doi:10.1016/j.advwatres.2007.02.005
- Tachikawa, T., et al., 2011a. ASTER Global Digital Elevation Model Version 2 – Summary of Validation Report. Japan.
- Tachikawa, T., et al., 2011b Characteristics of ASTER GDEM Version 2. ed. IEEE International Geoscience and Remote Sensing Symposium, 2011 Canada: Vancouver.
- Trigg, M.A., et al., 2009. Amazon flood wave hydraulics. Journal of Hydrology, 374 (1–2), 92–105. doi:10.1016/j.jhydrol.2009.06.004
- Wang, W., Yang, X., and Yao, T., 2012. Evaluation of ASTER GDEM and SRTM and their suitability in hydraulic modelling of a glacial lake outburst flood in southeast Tibet. Hydrological Processes, 26 (2), 213–225. doi:10.1002/hyp.8127
- Yan, K., Di Baldassarre, G., and Solomatine, D.P., 2013. Exploring the potential of SRTM topographic data for flood inundation modelling under uncertainty. Journal of Hydroinformatics, 15 (3), 849–861. doi:10.2166/hydro.2013.137