
ABSTRACT
A new method known as Unobserved Components–Dynamic Harmonic Regression (UC-DHR) was applied to a 39-year record of rainfall and streamflow for three sub-catchments of the Sarukawa Experimental Watershed in southwestern Japan. Some 25% of the timber was harvested from one of the sub-catchments in May–July 1982 and the objective was to quantify the magnitude of this effect relative to the effects of climate cycles (e.g. Southern Oscillation Index). The observed effects of inter-annual climate cycles (i.e. 0.89–1.36 mm/d) were seen to be comparable (i.e. 0.70–1.17 mm/d) to the effects of harvesting 25% of the standing timber. This result underlines the importance of always quantifying the effect of climate on streamflow response when harvesting impacts are studied.
Editor D. Koutsoyiannis; Associate editor T. Okruszko
1 Introduction
1.1 Forests and water resources during climate changes
Forests and water are both important natural resources. Many research studies related to land-use change (e.g. deforestation or afforestation, vegetation change, urbanization and others) have effectively described relationships between forests and water resources. The rainfall–streamflow process is complex, because of the various pathways of water flow within a catchment. In addition, long-term rainfall and streamflow records may be affected by trends in climate change. Thus, to understand forest and water relationships, one must quantitatively evaluate the effects of both forest management and climate on the modification of water resources.
1.2 Previous harvest experiments for broadleaf tree species
The world’s forest-growing stock is composed of two-thirds broadleaf trees and one-third coniferous trees (FAO Citation2010). Coniferous species clearly dominate the growing stock in Europe, North and Central America. Broadleaf species comprise more than 98% of the total growing stock in Africa, Oceania and South America. Even in Asia, broadleaf species make up about 60% of the total growing stock (FAO Citation2010).
We list here the effects of partial harvesting and clear cutting on streamflow generation in temperate broadleaf old-growth forests in Japan and worldwide, ignoring studies of new plantations of deciduous trees ( and ). Broadleaf forests were further divided into deciduous and evergreen forests. Broadleaf forest catchments are all in deciduous broadleaf forests in North America (Lynch and Corbett Citation1990, Hornbeck et al. Citation1993). Evergreen broadleaf results are represented by a few studies from Taiwan (Hsia and Koh Citation1983) and New Zealand (Pearce et al. Citation1980). In Japan, several reports analysed paired-catchment experiments within deciduous forests. These studies were in the snow-affected regions of East Japan, such as Gumma, Yamagata and Hokkaido, and analysed various deciduous broadleaf species (Nakano Citation1971, Shimizu et al. Citation1994). Most evergreen broadleaf forests are in warm and humid regions of West Japan, and data are lacking that can be used to compare harvesting impacts on hydrology in such forests.
Table 1. Review of the effects of partial harvest or clear cutting on runoff generation of broadleaf old-growth forests in temperate regions worldwide (ignoring new plantations of deciduous trees).
Table 2. Review of the effects of partial harvest or clear cutting on runoff generation of broadleaf old-growth forests in temperate regions in Japan (ignoring new plantations of deciduous trees).
The results of previous harvesting experiments using broadleaf tree species are shown in and and ) and (). ) shows the relationship between annual rainfall at a site and streamflow change after tree removal in the first year after treatment. Previous experiments for evergreen broadleaf tree species were mainly in regions with more than 2000 mm/year of rainfall (Pearce et al. Citation1980, Hsia and Koh Citation1983), and those for deciduous broadleaf tree species were in regions with less than 1100 mm/year (Lynch and Corbett Citation1990, Hornbeck et al. Citation1993). Experiments in areas with moderate rainfall represent mixed-species forests with broadleaf and coniferous trees. In this range, the relationship between pre-harvest rainfall and rainfall increase after harvesting varied greatly. ) shows the relationship between percentage of area harvested and the streamflow change after tree removal in the first year after the treatment. The tendency of streamflow to increase after harvest is related to the extent of harvesting. The streamflow increase after harvest was ≤100 mm/year when 20% of the trees were removed.
Figure 1. Results of earlier cutting experiments for broadleaf tree species. (a) Relationships between annual rainfall at the site and runoff change after harvest in first year after treatment; (b) relationship between percentage of area harvested and runoff change after harvest in the first year after treatment.
1.3 Traditional methods of identifying forestry-related hydrological change
Many paired-catchment experiments have been reported. During our review, paired, nested or grouped catchment studies were considered to give strong evidence, and studies based on after-the-fact analyses of existing data, or less rigorous experiments on large catchments, were considered circumstantial evidence (Hibbert Citation1971). Increased water yield after harvesting trees was partly controlled by rainfall amount and percentage of area harvested (Bruijnzeel Citation2004, Brown et al. Citation2005).
Andréassian (Citation2004) indicated that the traditional method using paired catchments shows a linear relationship between annual rainfall and streamflow amounts. Thus, the problem with this method is that it uses annual data and assumes a linear relationship between rainfall (P) and streamflow (Q), so a long calibration period is needed. When using annual data, most observers agree that P and Q should have a linear relationship. However, this relationship should naturally be nonlinear in more detailed time-series. Furthermore, rainfall amount frequently changes inter-annually, especially in the humid study region. It is difficult to calculate the range of this amount if the calibration period is only 5–9 years in such a region. Suppiah (Citation2004) reported long-term rainfall trends associated with recent climate change or Southern Oscillation Index (SOI).
1.4 New methods of identifying forestry-related hydrological change
Some studies have investigated the effect of land-use change on streamflow in a catchment over a shorter period than a year. Zégre et al. (Citation2010) detected the influence of land-use change on streamflow amount using daily time-series data and a hydrologic model. Ssegane et al. (Citation2013) expressed the daily relationship between groundwater level and streamflow amount as a regression equation, and compared a treated catchment with a control catchment. Tamai (Citation2010) examined the effect of vegetation change history on flow duration curves in paired catchments.
Previously, inference drawn from time-trend studies was weaker than that from paired-catchment studies, simply because there was no climatic control to separate vegetation cover and climatic effects (Whitehead and Robinson Citation1993). Recently, Chappell and Tych (Citation2012) developed a new method for time-series analyses of hydrologic data. Their work was the first application the Unobserved Components–Dynamic Harmonic Regression (UC-DHR) model for catchment hydrologic data. Their technique uses a single time series (monthly, fortnightly, or daily), evaluating model estimation associated with uncertainty information and a nonlinear analysis. Their method can be used for quantitatively evaluating and comparing the effect of forest management versus climate on modifying water resources, and can also be used for non-paired catchments. These characteristics are suitable for regions lacking extensive datasets, such as the humid tropics of many developing countries.
1.5 Study aim
The aim of this study is to quantitatively evaluate the effect of forest management versus climate on altering water resources in a catchment. A new method for quantifying the relative impacts on streamflow and evapotranspiration resulting from climate change and changes in agroforestry and forestry systems has been developed by Chappell and Tych (Citation2012).
The present study focuses on the effects of a 1982 partial harvest on streamflow recorded in an evergreen broadleaf sub-catchment of the Sarukawa Experimental Watershed. This experimental watershed is one of five long-term forest experimental watersheds observed and managed by the Forestry and Forest Products Research Institute of Japan. The Sarukawa Experimental Watershed has three sub-catchments, where high-quality hydrologic observations have been made over more than 39 years and where the history of the growing stocks is well known (Shimizu et al. Citation2008, Asano et al. Citation2011). The watershed is suitable for validation of UC-DHC because it has: (a) evergreen broadleaf trees in a humid region with high annual mean rainfall, streamflow and evapotranspiration (P = 3000 mm/year, Q = 1800 mm/year, P – Q = about 1200 mm/year); (b) partial harvesting (i.e. harvesting 43% of the drainage area and 25% of the growing stock); and (c) 39 years of high-quality daily rainfall and streamflow data.
The study has two objectives.
Quantify effects of climate cycles and trend on hydrologic records: UC-DHR was used to extract seasonal amplitude from rainfall and streamflow records and to compare with the SOI. The SOI has been shown to regulate climate in the Asia-Oceania region, e.g. Thailand, India, Australia and Japan (Liu et al. Citation1998, Shrestha and Kostaschuk Citation2005, Jin et al. Citation2005, Chandimala and Zubair Citation2007, Fu et al. Citation2013, Räsänen and Kummu Citation2013, Sun et al. Citation2014).
Quantify effects of harvesting impacts on hydrologic records: The harvesting impact on hydrologic records was quantified using the UC-DHR approach. The objective was to determine if forestry-related change in streamflow was larger than the dynamics associated with the climate.
2 Study site and method
2.1 Study site
The Sarukawa Experimental Watershed was established for forest hydrological studies in a warm temperate rainforest of Miyazaki Prefecture, Japan. This catchment is in the upstream portion of the Oyodo River, where it flows through the city of Miyazaki. Hydrologic observations began in 1959. The results of observations from this experimental watershed were gradually released in the years following 1967, when standard observation methods were established. Thus, observational data for the 39 years of 1967–2005 were summarized and published every 10 or 20 years during this period (Forest Influences Unit, Kyushu Branch Station Citation1976, Takeshita et al. Citation1996, Shimizu et al. Citation2008, Asano et al. Citation2011). These reports include summarized daily rainfall and daily streamflow and an outline of site conditions, geology, and other information on the watersheds. The watershed includes three small sub-catchments (), i.e. Sarukawa No. 1 (Srk1), Sarukawa No. 2 (Srk2), and Sarukawa No. 3 (Srk3). Sub-catchments Srk1 and Srk2 adjoin each other and Srk3 is about 1 km east-northeast of Srk2 (Asano et al. Citation2011; summarizes basic information).
Table 3. Basic information on Sarukawa Experimental Watershed.
Figure 2. Contour map of study areas within Sarukawa Experimental Watershed; No. 1 (Srk1), No. 2 (Srk2), and No. 3 (Srk3). Shaded area represents 25% harvest cutting area of Srk2 in 1982.
This climate classification of the study site is “the Pacific Ocean side area in southern Kyushu” (Uchijima et al. Citation2003). In this area, there is a heavy rain period called a ‘Tsu-yu’, caused by an atmospheric pressure pattern from May to July. Rainfall during this period constitutes about 30% of annual precipitation. Moreover, because there may be typhoons with heavy rain in June–November, the climate of this area has strong inter-annual variation (Uchijima et al. Citation2003).
2.2 Forest history and harvesting
Shimizu et al. (Citation2008) estimated the history of change in the growing stock of the Sarukawa Experimental Watershed using a double-sampling method based on a combination of aerial photographs and plot-survey data (). Sub-catchments Srk1 and Srk2 have natural evergreen broadleaf trees and Srk3 is covered by mixed forests with natural evergreen broadleaf and coniferous trees, planted in 1957 when observations commenced in the watershed (Shirai et al. Citation1962). Two paired harvesting experiments have been conducted in the watershed. First, clear cutting was done in 1965–1966, with Srk1 and Srk3 as treated catchments and Srk2 as the control. Later, there was a partial harvest in 1987, using Srk2 as the treated catchment and Srk1 and Srk3 as the controls.
Figure 3. Growing stock variation history in Sarukawa Experimental Watershed. Data estimated by Shimizu et al. (Citation2008).
indicates that the growing stock of Srk1 and Srk3 declined to 50 m3 ha–1 in 1966 after the first harvesting experiment. The 1982 experimental harvest also reduced the growing stock of Srk2. Even though Srk2 was only partially harvested in 1982, its growing stock has always been greater than those of Srk1 or Srk3. Srk2 was partially harvested from May to July 1982. Thus, we selected July 1982 as the starting point of this study, i.e. when the forest cover changed in the UC-DHR analysis. This partial timber harvest covered 43% of the drainage area and constituted 705.1 m3 (Takeshita et al. Citation1986). This timber extraction volume is equivalent to 25% of the growing stock, as surveyed in 1974. Harvesting was undertaken in streamside areas with larger trees near the hilltops left unharvested. Vegetation in Srk2 was allowed to recover naturally without planting.
For the first paired harvest experiment, observational data collected during the first stage (1959–1966) were considered inaccurate and lacked sufficient calibration data, and so have never been published. Komatsu et al. (Citation2007) used initial hydrologic data from 1959 to 1965 as equivalent to other observation data. However, these data do not contain observed values and were extrapolated using the empirical formula of Shirai et al. (Citation1962) to roughly approximate and address the amount of annual evapotranspiration observed in the region. Thus, in our study, UC-DHR was adapted for the Srk2 partial harvest experiment in 1982, using only reliable and higher-quality daily rainfall and streamflow data collected between 1967 and 2005.
2.3 Dataset for analysis
For adaptation restrictions of UC-DHR, a sufficiently long hydrologic record is needed to meet the analysis objective. Chappell and Tych (Citation2012) used a 7-year dataset (2.5 years before harvest and 4.5 years afterwards) for their UC-DHR analyses. Thus, it is probable that a dataset covering 2–3 years before and after harvest is adequate to investigate harvesting impacts on a streamflow record. Nevertheless, 20–30 years of data would likely be required to investigate relationships for long-term trends and cycles as extracted from hydrologic records and climate indices such as SOI. As there may be considerable variation in seasonal rainfall from year to year, flow records over 20–30 years are required to address flow regimes (Shaw et al. Citation2010). Thus, the 39-year data of the present study are sufficient to describe streamflow patterns at the study site. The results will be useful in evaluating the effects of land-cover change on streamflow in both humid temperate regions and the humid tropics, where the extent of forested areas are being reduced by various pressures such as socioeconomic factors.
2.4 UC-DHR analysis
Chappell and Tych (Citation2012) first described the UC-DHR model as an application for measuring hydrologic change. We explain the analysis procedure briefly as follows.
The UC-DHR model is a type of univariate UC model, a group of models that includes basic structural and dynamic linear models (Harvey Citation1984, West et al. Citation1985). UC-DHR characterizes trend (Tt: inter-annual), short-term periodic (Ct: cyclical annual) and sub-annual and zero-mean observation error (et, with variance, σe2) components.
The simulated time series of rainfall and streamflow (yt) were calculated using:
The most important component characterized in the present study is Ct, which is calculated via:
where ai,t and bi,t are stochastic time variable parameters (TVPs) that define the amplitude of the harmonic sine and cosine components, and ωi, i = 1, 2 …, Ss are fundamental and harmonic frequencies associated with periodicity in the series. In this study, trends of rainfall and streamflow are modelled using an integrated random walk process, and all TVPs in the periodic component are modelled using scalar random walk processes.
For rainfall and streamflow in the three watersheds (Srk1, Srk2 and Srk3), daily means were calculated for each month from a daily dataset. Each individual record was analysed by UC-DHR which is an algorithm within the CAPTAIN Toolbox (http://captaintoolbox.co.uk).
July 1982, the date of the Srk2 partial harvest, was set as the point of water balance change (the ‘intervention point’). The harvest effect is such that the data (e.g. strength of a trend) were estimated separately in the periods before and after the selected time. Both mean and slope of the trend and amplitudes of harmonic components can be estimated in this way. The noise variance ratio (NVR) is the volatility of the estimated states and TVPs of the UC-DHR model. This was set to NVR = 16 by trial and error of S-fitting of the data. If the step change in the trend at the intervention point is larger than the standard deviation, then a step change is said to be observable in the time series (Chappell and Tych Citation2012). The Sarukawa Experimental Watershed had about 15.5 years’ hydrological data before harvest on May to July 1982. Thus, we calculated the step increase of peak value from the first month after harvest to that of the long-term average before harvest.
Seasonal amplitudes of rainfall and streamflow were compared with trends in the SOI. The SOI is defined as the normalized pressure difference between the island of Tahiti and Darwin, Australia. There are several slight variations of SOI values calculated at various centres. Here, we calculated the SOI based on the method of Ropelewski and Jones (Citation1987). This uses a second normalization step and was the standard method of the Climate Analysis Centre of the University of East Anglia in 1987. Allan et al. (Citation1991) described the processing of these data. Also see Können et al. (Citation1998) for details of the early pressure sources and methods used to compile the series from 1866 onwards. The SOI trend was shown by scaled and smoothed values using the Integrated Random Walk Model in the CAPTAIN Toolbox.
3 Results
3.1 Results of UC-DHR applied to rainfall and streamflow records
The UC-DHR model was applied to each individual rainfall and streamflow record from Srk1, Srk2 and Srk3 for the 39-year study period. Twenty-five percent of the growing stock of Srk2 was harvested during May–July 1982. For the streamflow record, results are provided for both the treated catchment of Srk2 and control catchments of Srk1 and Srk3.
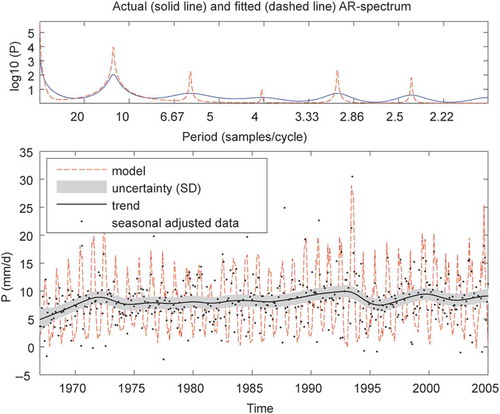
Both the seasonal (annual and sub-annual cycles) and trend (inter-annual cycles and drift) components were identified within each time series. For example, shows UC-DHR results of all components of the rainfall time series (without harvest), together with observed data and model uncertainty. The power spectrum of the rainfall record showed strong harmonic periodicity (peaks at 12.1, 5.9, 4, 3, 2.4 and 2 months). Thus, these automatically calculated values were used for the UC-DHR analysis of rainfall. For all streamflow records, power spectra of the observed values did not have peaks as well defined as the harmonics. Thus, an alternative method of manually establishing the harmonics for UC-DHR analysis was conducted, using peaks of 12, 6, 3 and 2.4 months. Regarding rainfall trend, there was less rain between 1967–1971 and 1995–1997 ().
Figure 4. Observed and modelled rainfall for Saruakwa Experimental Watershed. Upper panel: observed (solid line) and modelled (dashed line) power spectra; lower panel: observed rainfall time-series and UC-DHR modelled rainfall time-series together with uncertainty band (± standard deviation in grey shading). Observed data are shown as seasonally adjusted. Trend comprising inter-annual cycles and drift is also shown. The x-axis is the year and the y-axis is monthly streamflow (mm/d).
3.2 Seasonal amplitudes in the hydrological record and SOI data
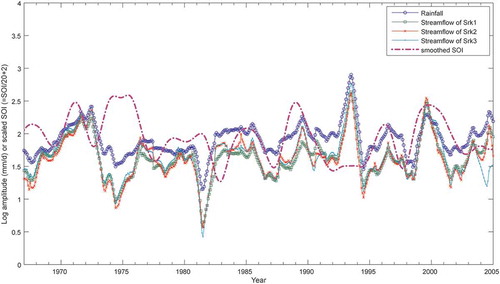
shows that the seasonal amplitudes of rainfall were largely synchronized with the SOI trend (). However, there was a portion of this period in which this relationship was reversed. Although SOI was relatively low, seasonal amplitude in rainfall had a high value in June 1993, and the heaviest rain occurred in this month (48.5 mm/d for the monthly average). Further, seasonal rainfall amplitude was relatively low but the SOI was relatively high from May to June 1974. The temporal variations of seasonal amplitudes in streamflow were similar to those in rainfall (). The rainfall amplitude generally exceeded that of streamflow ().
Figure 5. Seasonal amplitudes of rainfall and streamflow in Srk1, Srk2 and Srk3, and SOI trends. Seasonal amplitudes are shown as log values. SOI trend is shown in scaled and smoothed values, using the Integrated Random Walk Model.
3.3 Streamflow trend with uncertainty
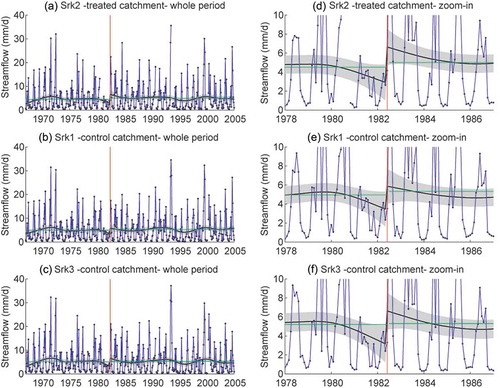
shows streamflow trends and seasonally adjusted data for Srk1, Srk2 and Srk3 for the entire study period (−) and a zoomed-in depiction of data for 1978–1987 (–()). The harvested Srk2 basin does show a step increase in streamflow at the end of the harvesting period; however, this change was not sustained for more than 2 years ()). While step increase in streamflow was much smaller for control basin Srk1 ()), the apparent change in control basin Srk3 was comparable to that in the harvesting basin ()). This suggests that the step increase in streamflow between the 1981/82 period and the 1982/83 period relates mostly to the step increase in rainfall (and hence streamflow) between the two periods, rather than a harvesting affect.
Figure 6. Streamflow trends and seasonally adjusted data for Srk1, Srk2 and Srk3. Left panels depict entire period and right panels zoom in on the harvest period of July 1982. The blue line shows seasonally adjusted data and the black line is trend with uncertainty band (± standard deviation in grey shading). Green horizontal lines are mean values before and after harvest.
4 Discussion
4.1 SOI impacts on basin rainfall and streamflow
The SOI index represents the strength of the trade winds. When the index is positive, trade winds are strong and when negative, those winds are weak. Therefore, a low or high SOI is representative of an El Niño or La Niña event, respectively. In a La Niña event, sea-surface temperature in the West Pacific Ocean tropical zone rises and cumulonimbus cloud activity increases there. For this reason, in summer it becomes easy to forecast that Pacific high-pressure systems will periodically form off the northern coasts of Japan. These systems are readily affected by warm, moist air arriving on southerly winds from southwestern Japan, including Okinawa and Amami. For this reason, during summer on the Pacific Ocean side of northwestern Japan, temperatures tend to remain high during the long daylight hours and the chance of rain increases.
During a La Niña event, there is a tendency for rainy season precipitation to increase on the Pacific Ocean side in south Kyushu, where the study site is located. Therefore, when the SOI becomes high, a La Niña event develops and rainfall increase is expected. Positive correlation was found via the seasonal amplitudes of a hydrological record and a SOI trend (). For these periods, it is believed that local climate was generally modulated by the global climate.
Seasonal amplitude of the relationship between rainfall and SOI reversed in some periods, such as 1967, 1973, 1978, 1981 and 1993. Consequently, local climate conditions in the city of Miyazaki (25 km from Sarukawa Experimental Watershed) over the past 119 years (1886–2005) were investigated, using a historical meteorological database of the Japan Meteorological Agency (Citation2014). According to this database, 1993 had the maximum annual precipitation at Miyazaki. The precipitation, which exceeded 1000 mm in southern Kyushu from a seasonal rain front and typhoon No. 4 (Nathan) over 13 May to 25 July of that year, caused a serious landslide disaster and flood damage in this area. In contrast, 1967, 1973, 1978 and 1981 were years with little rain, assigning them to 10th, 7th, 9th and 6th places for annual precipitation at Miyazaki, respectively. These years had little rainfall during the ‘Tsu-yu’ rainy season, about 30–60% of the average for a typical year (Uchijima et al. Citation2003). Rainfall during the rainy season was 500 mm in southern Kyushu, about 30% of the annual amount (Uchijima et al. Citation2003). Thus, the years in which the seasonal amplitude of the hydrologic record did not synchronize with the SOI had the maximum or local minimum in the historical meteorological record. The local rather than regional climate represented by the SOI is believed to have strongly affected the hydrologic record in these years.
4.2 Quantification of harvesting effects on the streamflow record
Harvesting within 43% of the drainage area (but only 25% of the entire tree volume) did give an increase in streamflow in Srk2 that was larger than the standard deviation on the trend (). Streamflow typically increases after harvesting, because evapotranspiration in the harvested area is expected to decrease (Brown et al. Citation2005). Stednick (Citation1996) found that some studies needed harvesting over 50% of the basin for water balance changes to be observed, but in other studies harvesting of only 15% of the basin could result in observable hydrological change. The step increase in streamflow for the three basins was: (a) 2.06 mm/d for Srk2 (treated catchment); (b) 0.89 mm/d for Srk1 (control catchment); and (c) 1.36 mm/d for Srk3 (control catchment). If the step increases in Srk1 and Srk3 relate to climate cycles and trend, then the effect of harvesting against the controls Srk1 and Srk3 is therefore:
1.17 mm/d (Srk2–Srk1 step increase) giving the equivalent of 1.17 × 365 = 427 mm/year, and
0.70 mm/d (Srk2–Srk3 step increase) giving the equivalent of 0.70 × 365 = 256 mm/year, respectively.
shows the effect of timber harvesting on change in streamflow (mm/year) from 16 studies conducted in broadleaf old-growth forests. As different proportions of the timber volume were harvested, the table also shows values (mm/year) if 25% of the timber had been harvested. These recalculated values are considerably smaller than the 427 mm/year equivalent or 256 mm/year equivalent. The Sarukawa basins did, however, receive considerably more rainfall, namely 3046 mm/year (averaged over 1967–2005), giving streamflow of 1755 mm/year (averaged over 1967–2005), and so 1291 mm/year evapotranspiration. This increase of water yield of 256 or 427 mm/year was, therefore, 20% or 33% of mm/year evapotranspiration. These values bracket the actual percentage of the harvested growing stock.
The lack of a persistent impact on water yield over several years may be related to rapid regeneration in the Srk2 catchment. A secondary forest of Quercus serrata and Mallotus japonicus is visible in the harvested areas of Srk2. M. japonicus has the capacity to actively regenerate (Yamagawa and Ito Citation2006; Yamagawa et al. Citation2006).
5 Conclusion
The UC-DHR algorithm was applied to a 39-year record of rainfall and streamflow for three sub-catchments of the Sarukawa Experimental Watershed in southwestern Japan. Some 25% of the timber was harvested from one of the sub-catchments (Srk2) in May–July 1982. The observed effects of inter-annual climate cycles in the control basins Srk1 and Srk3 produced a streamflow increase at the same time as the harvesting that covered the range 0.89–1.36 mm/d. Similarly, the increase in streamflow resulting from harvesting 25% of the standing timber in Srk2 (once the climate effects had been removed) produced an increased in streamflow of 0.70–1.17 mm/d. This result underlines the importance of always quantifying the effect of climate on streamflow response when harvesting impacts are studied.
Acknowledgements
We thank the Lancaster Environment Centre, Lancaster University and Forestry and Forest Products Research Institute for providing the rare opportunity to conduct research in a wide variety of environments. We thank Dr Tomonori Kume of the National Taiwan University for sending a very important reference. Also, we express our thanks to and respect for the many people who have managed and collected observational data in the Sarukawa Experimental Watershed for more than half a century.
Disclosure statement
No potential conflict of interest was reported by the authors.
Additional information
Funding
References
- Allan, R.J., et al., 1991. A further extension of the Tahiti-Darwin SOI, early ENSO events and Darwin pressure. Journal of Climate, 4, 743–749. doi:10.1175/1520-0442(1991)004<0743:AFEOTT>2.0.CO;2
- Andréassian, V., 2004. Waters and forests: from historical controversy to scientific debate. Journal of Hydrology, 291, 1–27. doi:10.1016/j.jhydrol.2003.12.015
- Asano, S., et al., 2011. Statistical report of hydrological observation at Sarukawa Experimental Watershed (January, 2001 to December 2005). Bulletin of FFFPRI, 407, 49–71.
- Brown, A.E., et al., 2005. A review of paired catchment studies for determining changes in water yield resulting from alterations in vegetation. Journal of Hydrology, 310, 28–61. doi:10.1016/j.jhydrol.2004.12.010
- Bruijnzeel, L.A., 2004. Hydrological functions of tropical forests: not seeing the soil for the trees? Agriculture. Agriculture, Ecosystems & Environment, 104, 185–228. doi:10.1016/j.agee.2004.01.015
- Chandimala, J. and Zubair, L., 2007. Predictability of stream flow and rainfall based on ENSO for water resources management in Sri Lanka. Journal of Hydrology, 335, 303–312. doi:10.1016/j.jhydrol.2006.11.024
- Chappell, N.A. and Tych, W., 2012. Identifying step changes in single streamflow and evaporation records due to forest cover change. Hydrological Processes, 26 (1), 100–116. doi:10.1002/hyp.8115
- Fahey, B. and Jackson, R., 1997. Hydrological impacts of converting native forests and grasslands to pine plantations, South Island, New Zealand. Agricultural and Forest Meteorology, 84, 69–82. doi:10.1016/S0168-1923(96)02376-3
- FAO (Food and Agricultural Organization of the United Nations), 2010. Global Forest Resources Assessment 2010, FAO Forestry paper 163. Rome: FAO.
- Fu, G., et al., 2013. Temporal variation of extreme rainfall events in China, 1961–2009. Journal of Hydrology, 487, 48–59. doi:10.1016/j.jhydrol.2013.02.021
- Harvey, A.C., 1984. A unified view of statistical forecasting procedures. Journal of Forecasting, 3, 245–275. doi:10.1002/for.3980030302
- Hibbert, A.R., 1971. Increases in streamflow after converting chaparral to grass. Water Resources Research, 7, 71–80. doi:10.1029/WR007i001p00071
- Hornbeck, J.W., et al., 1993. Long-term impacts of forest treatments on water yield: a summary for Northeastern USA. Journal of Hydrology, 150, 323–344. doi:10.1016/0022-1694(93)90115-P
- Hornbeck, J.W., et al., 1987. The northern hardwood forest ecosystem: ten years of recovery from clearcutting, U.S. Department of Agriculture, Forest Service, Northeastern Forest Experiment Station, Research Paper NE-596, 30pp.
- Hornbeck, J.W., Pierce, R.S., and Federer, C.A., 1970. Streamflow changes after forest clearing in New England. Water Resources Research, 6 (4), 1124–1132. doi:10.1029/WR006i004p01124
- Hsia, Y.J. and Koh, C.C., 1983. Water yield resulting from clear cutting a small hardwood basin in central Taiwan. Hydrology of humid tropical regions with particular reference to the hydrological effects of agriculture and forestry practice. In: Proceedings of the Hamburg Symposium, Hamburg, August. Wallingford, UK: International Association of Hydrological Sciences. IAHS Publ. 140, 215–220.
- JMA (Japan Meteorological Agency), 2014. The past meteorological data search [online]. JMA. Available from: http://www.jma.go.jp/jma/indexe.html [ Accessed 20 August 2014].
- Jin, Y.-H., et al., 2005. Quantitative relationship between SOI and observed precipitation in Southern Korea and Japan by nonparametric approaches. Journal of Hydrology, 301, 54–65. doi:10.1016/j.jhydrol.2004.06.026
- Johnson, E.A. and Kovner, J.L., 1956. Effect on streamflow of cutting a forest understory. Forest Science, 2, 82–91.
- Komatsu, H., Tanaka, N., and Kume, T., 2007. Do coniferous forests evaporate more water than broad-leaved forests in Japan?. Journal of Hydrology, 336, 361–375. doi:10.1016/j.jhydrol.2007.01.009
- Können, G.P., et al., 1998. Pre-1866 extensions of the southern oscillation index using early Indonesian and Tahitian meteorological readings. Journal of Climate, 11, 2325–2339. doi:10.1175/1520-0442(1998)011<2325:PEOTSO>2.0.CO;2
- Forest Influences Unit., Kyshu Branch Station., 1976. Statistical report of hydrological observation at Sarukawa experimental watershed (January, 1967 to December 1976). Bulletin FFFPRI, 317, 147–190.
- Liu, Z., Valdés, J.B., and Entekhabi, D., 1998. Merging and error analysis of regional hydrometeorologic anomaly forecasts conditioned on climate precursors. Water Resources Research, 34, 1959–1969. doi:10.1029/98WR01376
- Lynch, J.A. and Corbett, E.S., 1990. Evaluation of best management practices for controlling nonpoint pollution from silvicultural operations. Journal of the American Water Resources Association, 26, 41–52. doi:10.1111/j.1752-1688.1990.tb01349.x
- Lynch, J.A., Corbett, E.S., and Sopper, W.E., 1980. Impact of forest cover removal on water quality. Pennsylvania State University. Research Paper 23–604. University Park, PA: Institute for Research on Land and Water Resource, 91p.
- Nakano, H., 1971. Effect on streamflow of forest cutting and change in regrowth on cut-over area. Bulletin of FFPRI (Bull Gov Forest Experiments Sta), 240, 1–251.
- Pearce, A.J., Rowe, L.K., and O’Loughlin, C.L., 1980. Effects of clear felling and slash-burning on water yield and storm hydrographs in evergreen mixed forests, western New Zealand. In: Proceedings of the Helsinki Symposium, Helsinki, June. IAHS Publication no. 130, pp. 119–127.
- Räsänen, T. and Kummu, M., 2013. Spatiotemporal influences of ENSO on precipitation and flood pulse in the Mekong river basin. Journal of Hydrology, 476, 154–168. doi:10.1016/j.jhydrol.2012.10.028
- Ropelewski, C.F. and Jones, P.D., 1987. An extension of the Tahiti–Darwin Southern Oscillation Index. Monthly Weather Review, 115, 2161–2165. doi:10.1175/1520-0493(1987)115<2161:AEOTTS>2.0.CO;2
- Shaw, E.M., et al., 2010. River flow analysis. In: Hydrology in practice. 4th ed. Abingdon: Spon Press, 235–279.
- Shimizu, A., et al., 2008. Statistical report of hydrological observation at Sarukawa experimental watershed (January, 1977 to December 1996). Bulletin of FFPRI, 406, 13–65.
- Shimizu, T., Tsuboyama, Y., and Hosoda, I., 1994. Effects of contour-lines strip cutting on stream flow (I) long-term runoff characteristics during the warm season. Journal of Japan Forest Society, 76, 393–401.
- Shirai, J., et al., 1962. Vegetation of Sarukawa experimental forest- experiment on forest influences upon streamflow at Sarukawa (report 2). Bulletin of FFPRI, 140, 89–100.
- Shrestha, A. and Kostaschuk, R., 2005. El Niño/Southern Oscillation (ENSO)-related variablity in mean-monthly streamflow in Nepal. Journal of Hydrology, 308, 33–49. doi:10.1016/j.jhydrol.2004.10.020
- Ssegane, H., et al., 2013. Consistency of hydrologic relationships of a paired watershed approach. American Journal of Climate Change, 2, 147–164. doi:10.4236/ajcc.2013.22015
- Stednick, J.D., 1996. Monitoring the effects of timber harvest on annual water yield. Journal of Hydrology, 176, 79–95. doi:10.1016/0022-1694(95)02780-7
- Sun, X., et al., 2014. A general regional frequency analysis framework for quantifying local-scale climate effects: A case study of ENSO effects on Southeast Queensland rainfall. Journal of Hydrology, 512, 53–68. doi:10.1016/j.jhydrol.2014.02.025
- Suppiah, R., 2004. Trends in the southern oscillation phenomenon and Australian rainfall and changes in their relationship. International Journal of Climatology, 24, 269–290. doi:10.1002/joc.1001
- Swank, W.T. and Helvey, J.D., 1970. Reduction of streamflow increases following regrowth of clearcut hardwood forest. In: Proceedings of the Symposium on the Results of Research on Representative and Experimental Basins, December (1970) Wellington, New Zealand. Publication 96. United Nations Educational, Scientific and Cultural Organization - International Association of Scientific Hydrology, Leuven, Belgium, pp. 346–360.
- Swank, W.T. and Miner, N.H., 1968. Conversion of hardwood-covered watersheds to white pine reduces water yield. Water Resources Research, 4, 947–954. doi:10.1029/WR004i005p00947
- Swank, W.T., Vose, J.M., and Elliott, K.J., 2001. Long-term hydrologic and water quality responses following commercial clearcutting of mixed hardwoods on a southern Appalachian catchment. Forest Ecology and Management, 143, 163–178. doi:10.1016/S0378-1127(00)00515-6
- Swift, L.W. and Swank, W.T., 1981. Long term responses of streamflow following clearcutting and regrowth. Hydrological Sciences Bulletin, 26, 245–256. doi:10.1080/02626668109490884
- Takeshita, M., Ohtani, Y., and Kawai, E., 1986. Runoff mechanism of small mountainous watershed (II) changes in monthly and annual runoffs after partial cutting. Kyusyu Journal of Forest Research, 39, 281–282.
- Takeshita, M., Shimizu, A., and Miyabuchi, Y., 1996. Statistical report of hydrological observation at Sarukawa Experimental Watershed (January, 1977 to December 1996). Bulletin of FFPRI, 370, 31–75.
- Tamai, K., 2010. Comparison of discharge duration curves from two adjacent forested catchments—effect of forest age and dominant tree species. Journal of Water Resource and Protection, 2, 742–750. doi:10.4236/jwarp.2010.28086
- Uchijima, Z., et al., 2003. The four seasons and the weather of Miyazaki – an invitation to local environmental science. Miyazaki: Koumyakusya Inc.
- West, M., Harrison, P.J., and Migon, H.S., 1985. Dynamic generalized linear models and Bayesian forecasting. Journal of the American Statistical Association, 80, 73–83. doi:10.1080/01621459.1985.10477131
- Whitehead, P.G. and Robinson, M., 1993. Experimental basin studies - an international and historical perspective of forest impacts. Journal of Hydrology, 145, 217–230. doi:10.1016/0022-1694(93)90055-E
- Yamagawa, H. and Ito, S., 2006. The role of different sources of tree regeneration in the initial stages of natural forest recovery after logging of conifer plantation in a warm-temperate region. Journal of Forest Research, 11, 455–460. doi:10.1007/s10310-006-0229-4
- Yamagawa, H., et al., 2006. Effects of topography and management history on natural forest recovery in abandoned forest after clear-cutting in Miyazaki, Japan. Journal of Forest Research, 11, 99–106. doi:10.1007/s10310-005-0192-5
- Zégre, N., et al., 2010. In lieu of the paired catchment approach: hydrologic model change detection at the catchment scale. Water Resources Research, 46, W11544. doi:10.1029/2009WR008601