
ABSTRACT
Under the combined influence of climate changes and human activities, the hydrological regime of the Wei River shows remarkable variations which have caused many issues in the Wei River in recent decades, such as a lack of freshwater, water pollution, disastrous flooding and channel sedimentation. Hence, hydrological regime changes and potential human-induced impacts have been drawing increasing attention from local government and hydrologists. This study investigates hydrological regime changes in the natural and measured runoff series at four hydrological stations on the main Wei River and quantifies features of their long-term change by analysing their historical annual and seasonal runoff data using several approaches, i.e., continuous wavelet transform, cross-wavelet, wavelet coherence, trend-free pre-whitening Mann-Kendall test and detrended fluctuation analysis. By contrasting two different analysis results between natural and measured river runoff series, the impacts of human activities on the long-term hydrological regime were investigated via the changes of spatio-temporal distribution in dominant periods, the trends and long-range memory of river runoff. The results show : (a) that periodic properties of the streamflow changes are the result of climate, referring to precipitation changes in particular, while human activities play a minor role; (b) a significant decreasing trend can be observed in the natural streamflow series along the entire main stream of the Wei River and the more serious decrease emerging in measured flow should result from human-induced influences in recent decades; and (c) continuous decreasing streamflow in the Wei River will trigger serious shortages of freshwater in the future, which may challenge the sustainability and safety of water resources development in the river basin, and should be paid great attention before 2020.
Editor Z.W. Kundzewicz; Associate editor K. Hamed
1 Introduction
Hydrological processes under natural conditions are extremely complex and variable, frequently showing complex nonlinear, non-stationary, and multi-temporal scale characteristics influenced by many physical factors (Yevjevich Citation1972, Blazkov and Beven Citation1997, Laio et al. Citation2001, Xu and Singh Citation2004, Lima and Lall Citation2010, Lin et al. Citation2013). These factors are generally summarized as climate conditions and underlying surface conditions (Green et al. Citation2007, Guo et al. Citation2008). However, with global human demand for freshwater rapidly increasing, human activities (such as water withdrawal, dam construction, changes of land use and land cover) have greatly altered the hydrological regime of rivers and added complexities to river hydrological processes (Arnold and Gibbons Citation1996, Vogel et al. Citation1999, Jones et al. Citation2006, Yang et al. Citation2010, Zhan et al. Citation2012). This means that fully understanding future changes in river hydrological regimes has become very difficult. Fortunately, it was found that hydrological time series follow some long-term hydrological laws (Kantelhardt et al. Citation2003), and these laws can serve to show the comprehensive reactions of the complex hydrological process. Through distinguishing their long-term trend and time-scale characteristics in natural and measured runoff series, the hydrological regimes in the years to come and their variations under the influence of human activities can be evaluated well. This is of considerable significance to water resources planning and management, design of hydraulic engineering activities and water balancing between ecosystems and human needs in the present and future (Vogel et al. Citation1999, Yang et al. Citation2010).
The Wei River is the largest tributary of the Yellow River; it is located in the eastern eco-environmentally vulnerable belt of the northwest district of China and has provided an important water resource supply and ecological service for its riparian zone for centuries. In recent years, because of reduced precipitation and dramatically increasing water consumption for industry and agriculture, the Wei River has been beset by river channel shrinkage, sediment aggradation, increasing water pollution, decreasing biodiversity and conflict between water supply and demand (Zhao Citation2003, Wang et al. Citation2004, Wu et al. Citation2012). Its health condition has deteriorated to a stunning degree and has become the main factor restraining the sustainable development of the economy and society of the Wei River basin (WRB). Nevertheless, some districts, such as Xi’an, Baoji and Xianyang cities and other areas located in the basin, have developed with astounding speed since the 1990s. Currently the WRB is already highly urbanized, with five large and medium-sized cities, eight important industrial parks and four national agricultural irrigation districts, implying that an enormous dependence on and demand for water resources is concealed in the formidable momentum of the WRB’s economic development. However, due to the influence of human interference and climate changes, the streamflow of the Wei River has decreased significantly, threatening the security of regional water resources in recent years. Therefore, objectively knowing the long-term hydrological regime (such as runoff period, trend and future direction) of the Wei River and the impacts of human activities has become an urgent need for the synthetic utilization of water resources in the WRB and for regional economic development.
For a long time, the impact of human activity on the hydrological regime has been paid great attention by scholars and policy makers worldwide (Mimikou et al. Citation1999, Weiskel et al. Citation2007, Ma et al. Citation2009, Du and Shi Citation2012, Sun et al. Citation2014). Some similar studies addressing climate changes and hydrological processes in the Wei River have been done in recent years (e.g. Zhang et al. Citation2003, Liu and Hu Citation2006, Guo and Li Citation2012, Du and Shi Citation2012, Gao et al. Citation2013, Fan et al. Citation2013), but few studies addressing changes in hydrological regimes as a result of human activities are available. The objective of this study is to analyse the changes in the hydrological regime, such as periods, trends and direction in the future. In addition, the impact on these regimes of human activities and the trend of the change in runoff in the changing environment are also discussed. Through these discussions, the current study will be helpful for further understanding the hydrological regime under the impact of climate changes and human activities and will contribute to formulating future-oriented water resource management strategies for the WRB.
2 Study area and data
The Wei River () originates from the north of the Wushu Mountains in Weiyuan County, Gansu Province. It has a length of 818 km and flows into the Yellow River at Tongguan in Shaanxi Province. The drainage basin lies between 103.5° and 110.5°E and 33.5° and 37.5°N, covering a total drainage area of 134 000 km2 and including many important cities such as Xi’an, Baoji, Xianyang, Weinan and Tianshui. Generally speaking, the basin topography fluctuates greatly; the western part is higher than the eastern part, with the largest difference in elevation being over 3000 m. The whole basin has a continental climate, with an average annual temperature, precipitation and evaporation of around 10°C, 550 mm, and 1100 mm, respectively.
Figure 1. Location of the study region and hydrological and meteorological stations in the Wei River basin.
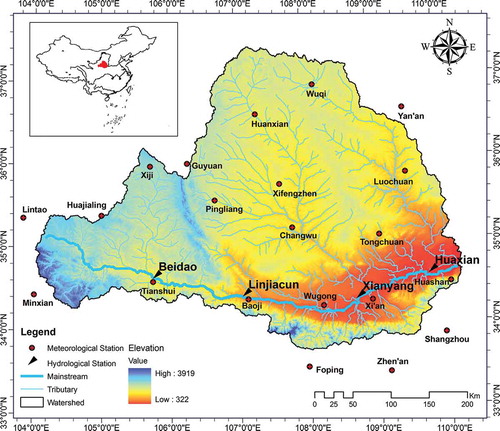
The study mainly concentrates on the main stream of the Wei River. Hydrological series at four hydrological stations along the main stream, that is, Beidao, Linjiacun, Xianyang and Huaxian stations, are analysed (, ). Beidao station is located in the less hilly areas of the upper reaches, belonging to Gansu Province. Linjiacun and Xianyang stations are located on the boundary of the upper-middle and middle-lower reaches, respectively. Huaxian station is in the lower reaches, as the last hydrological station of the Wei River, controlling 97.2% of the total drainage area. The last three stations are all located on the Guanzhong fluvial plain of Shaanxi Province.
Table 1. Information on the hydrological stations considered in this study.
The data analysed in the study include natural and measured runoff series. The natural runoff series at these four hydrological stations are calculated via the measured annual runoff adding to the human-induced runoff, which mainly includes human use of water resources and the net impounded runoff of reservoirs. It can be calculated by the following equation:
where W is the natural runoff after reduction, W1 is the measured runoff, W2, W3 and W4 are the net consumption requirements for industry, agriculture and domestic use, respectively, W5 is the incremental loss by water surface evaporation rather than land evaporation, W6 is the quantity of percolation from reservoirs, W7 is the water storage variable of the project, W8 is the quantity of inter-basin water diversion, W9 is diverted flood water, W10 is water influenced by soil and water conservation measures and W11 is the water component influenced by other factors, such as urbanization, groundwater extraction and recharge, and ecological change.
The natural annual and seasonal runoff series analysed in this study are free of human influences and cover the period of 1956–2000. The natural streamflow data have been provided by the Shaanxi Provincial Hydrology and Water Resources Bureau. Measured runoff data for the same period were obtained from the Administration of Wei River Basin in Shaanxi Province. The meteorological data (1960–2005) were collected from the China Meteorological Administration (CMA) and included annual precipitation, mean air temperature and evaporation from 21 meteorological stations over the whole of the WRB (, ).
3 Methodology
Three approaches are used in this study: wavelet analysis (WA), the trend-free pre-whitening Mann-Kendall (TFPW-MK) test and detrended fluctuation analysis (DFA). As a useful tool for analysis of the time and frequency properties of various time series, WA is performed in this work for identification of periods in natural and measured runoff time series and for time frequency correlations, which includes continuous wavelet transform (CWT), cross-wavelet, and wavelet coherence methods. The TFPW-MK, as an improvement on the traditional MK test, is employed to detect changes in trends. DFA is used in the detection of long-term persistence and multi-fractality characteristics. Finally, the impact of human activities on the river hydrological regime can be reflected by the differences of periods, trends and long-term persistence between the natural and measured runoff.
3.1 Wavelet analysis
Wavelet analysis, developed from the Fourier transforms, is a method of signal processing with both stationary and non-stationary datasets (Daubechies Citation1988, Meyer Citation1993, Kumar and Foufoula-Georgiou Citation1997). The major advantage over the Fourier method is that WA is scale-independent and no need for a predetermined scale (Kaiser Citation1994). It is more appropriate for hydrological time series due to their wide range of possible dominant frequencies (Daubechies Citation1990, Gaucherel Citation2002, Lafreniere and Sharp Citation2003, Coulibaly and Burn Citation2004, Labat Citation2005, Ren et al. Citation2011), and can investigate detailed temporal patterns from both frequency and time domains through adjusting time and frequency signals.
3.1.1 Continuous wavelet transform
Recently, the WCT based on the Morlet function (Morlet et al. Citation1982, Torrence and Compo Citation1998) has been widely used to identify periodic oscillations of signals (Labat Citation2005, Werner Citation2008). Thus, the Morlet function was chosen as the mother wavelet function to detect local temporal patterns in this study, and is given as (Mallat Citation2009):
where is the Morlet wavelet function; i is the imaginary symbol of a complex number; c is the non-dimensional frequency, here taken to be 6 to satisfy the admissibility condition (Farge Citation1992, Torrence and Compo Citation1998); and t is time.
Assuming that one has a time series, Xn, with t = 0 … n, then the wavelet variance can be calculated by:
where var(a) is wavelet variance; Wn(a,b) is the wavelet transform coefficient and can present the characteristics of the signal change at different timescales; is the complex conjugate of
; a is called a scaling parameter, which measures the degree of compression or scale; and b is the time shift or translation parameter which determines the time location of the wavelet.
By analysing the wavelet coefficients at a scale, we can obtain the dry–wet periodicity of a runoff series at a scale, and further identify all dominant periods at multiple time scales. Moreover, since the wavelet variance is proportional to the duration and squared amplitude of the frequency component, we can also estimate the energy oscillation of the signal with the frequency a by calculating var(a). According to the oscillation graph with scale, we can obtain all the periodic components of the time series by seeking all the maxima of wavelet variance.
3.1.2 Cross-wavelet transform
Cross-wavelet transform was introduced by Torrence and Compo (Citation1998), and integrates continuous wavelet transform and cross-spectrum analysis, which can reveal the correlation in the time and frequency domains of two time series. Given two time series Xn and Yn, with wavelet transform and
, the cross-wavelet spectrum is defined as:
where is the complex conjugate of
. The cross-wavelet spectrum is complex, and hence one can define the cross-wavelet power as
. The phase angle of
describes the phase relationship between X and Y in time–frequency space. Statistical significance is estimated against a red noise model (Torrence and Compo Citation1998).
3.1.3 Wavelet coherence
Wavelet coherence is different from the cross-wavelet transform; it is defined as the square of the cross-spectrum normalized by the individual power spectra, and can measure the intensity of the covariance of the two series in time–frequency space. The coherence is defined as (Torrence and Webster Citation1998, Zhang et al. Citation2007):
where S is a smoothing operator, , where
denotes smoothing along the wavelet scale axis and
denotes smoothing along the time axis, which is given by (Torrence and Webster Citation1998):
where c1 and c2 are normalization constants and ∏ is the rectangle function.
To detect the rationality of the calculation results in this study, the Monte Carlo method is used with a red noise to determine the 95% statistical confidence level of the coherence (Torrence and Webster Citation1998, Jevrejeva et al. Citation2003).
3.2 Trend-free pre-whitening Mann-Kendall test
The MK statistical test has been popularly used to assess the significance of trends in hydrological time series due to its robustness for non-normally distributed and censored data (Mann Citation1945, Kendall Citation1970, Hirsch et al. Citation1982, Zetterqvist Citation1991, Burn and Hag Elnur Citation2002, Abdul Aziz and Burn Citation2006, Hamed Citation2008, Zhang et al. Citation2011). Considering the influence of autocorrelation on the ability to detect trends in hydrological series (Von Storch Citation1999, Douglas et al. Citation2000, Yue et al. 2002, Hamed Citation2009), trend-free pre-whitening (TFPW, Yue et al. Citation2002) was employed before applying the MK test, which can effectively reduce the influence of autocorrelation and avoid the null hypothesis. Briefly, the TFPW procedures are as follows:
where is a new series after TFPW, Xt is the sample series with an average of one,
is the slope (or trend) of the time series being tested using the Theil-Sen approach (Sen Citation1968), r1 is the lag-one serial correlation coefficient of
; if r1 is small,
is an independent series and the MK test is directly applied to it, otherwise it is processed by equations (10) and (11).
In this work, the TFPW-MK is used to detect the significance of trends in annual natural and measured runoff series and to analyse possible impacts of human activities on surface runoff in the mainstream Wei River by comparing the analysis results of annual natural and measured runoff series. In the statistical test, the Z value is calculated as the critical value to denote the positive or negative trend. The significance of the trend is set as 0.05 in this study, and the corresponding Z value is 1.96. It is accordingly defined that Z > 0 denotes a positive trend, and Z > 1.96 indicates that the positive trend is significant and vice versa.
3.3 Detrended fluctuation analysis method
Detrended fluctuation analysis is an approach for analysing the long-term persistence of time series data that can systematically detect non-stationarities and overcome the trend impact in the non-stationary noise sequence at all time scales (Kantelhardt et al. Citation2001). In recent years, this method has become a widely-used technique that is successfully applied to diverse fields such as DNA sequences, heart rate dynamics, neuron spiking, human gait, long weather records, cloud structure, geology, ethnology, economic time series, river runoff record and solid state physics (Hu et al. Citation2001).
In this paper, the DFA method is introduced to detect long-term persistence and multi-fractality of both river runoff series. The calculation steps are as follows: (1) after selecting a time sequence f(t) with length N, the cumulative deviation of the sequence is calculated, and a new sequence f1(t), k = 1, 2, 3, …, N is obtained; (2) f1(t) is divided into M (= N/n) non-overlapping intervals with an average length n, and least-squares data fitting is carried out for M intervals respectively. In this way, the trend equations fen(t) of M intervals are obtained. Then, by filtering the trends corresponding to every interval, we obtain a new time series f´(t) = f1(t)—fen(t); (3) by transforming the interval scale or n value from 2 to the data length t, we can obtain n new time series, respectively, calculate the characteristic fluctuation F(n) of the new time series by equation (12) at different interval scales, and then get different F(n) corresponding to n; (4) a scatterplot of logn and log(F(n)) is built, where the slope of the corresponding linear trend line added is the Hurst index of the DFA method, and the slope is also known as the scale index h.
The Hurst index h is often used to present the long-range-memory (LRM) properties of the time series, where 0.5 < h < 1 indicates the presence of positive long-range power law correlation in the time series, 0 < h < 0.5 shows that the signal has a negative correlation, while h = 0.5 indicates an uncorrelated signal or a signal with a stochastic performance. In addition, if h ≥ 1, it reveals that the time series is correlated but the correlation does not exhibit power-law behaviour (Kantelhardt et al. Citation2001, Koscielny-Bunde et al. Citation2006, Valencia et al. Citation2008). By comparing the Hurst indices of the natural and measured runoff series, the influence of human activities on long-term persistence and multi-fractality can be known, which is very meaningful for exploring the variation of river large-scale hydrological laws in the future.
4 Results
4.1 Time scale characteristics
Flow periodic characteristics at the four stations (Beidao, Linjiacun, Xianyang and Huaxian) from the upstream to the downstream were studied by the CWT. The analysis results showed that the annual natural runoff data of the Wei River present multiple time scale fluctuation characteristics with 7- to 8-year and 20- to 22-year periods. The periodic change maintains a dominant position of wet and dry period alternation of river runoff series, and its multi-scale characteristic makes this alteration more complex. A similar law could have been found by comparing the results from the four stations where the two time periods of 1959–1970 and 1983–1996 are located in the positive phase, as a relatively abundant period, but the time periods of 1971–1982 and 1997–2000 lie in the negative phase, as a relatively dry period ().
Figure 2. Wavelet variance and wavelet coefficient distribution of natural (a), (b) and measured (c), (d) runoff series at Linjiacun hydrological station.
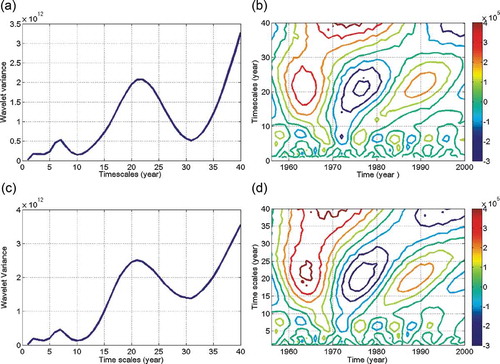
Analysis of the annual measured runoff data indicates that there was no significant difference in oscillation periods between the natural and measured time series (), although the values of the measured runoff series are lower than those of the natural series. As shown in and , it was observed that the multi-timescale characteristics of the Wei River are mainly reflected in the oscillation period and wet and dry season alternation, and human activities do not cause a significant change in the periodic characteristic; that is to say, human activities are not expected to impact on the multi-timescale characteristics of the Wei River.
Table 2. Information on the meteorological stations analysed in this study.
Table 3. Oscillation periods (years) of natural and measured runoff series at four stations.
4.2 Trend characteristics
The autocorrelation function (ACF) was performed before trend analysis using the MK test. The study comprised eight ACF results from four stations under natural and measured conditions ().
Figure 3. ACF results of natural and measured runoff at four stations respectively.
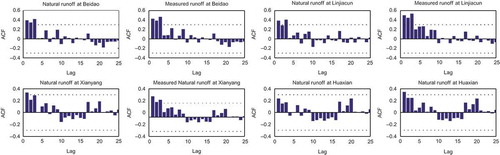
The ACF values in demonstrate that serial correlation is significant, which could increase the probability of the MK test detecting a significant trend (Von Storch Citation1999) and lead to inaccuracy of the MK test. Therefore, the TFPW-MK is very necessary to remove serial correlation from the time series and to assess the significance of trends in flow regimes in the main stream of the Wei River. The result of TFPW-MK is shown in .
Figure 4. Z values of natural and measured annual runoff series at four stations on the main stream of the Wei River. The Z index is a standardized MK statistic to denote the positive (+) or negative (–) trend. The trend significance is distinguished in this study by judging whether the absolute of Z is greater than 1.96 with a 95% statistical confidence level.
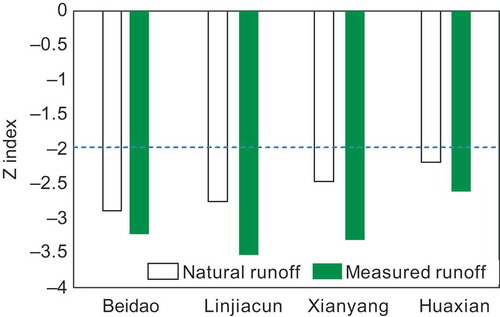
The results in show that the values of these two Z series of natural and measured data are less than zero at every station, which indicates that both are in negative trends. Moreover, these decreasing trends are statistically significant since the absolute values of both Z series are greater than 1.96. It is noteworthy that the aggravation by human activities is considerable and has probably a critical impact on the river eco-system and surrounding plants and animals with sharply-reduced river runoff. By comparing these two results under different conditions, it can be seen that human activities and climate change, as two recognized influences, play important roles in streamflow reduction. Their contributions are further clarified in the following sections.
To study the details of the influence on time scale, the MK test of runoff series was completed for different seasons at four stations (). This result told us that the streamflow reduction is mainly concentrated in the winter in the natural state, while human activities intensify the reduction almost fully in time and space, and this impact is lower in the wet season than in the dry season. From an overall perspective (), the influence of human activities plays a major role in flow recession at these stations. The alteration is primarily focused in the spring and summer in terms of temporal distribution, but occurs mainly at Xianyang and Huaxian stations spatially.
Table 4. Z values in different seasons at stations on the main stream of the Wei River obtained by TFPW-MK test.
4.3 Long-term memory characteristics
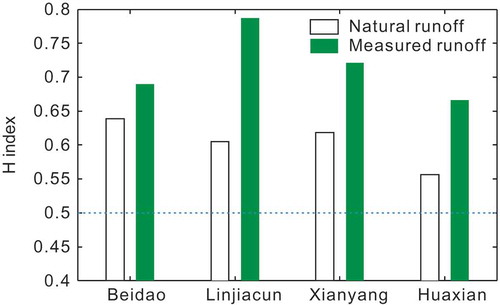
The DFA method is one of the important tools for the analysis of the multi-fractal properties of river flow series. In this study, it was used to estimate the long-range memory or long-term persistence of annual average runoff at the four stations. The result demonstrated that all values of annual average runoff at these stations have shown positive long-range power law correlation, with a weaker persistence and a stronger randomness from upstream to downstream in the natural state (). While the measured data are influenced by human activities, their h indices all increased significantly compared with those for the natural streamflow series. This is a strong indication that these runoff series have a increase on multi-fractal properties or long-term persistence, in contrast their randomness decreases with human disturbance.
Figure 5 Hurst indices of natural and measured annual runoff series at four stations on the main stream of the Wei River. The Hurst index h is used to present the long-range-memory (LRM) properties of the time series. 0.5 < h < 1 indicates the presence of positive long-range power law correlation in the time series. 0 < h < 0.5 shows that the signal has a negative correlation, while h = 0.5 indicates an uncorrelated signal with a stochastic performance. If h ≥ 1, it reveals that the time series is correlated but the correlation does not exhibit power-law behaviour.
By combining these results with the aforementioned conclusions about flow recession obtained by the TFPW-MK test and multi-timescale characteristics obtained by the WA, the following conclusions are drawn: (1) runoff is decreasing over the main stream of the Wei River, and this trend of recession will continue in the future, and all regions drawing from the main Wei River may be in water crisis due to the continuous recession of runoff; (2) human activities have aggravated runoff recession of the Wei River and enhanced its long-term negative persistence; in other words, the river recession will continue in the future under the common influence of its own development rules and human intervention; and (3) it is noteworthy that the multiple time scale characteristics or periodic variations are different from the recession trend, which will continue to occur in this river in the coming decade, and hardly be influenced by human activities.
5 Discussion
5.1 Multi-timescale characteristics
It was found that there are 7- to 8-year and 20- to 22-year oscillations (periods) in the main Wei River (). In order to verify the accuracy of the oscillations, the new periodicity analyses were performed using two other statistical methods: the power spectrum and Hilbert-Huang translation methods. The calculation result is shown in .
Table 5. Runoff periods (years) in the main Wei River determined by the power spectrum and Hilbert-Huang translation methods.
Based on understanding the advantages of different methods to periodicity analysis (Zhao Citation2007), several runoff periods in the main Wei River are selected and confirmed from the above results of the periodicity analysis: 2- to 4-year, 6- to 8-year, 9- to 11-year, and 20- to 22-year. This finding is roughly compatible with the periods of its mother river, the Yellow River (Liu et al. Citation2003, Yang and Li Citation2004), and the adjacent Qin and Fen rivers (Feng et al. Citation2009), as shown in . However, it is regrettable that a period of more than 30 years could not be considered since the analysed runoff data are insufficient.
Table 6. Comparison of runoff periods (years) between the Wei River, the Yellow River and adjacent rivers.
In combination with the wavelet variance changes shown in , it is observed that the 20- to 22-year period is the first one in the above four periods. This is in accordance with the periodicity results obtained by Liu et al. (Citation2003).
5.2 Driving forces of multi-timescale change
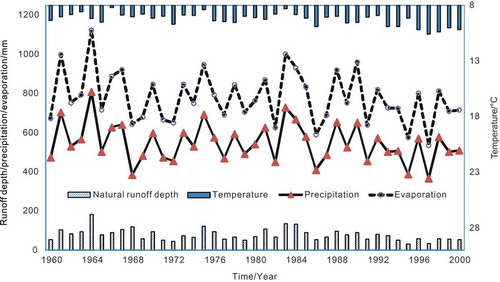
The aforementioned studies indicate that climate change and human activities play different roles in river runoff change at different time scales. It is easily observed from and that human activities are not noteworthy with regard to the period variation or time characteristics of the Wei River runoff. Therefore, the focus in this driving forces section is on the impact of climate change on runoff periodicity. compares the observed precipitation, evaporation and temperature covering the whole Wei River basin and the natural runoff depth at Huaxian station in the period 1960–2000. It shows there are obvious relationships among runoff, precipitation and evaporation in the Wei River basin, with linearity coefficients of association greater than 0.79, but the temperature has no significant effect on runoff and evaporation change. Thus it is seen that runoff change is mainly driven by precipitation and evaporation in the basin.
Figure 6. Observed precipitation, evaporation and temperature covering the whole Wei River basin and the natural runoff depth at Huaxian station during 1960–2000.
To explore the impact of climate change on runoff periodicity further, the period oscillations of meteorological elements such as precipitation, temperature, and evaporation were assessed by the mentioned period identification methods. The periods identified are listed in . Comparing the analysis results of runoff and meteorological elements, it was found that there were significant periodic components corresponding to the relationships between runoff and precipitation, temperature and evaporation, and they matched precipitation especially well. This indicates that the Wei River is a typical river, with precipitation recharge and its runoff regimes having a strong response to climate factors whether under natural or measured condition, which can be proved by the fact that their period variations are the same or similar.
Table 7. Period distribution of precipitation, temperature and evaporation in the WRB.
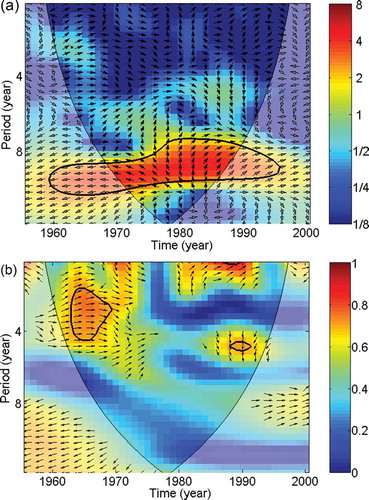
So far, numerous studies have demonstrated that solar activity and global climate change play important roles in abnormal precipitation and drought formation (Hodell et al. Citation2001, Fleitmann et al. Citation2003, Green et al. Citation2007, Stager et al. Citation2007, Mauas et al. Citation2008). With the purpose of further verifying the function of solar activity in natural runoff changes of the main Wei River, this study applied cross-wavelet and wave coherence methods to study the correlation between sunspot numbers and natural river flow fluctuations (). The cross-wavelet spectra result () shows a significant common power or correlation in the 8- to 11-year period. However, the phase changes in these regions with significant wavelet power show ambiguous or complex changing patterns. The wavelet coherence () demonstrates that sunspot numbers have a significant positive correlation on the 2- to 4-year scale with the natural river flow of the Wei River, and a negative correlation on the 8- to 11-year scale lagging behind flow change by 90° (about 3 months). This is consistent with the relevant conclusion regarding the Yellow River in the literature by Li et al. (Citation2009). Furthermore, several previous studies have reported that solar activity has an 11-year oscillation (Beer et al. Citation1988, Foukal and Lean Citation1990, Mursula et al. Citation2001, Gladysheva et al. Citation2002), which is similar to the 9- to 11-year and 20- to 22-year oscillations of the Wei River runoff. These findings raise the possibility that runoff variation is influenced by solar activity to some extent.
Figure 7. (a) Cross-wavelet spectraand (b) wavelet coherence of sunspot numbers and natural river flow fluctuations of the Wei River.
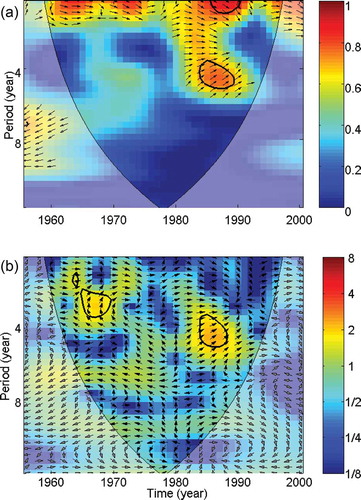
In addition, it is often stated in previous studies that the runoff period variation is strongly correlated with the El Niño phenomenon. And many floods, droughts and other disasters produced by extreme variation in runoff are usually closely related with El Niño (Simpson et al. Citation1993, Dettinger et al. Citation2000). In order to further explore the impact of El Niño on the Wei River runoff, we drew the correlation spectra graph between the MEI index and natural runoff at Huaxian station (). Here, the MEI index is a parameter describing the strength of El Niño, where a larger MEI index shows that the El Niño intensity is higher (Dettinger et al. Citation2000). It can be observed from that the cross-wavelet spectra and wavelet coherence both show a significant common power or correlation on the 2- to 6-year scale, and the phase changes in these regions with significant wavelet power indicate that a positive correlation exists between them, with the MEI index lagging behind flow change by 45° (about 1.5 months). The analysis result echoes the natural river flow fluctuations of 2- to 4-year and 6- to 8-year obtained in the aforementioned study. Thus, one can draw the conclusion that there is a rough response relationship between the Wei River runoff and the El Niño phenomenon.
Figure 8. (a) Cross-wavelet spectra and (b) wavelet coherence of MEI index and natural river flow fluctuations of the Wei River.
5.3 Long-term memory and trend analysis
As shown above and described in Section 4.2, the runoff changes of all river reaches in the whole of the main Wei River show trends of reduction to different extents, and human activities always accelerate this shrinkage of flow.
In terms of spatial distribution (), the four stations in their natural state are showing remarkable reductions in runoff, and the reduction in magnitude gradually decreases along the river channel. This is mainly because some tributaries in the middle and lower stream, with only a small reduction in precipitation, flow into the main Wei River and mitigate the effect of the decrease.
Compared with natural and measured annual runoff series, it is observed that the Z values at Beidao, Linjiacun, Xianyang and Huaxian stations under human impact drop by 12.2, 27.6, 34 and 18.9%, respectively. This indicates that the aggravation by human interference is always affecting the runoff recession of the Wei River. What is more, the aggravation has a gradual rate of growth along the main river as a whole, except for Huaxian. The fall in the Z value at Huaxian station is less than those at the other three stations, chiefly due to the influence of the inflow of the Jing River, as proven by two studies by Ran (Citation1998) and Su et al. (Citation2007), who point out that precipitation reduction contributed 68.2% of the runoff reduction in the Wei River and 10% in the Jing River.
In terms of temporal distribution, the Z values of all seasons in the natural sequence also showed a significant decreasing trend, especially in the winter, but except in spring (). However, under the influence of human activities, the magnitude of the trend of all seasons decreased more significantly, and their average decline ratios were 53, 44, 20 and 39%, respectively, so it can be seen that human activities have a strong influence on the runoff in spring, summer and winter, with the most significant impact occurring in the spring. This more serious change should be attributed to the withdrawal of a lot of river water for the irrigation area along the Wei River during the spring irrigation season. This assumption gained support from the author’s previous work (Zhang et al. Citation2010). From the temporal distribution of Z values at all stations, we found that the maximum and minimum impacts of human activities were both concentrated at Beidao station: the maximum occurred in the spring with a decrease of 87% in Z, while the minimum occurred in winter with a decrease of 4% (). This indicates that excessive withdrawal of river water in the upstream area has a serious impact, which is different from our previous view, and should be paid greater attention due to its further threat on the river eco-system and surrounding plants and animals.
Figure 9. Time distribution of Z value for different series and stations on the Wei River.
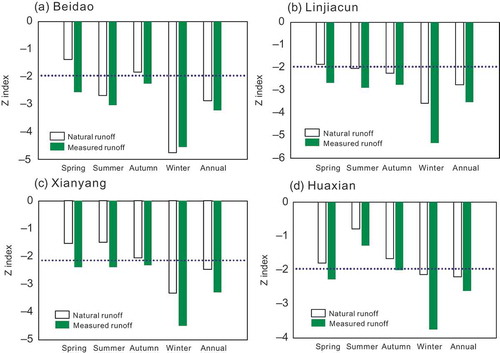
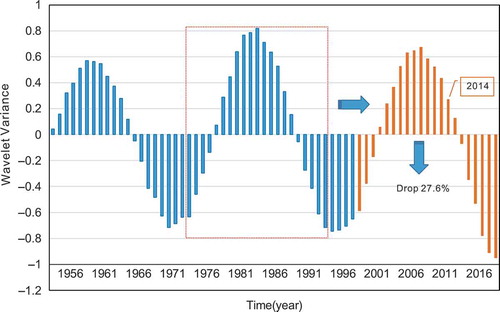
Figure 10. Twenty-one-year main cycles of oscillation of the series at Linjiacun station.
In view of the above DFA analysis (Section 4.3), the conclusion can be drawn that the runoff change of the Wei River is not an entirely random process but a biased stochastic process affected by trend and noise. The features imply that previous events affect present and future ones, and their persistence or positive correlations will continue to be increased by human activities. In combination with the results from the TFPW-MK test and periodicity analysis, two inferences can be obtained:
The Wei River runoff series is characterized by long-term memory, namely the present decreasing trend will continue at least in the coming years. Therefore, the measured runoff would have a more serious damping than is natural in the future, especially in winter.
According to the 21-year main cycles of oscillation of the series (see the oscillation at Linjiacun station in ), we can roughly deduce and predict the oscillation after 2000. The results show that river runoff should be in a dry period during 2016–2025 in the WRB, and will continue to show a decreasing trend until 2020, perhaps rising again after 2021.
6 Conclusions
The hydrological regime of the natural and measured runoff series of the main Wei River has been analysed by WA, TFPW-MK and DFA. Some laws regarding the change and interesting findings about multiple time scales, evolution trends and long-term memory characteristics have been obtained, as follows:
The Wei River runoff has multi-timescale characteristics, with oscillation cycles of 2–4, 6–8, 9–11, and 20–22 years, in which the 20- to 22-year period is the first main period. Periodic variation is mainly driven by climate factors, which mainly match precipitation. The analysis results show that the identified periods of 9–11 and 20–22 years from the Wei River runoff series were perhaps dominated by solar activity, and that the periods of 2–4 and 6–8 years may relate to the El Niño oscillation phenomenon. In addition, the influence of human activities on the time-scale characteristics is smaller. Large time-scale periodic variation is basically stable and not greatly influenced by humans.
The natural runoff series is in a significant shrinking trend in the overall main Wei River and human activities play a critical role in intensifying the reduction trend. In the spatial domain, the human impact is most noteworthy at Xianyang station and in the temporal domain, spring is the most significant season.
The Wei River runoff process shows multi-fractality features and long-term enhanced persistence. This tells us that this recession trend in the main stream of the Wei River will continue in the future. All regions drawing from the main Wei River may be in water crisis due to the continuous recession of runoff. Human activities have aggravated the runoff recession of the Wei River and enhance its long-term persistence. In the future, the river recession will be persistent under the common influence of its own development laws and human intervention. In combination with the 20- to 22-year main oscillation cycle of the Wei River runoff, we estimate that there may be a dry period during 2016–2025, and the trend will show continued reduction until 2020, perhaps rising again after 2021.
Investigations of river hydrological changes and their impacts on society have received considerable attention with regard to regional and global environmental changes in recent years. In this study, we have shed light on the changes in the long-term hydrological regimes and the impacts of human activities in the main Wei River by using analysis methods. However, the quantitative contributions from climate change and human activities were lacking in the paper. So, hydrological models such as the variable infiltration capacity (VIC) model are necessary to identify the relative influences of climate change and human impact on runoff in the WRB in future studies by considering the spatial and temporal scales. Furthermore, through hydrological modelling with general circulation models (GCMs), we can simulate the natural runoff that occurred during the period of human disturbance and future periods, and can further quantify the influence of human activities and runoff trends in the past and future. This will greatly benefit and help in developing future-oriented water-resource management strategies for the WRB.
Acknowledgements
Cordial thanks are extended to two anonymous reviewers and the editors for their valuable comments and suggestions, which greatly improved the quality of this paper.
Disclosure statement
No potential conflict of interest was reported by the authors.
Additional information
Funding
References
- Abdul Aziz, O.I. and Burn, D.H., 2006. Trends and variability in the hydrological regime of the Mackenzie River Basin. Journal of Hydrology, 319 (1–4), 282–294. doi:10.1016/j.jhydrol.2005.06.039
- Arnold Jr, C.L. and Gibbons, C.J., 1996. Impervious surface coverage: the emergence of a key environmental indicator. Journal of the American Planning Association, 62 (2), 243–258. doi:10.1080/01944369608975688
- Beer, J., et al., 1988. Information on past solar activity and geomagnetism from 10Be in the Camp Century ice core. Nature, 331 (6158), 675–679. doi:10.1038/331675a0
- Blazkov, S. and Beven, K., 1997. Flood frequency prediction for data limited catchments in the Czech Republic using a stochastic rainfall model and TOPMODEL. Journal of Hydrology, 195 (1–4), 256–278. doi:10.1016/S0022-1694(96)03238-6
- Burn, D.H. and Hag Elnur, M.A., 2002. Detection of hydrologic trends and variability. Journal of Hydrology, 255 (1–4), 107–122. doi:10.1016/S0022-1694(01)00514-5
- Coulibaly, P. and Burn, D.H., 2004. Wavelet analysis of variability in annual Canadian streamflows. Water Resources Research, 40, W03105. doi:10.1029/2003WR002667
- Daubechies, I., 1988. Orthonormal bases of compactly supported wavelets. Communications on Pure and Applied Mathematics, 41 (7), 909–996. doi:10.1002/cpa.3160410705
- Daubechies, I., 1990. The wavelet transform, time-frequency localization and signal analysis. IEEE Transactions on Information Theory, 36 (5), 961–1005. doi:10.1109/18.57199
- Dettinger, M.D., et al., 2000. Multiscale streamflow variability associated with El Niño/Southern oscillation. Cambridge: Cambridge University Press, 113–147.
- Douglas, E.M., Vogel, R.M., and Kroll, C.N., 2000. Trends in floods and low flows in the United States: impact of spatial correlation. Journal of Hydrology, 240 (1–2), 90–105. doi:10.1016/S0022-1694(00)00336-X
- Du, J. and Shi, C.-X., 2012. Effects of climatic factors and human activities on runoff of the Weihe River in recent decades. Quaternary International, 282, 58–65. doi:10.1016/j.quaint.2012.06.036
- Fan, J., et al., 2013. Detecting abrupt change of streamflow at Lintong Station of Wei River. Mathematical Problems in Engineering, 2013, 976591. doi:10.1155/2013/976591
- Farge, M., 1992. Wavelet transforms and their applications to turbulence. Annual Review of Fluid Mechanics, 24 (1), 395–458. doi:10.1146/annurev.fl.24.010192.002143
- Feng, P., Han, R.P., and Ding, Z.H., 2009. Multiple time-scale SPA analysis on uncertainty relationship between river’s runoff time series. Journal of Basic Science and Engineering, 17 (5), 716–724 (in Chinese).
- Fleitmann, D., et al., 2003. Holocene forcing of the Indian monsoon recorded in a stalagmite from southern Oman. Science, 300, 1737–1740. doi:10.1126/science.1083130
- Foukal, P. and Lean, J., 1990. An empirical model of total solar irradiance variation between 1874 and 1988. Science, 247, 556–558.
- Gao, P., et al., 2013. Impact of climate change and anthropogenic activities on stream flow and sediment discharge in the Wei River basin, China. Hydrology and Earth System Sciences, 17 (3), 961–972. doi:10.5194/hess-17-961-2013
- Gaucherel, C., 2002. Use of wavelet transform for temporal characterisation of remote watersheds. Journal of Hydrology, 269 (3–4), 101–121. doi:10.1016/S0022-1694(02)00212-3
- Gladysheva, O.G., et al., 2002. Nitrate abundance in polar ice during the great solar activity minimum. Advances in Space Research, 29 (11), 1707–1711. doi:10.1016/S0273-1177(02)00114-X
- Green, T.R., Taniguchi, M., and Kooi, H., 2007. Potential impacts of climate change and human activity on subsurface water resources. Vadose Zone Journal, 6 (3), 531–532. doi:10.2136/vzj2007.0098
- Guo, H., Hu, Q., and Jiang, T., 2008. Annual and seasonal streamflow responses to climate and land-cover changes in the Poyang Lake basin, China. Journal of Hydrology, 355 (1–4), 106–122. doi:10.1016/j.jhydrol.2008.03.020
- Guo, Y. and Li, Z., 2012. Impact of human activities on hydrological series of the Wei River. In: Deng, ed. New developments of hydrological science and technology. Nanjing: Hohai University Press, 198–201 (in Chinese).
- Hamed, K.H., 2008. Trend detection in hydrologic data: the Mann–Kendall trend test under the scaling hypothesis. Journal of Hydrology, 349 (3–4), 350–363. doi:10.1016/j.jhydrol.2007.11.009
- Hamed, K.H., 2009. Enhancing the effectiveness of prewhitening in trend analysis of hydrologic data. Journal of Hydrology, 368 (1–4), 143–155. doi:10.1016/j.jhydrol.2009.01.040
- Hirsch, R.M., Slack, J.R., and Smith, R.A., 1982. Techniques of trend analysis for monthly water quality data. Water Resources Research, 18 (1), 107–121. doi:10.1029/WR018i001p00107
- Hodell, D.A., Charles, C.D., and Sierro, F.J., 2001. Late Pleistocene evolution of the ocean’s carbonate system. Earth and Planetary Science Letters, 192, 109–124. doi:10.1016/S0012-821X(01)00430-7
- Hu, K., et al., 2001. Effect of trends on detrended fluctuation analysis. Physical Review E, 64 (1), 011114. doi:10.1103/PhysRevE.64.011114
- Jevrejeva, S., Moore, J.C., and Grinsted, A., 2003. Influence of the Arctic Oscillation and El Niño–Southern Oscillation (ENSO) on i25ce conditions in the Baltic Sea: the wavelet approach. Journal of Geophysical Research: Atmospheres (1984–2012), 108 (D21). doi:10.1029/2003JD003417
- Jones, P.D., et al., 2006. Global and hemispheric temperature anomalies – land and marine instrumental records. In: Trends: a compendium of data on global change. Oak Ridge, TN: Carbon Dioxide Information Analysis Center, Oak Ridge National Laboratory, U.S. Department of Energy, 603–608. doi:10.3334/CDIAC/cli.002
- Kaiser, G., 1994. A friendly guide to wavelets. Boston, MA: Birkhauser.
- Kantelhardt, J.W., et al., 2001. Detecting long-range correlations with detrended fluctuation analysis. Physica A: Statistical Mechanics and its Applications, 295 (3–4), 441–454. doi:10.1016/S0378-4371(01)00144-3
- Kantelhardt, J.W., et al., 2003. Multifractality of river runoff and precipitation: comparison of fluctuation analysis and wavelet methods. Physica A: Statistical Mechanics and its Applications, 330 (1–2), 240–245. doi:10.1016/j.physa.2003.08.019
- Kendall, M.G., 1970. Rank correlation methods. 2nd ed. New York, NY: Hafner.
- Koscielny-Bunde, E., et al., 2006. Long-term persistence and multifractality of river runoff records: Detrended fluctuation studies. Journal of Hydrology, 322 (1–4), 120–137. doi:10.1016/j.jhydrol.2005.03.004
- Kumar, P. and Foufoula-Georgiou, E., 1997. Wavelet analysis for geophysical applications. Reviews of Geophysics, 35 (4), 385–412. doi:10.1029/97RG00427
- Labat, D., 2005. Recent advances in wavelet analyses: Part 1. A review of concepts. Journal of Hydrology, 314 (1–4), 275–288. doi:10.1016/j.jhydrol.2005.04.003
- Lafreniere, M. and Sharp, M., 2003. Wavelet analysis of inter-annual variability in the runoff regimes of glacial and nival stream catchments, Bow Lake, Alberta. Hydrological Processes, 17 (6), 1093–1118. doi:10.1002/hyp.1187
- Laio, F., et al., 2001. Plants in water-controlled ecosystems: active role in hydrologic processes and response to water stress: II. Probabilistic soil moisture dynamics. Advances in Water Resources, 24 (7), 707–723. doi:10.1016/S0309-1708(01)00005-7
- Li, C.H., et al., 2009. Identification of relationship between sunspots and natural runoff in the Yellow River based on discrete wavelet analysis. Expert Systems with Applications, 36 (2), 3309–3318. doi:10.1016/j.eswa.2008.01.083
- Lima, C.H. and Lall, U., 2010. Spatial scaling in a changing climate: A hierarchical Bayesian model for non-stationary multi-site annual maximum and monthly streamflow. Journal of Hydrology, 383 (3–4), 307–318. doi:10.1016/j.jhydrol.2009.12.045
- Lin, M., et al., 2013. Nonsmooth dynamic behaviors inherited from an ecohydrological model: mutation, bifurcation, and chaos. Mathematical Problems in Engineering, 2013, 1–9. doi:10.1155/2013/731042
- Liu, J.P., Tian, F.W., and Huang, Q., 2003. A multiple time scales analysis of the runoff variation along the upper reaches of the Yellow River. Journal of Applied Sciences, 21 (2), 117–121.
- Liu, Y. and Hu, A.Y., 2006. Changes of precipitation characters along Weihe basin in 50 years and its influence on water resources. Journal of Arid Land Resources and Environment, 20 (1), 85–87 (in Chinese).
- Ma, S.-M., Xu, H., and Ham, B.S., 2009. Electromagnetically-induced transparency and slow light in GaAs/AlGaAs multiple quantum wells in a transient regime. Optics Express, 17 (17), 14902–14908. doi:10.1364/OE.17.014902
- Mallat, S., 2009. A wavelet tour of signal processing: the sparse way. Amsterdam, Boston: Elsevier/Academic Press.
- Mann, H.B., 1945. Nonparametric tests against trend. Econometrica, 13, 245–259. doi:10.2307/1907187
- Mauas, P.J., Flamenco, E., and Buccino, A.P., 2008. Solar forcing of the stream flow of a continental scale South American river. Physical Review Letters, 101 (16), 168501. doi:10.1103/PhysRevLett.101.168501
- Meyer, Y., 1993. Wavelets-algorithms and applications. Wavelets-algorithms and applications. Society for Industrial and Applied Mathematics Translation, 1, 142.
- Mimikou, M.A., Kanellopoulou, S.P., and Baltas, E.A., 1999. Human implication of changes in the hydrological regime due to climate change in Northern Greece. Global Environmental Change, 9 (2), 139–156. doi:10.1016/S0959-3780(98)00034-X
- Morlet, J., et al., 1982. Wave propagation and sampling theory – Part I: Complex signal and scattering in multilayered media. Geophysics, 47 (2), 203–221. doi:10.1190/1.1441328
- Mursula, K., Usoskin, I.G., and Kovaltsov, G.A., 2001. Persistent 22-year cycle in sunspot activity: Evidence for a relic solar magnetic field. Solar Physics, 198 (1), 51–56. doi:10.1023/A:1005218414790
- Ran, D.C., 1998. The analysis on the Jinghe River runoff under the influence of human action. Water Resources and Water Engineering, 9 (1), 32–36 (in Chinese).
- Ren, L., Xiang, X.Y., and Ni, J.J., 2011. Forecast modeling of monthly runoff with adaptive neural fuzzy inference system and wavelet analysis. Journal of Hydrologic Engineering, 1, 343.
- Sen, P.K., 1968. Estimates of the regression coefficient based on Kendall’s tau. Journal of the American Statistical Association, 63 (324), 1379–1389. doi:10.1080/01621459.1968.10480934
- Simpson, H.J., et al., 1993. Annual river discharge in southeastern Australia related to El Nino-Southern Oscillation forecasts of sea surface temperatures. Water Resources Research, 29 (11), 3671–3680. doi:10.1029/93WR01492
- Stager, J.C., et al., 2007. Sunspots, El Niño, and the levels of Lake Victoria, East Africa. Journal of Geophysical Research: Atmospheres, 112 (D15). doi:10.1029/2006JD008362
- Su, X.L., Kang, S.Z., and Wei, X.M., 2007. Impact of climate change and human activity on the runoff of Wei River basin to the Yellow River. Journal of Northwest A & F University (Natural Science Edition), 35 (2), 153–159 (in Chinese).
- Sun, Y., et al., 2014. Exploring the spatial variability of contributions from climate variation and change in catchment properties to streamflow decrease in a mesoscale basin by three different methods. Journal of Hydrology, 508, 170–180. doi:10.1016/j.jhydrol.2013.11.004
- Torrence, C. and Compo, G.P., 1998. A practical guide to wavelet analysis. Bulletin of the American Meteorological Society, 79 (1), 61–78. doi:10.1175/1520-0477(1998)079<0061:APGTWA>2.0.CO;2
- Torrence, C. and Webster, P.J., 1998. The annual cycle of persistence in the El Niño/ Southern Oscillation. Quarterly Journal of the Royal Meteorological Society, 124 (550), 1985–2004.
- Valencia, M., et al., 2008. Influence of filters in the detrended fluctuation analysis of digital electroencephalographic data. Journal of Neuroscience Methods, 170 (2), 310–316. doi:10.1016/j.jneumeth.2008.01.010
- Vogel, R.M., Wilson, I., and Daly, C., 1999. Regional regression models of annual streamflow for the United States. Journal of Irrigation and Drainage Engineering, 125 (3), 148–157. doi:10.1061/(ASCE)0733-9437(1999)125:3(148)
- Von Storch, H., 1999. Misuses of statistical analysis in climate research. Berlin Heidelberg: Springer, 11–26.
- Wang, W., et al., 2004. Research on the conversion relationships between the river and groundwater in the Yellow River drainage area. Science in China Series E – Engineering and Materials Sciences, 14 (1), 25–41. doi:10.1360/04ez0003
- Weiskel, P.K., et al., 2007. Water use regimes: Characterizing direct human interaction with hydrologic systems. Water Resources Research, 43 (4), W04402. doi:10.1029/2006WR005062
- Werner, R., 2008. The latitudinal ozone variability study using wavelet analysis. Journal of Atmospheric and Solar-Terrestrial Physics, 70 (2–4), 261–267. doi:10.1016/j.jastp.2007.08.022
- Wu, W., Xu, Z.X., and Liu, X.C., 2012. Impact of Baojixia water diversion works on the hydrologic regime in the Wei River basin. Procedia Environmental Sciences, 13, 1653–1662. doi:10.1016/j.proenv.2012.01.158
- Xu, C.-Y. and Singh, V.P., 2004. Review on regional water resources assessment models under stationary and changing climate. Water Resources Management, 18 (6), 591–612. doi:10.1007/s11269-004-9130-0
- Yang, C., et al., 2010. Analysis and simulation of human activity impact on streamflow in the Huaihe River basin with a large-scale hydrologic model. Journal of Hydrometeorology, 11 (3), 810–821. doi:10.1175/2009JHM1145.1
- Yang, Z.F. and Li, H., 2004. Abrupt and periodic changes of the annual natural runoff in the sub regions of the Yellow River. Journal of Mountain Science, 22 (2), 140–146.
- Yevjevich, V., 1972. Probability and Statistics in Hydrology. Fort Collins, CO: Water Resources Publications, 302.
- Yue, S., et al., 2002. The influence of autocorrelation on the ability to detect trend in hydrological series. Hydrological Processes, 16 (9), 1807–1829. doi:10.1002/hyp.1095
- Zetterqvist, L., 1991. Statistical estimation and interpretation of trends in water quality time series. Water Resources Research, 27 (7), 1637–1648. doi:10.1029/91WR00478
- Zhan, C., Zhang, Y., and Xia, J., 2012. Hydrologic response to climate variability and human activities in the Chao River catchment near Beijing. Water International, 37 (5), 585–597. doi:10.1080/02508060.2012.692176
- Zhang, H.B., et al., 2010. Influence of drawing water to Baojixia irrigation area on hydrologic regularity and ecosystem of Weihe River. Journal of Northwest A & F University (Natural Science Edition), 38 (4), 226–234 (in Chinese).
- Zhang, Q., et al., 2011. Spatio-temporal patterns of hydrological processes and their responses to human activities in the Poyang Lake basin, China. Hydrological Sciences Journal, 56 (2), 305–318. doi:10.1080/02626667.2011.553615
- Zhang, Q., et al., 2007. Possible influence of ENSO on annual maximum streamflow of the Yangtze River, China. Journal of Hydrology, 333 (2–4), 265–274. doi:10.1016/j.jhydrol.2006.08.010
- Zhang, X.C., Kuang, J., and Jing, Y., 2003. Preliminary analysis on runoff sharp drop of the Wei River into the Yellow River in the 1990s. Hydrology, 23 (3), 43–45 (in Chinese).
- Zhao, H., 2003. Evaluation of water quality and countermeasures of pollution prevention for the Wei River. Northwest Water Resource and Water Engineering, 14 (1), 28–31 (in Chinese).
- Zhao, L.P. 2007. Study of analysis methods for the period of hydrological time series. Thesis (Masters). Hohai University, Nanjing, Jiangsu, China (in Chinese).