
ABSTRACT
We investigated the isotopic composition of the Urumqi River and documented seasonal variability attributable to the mixing of various flow sources. Next, we applied these isotopic signals to partition the sources and studied their temporal variability in summer. The isotope hydrology separation results indicated that groundwater is the dominant streamflow source (approximately 62.7%) in the Urumqi River. Precipitation is an important source for the Urumqi River; approximately 19.1–20.7% of the runoff came from precipitation during summer and early autumn. In summer, approximately 21.1% of the runoff is derived from glacial meltwater. In summer, with the increasing distance to the glacier front, groundwater accounts for a larger and larger percentage of the river water, and the contributions of precipitation and glacial meltwater gradually diminish. Throughout 2012, the proportions of precipitation and glacial meltwater in the streamflow were 17.6% and 14.7%, respectively, and only 5% of the streamflow was derived from snowmelt.
Editor Z. W. Kundzewicz; Associate editor not assigned
1 Introduction
Chronic water shortages and low usage efficiency make China’s troubled water resource issues an ongoing challenge, and the loss of glaciers accompanied by climate change in the western arid region only serve to compound this problem. Many experts suggest that global climate change is caused by growing atmospheric concentrations of carbon and other trace gases (IPCC Citation2007). In arid areas, rising temperatures lead to the increase of ice meltwater and precipitation, resulting in increases in the discharges of headstreams from mountain areas. Flood control and agricultural water are strongly related to the changes in discharge caused by climate change. Some studies indicate that there is not yet a clear assessment of the effects of climate change on water resources and agriculture in China (Piao et al. Citation2010, Kong and Pang Citation2012).
Excluding the Antarctic, arid regions comprise nearly 20% of the world’s land area. The formation of arid zones is mainly attributed to the scarcity of water resources. Ecosystems and societies are vulnerable to environmental changes, particularly hydrological changes. Global warming will inevitably increase the volume of glacial and snowmelt water and mountain discharge, which are the main water resources available in arid regions. The sensitivity of glacial rivers to climate change has significant implications for water resource management and flood control. Hence, assessing the magnitude and variability in the response of a water system to climate change is critically important.
Due to their ability to elucidate the underlying processes that control the chemical and physical behaviours of elements and compounds in the natural environment, stable- and radio-isotope tracers have been widely applied in the study of Earth systems, including in hydrological and climatological research. Isotope fractionation produces a natural labelling effect within the global water cycle that has been applied to study a wide range of hydrological and climatic processes on local, regional and global scales. The use of stable oxygen and hydrogen isotopes as tracers in hydrological studies has expanded over the past five decades following the initial description of systematic variations in world precipitation (Craig Citation1961, Dansgaard Citation1964), the development of a theory describing isotopic fractionation during evaporation (Craig and Gordon Citation1965), and the testing and validation under a range of field conditions (Fritz and Fontes Citation1980, Gat and Gonfiantini Citation1981, Gat Citation1996, Kendall et al. Citation1999, Gibson and Prowse Citation2002).
Hydrograph separation methods include graphical, time-interval, and filtering methods along with hydrological and water balance models in which time-interval separation methods are compiled in a program called HYSEP (Nathan and McMahon Citation1990, Arnold and Allen Citation1999, Kong and Pang Citation2010). In the 1950s, isotopic techniques were first applied to the field of water cycle research, proving to be both effective and convenient. These techniques played an important role in the qualitative and quantitative study of groundwater age, groundwater renewal ability, recharge elevation, and mixing ratio. Isotope hydrograph separation was first applied in the 1970s to define the baseflow component of total runoff. It has seen great improvements from the 1990s to the present. Burn (Citation2002) reviewed the development of isotope hydrology separation and noted that this method should be combined with new cutting-edge methods and an improved database so that it can be used to study hydrological processes with different climatic and human disturbance regimes. Qu et al. (2008) reviewed the study of isotope hydrology separation in China, highlighting the importance of sampling in isotope hydrology separation. Kong and Pang (Citation2010) investigated the progress in isotope hydrology separation for alpine catchments with an emphasis on its significance in reflecting the impact of global change on water resources and explained the principle of isotope hydrology separation and its uncertainties.
As stream water is an important water supply for Urumqi city, the provincial capital city of the Xinjiang Uyghur Autonomous Region, streamflow characteristics and changes have drawn considerable attention. Previous studies on glaciers have focused on mass balance and runoff changes (Ye et al. 2005, Li et al. Citation2010). Using isotope hydrology separation, Kong and Pang (Citation2012) studied the streamflow component of the Urumqi River based on events at a monthly scale. However, studies on long-term runoff generation and mechanisms are scarce, especially in the Urumqi River basin. Understanding the time series of streamflow components using natural tracers in arid alpine cold streams is essential for water resource management, water-quality studies, and the evaluation of the effects of climate change. For these reasons, hydrograph separation analysis was conducted in the Urumqi River basin in 2012 to identify the water sources. We attempted to: (1) determine the contributions of different water sources to streamflow during this year; and (2) evaluate the sensitivity of the Urumqi River to climate change. The results are expected to help elucidate water resources and their management in the study region.
2 Data and methods
2.1 Study area
This study was conducted in the Urumqi River catchments in eastern Tianshan, Xinjiang Uyghur Autonomous Region, which coves one-sixth of China’s land area. Xinjiang has a typical continental arid climate, with an average ambient temperature of 9–12°C, sporadic precipitation, and water pooling occurring mostly in the mountainous areas.
The Urumqi River basin in Tianshan, China, was selected as the test site. The watershed of this basin (between 86°45′–87°56′E, 43°00′–44°07′N) is located in the middle portion of the northern flank of the Tianshan Mountains, about 175 km from Urumqi city, the capital city of the Xinjiang Uyghur Autonomous Region (). The basin is more than 200 km long from north to south, and 25–50 km wide from east to west. The total area of the basin is about 4684 km2 and some of the mountain watershed is covered with glaciers. The watershed is bordered by three deserts: the Taklimakan to the south, the Junggar Basin to the north, and the Gobi Desert to the east. Urumqi Glacier No.1, a northeast-facing valley glacier, is the largest glacier. The annual precipitation in the headwater regions can reach about 400–500 mm, and the annual average temperature in the basin is about 4°C. Houxia (a city of population of 20 000), which has two coal-fired power-generating plants, a coal-powered cement factory and various other factories, lies 82.6 km southwest of Urumqi city.
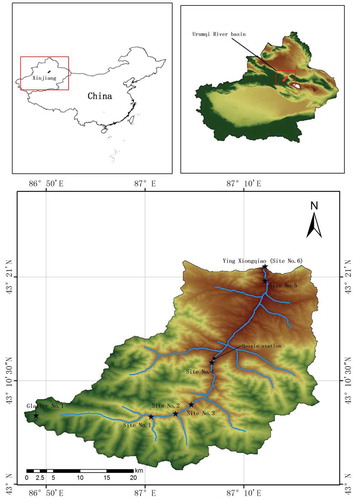
Figure 1. Location map of the Urumqi River Basin and water-sampling locations referred to in this paper. Black star represents the sampling points.
This paper focuses on the area above the Ying Xiongqiao hydrometric station. The station is situated at an elevation of 1904 m and controls a drainage area of 924 km2. Average annual precipitation is 526 mm. The average annual discharge since 1958 is 7.02 m3 s-1, with an annual discharge depth of 240 mm. The drainage basin includes 124 glaciers, with a combined area of 38 km2, or 4.1% of the drainage area. The forest zone extends from 1500 to 2900 m and is dominated by Betula and Picea species. The alpine zone above 2900 m consists of mountain meadow communities, bare rock, and glacial deposits. The permanent snowline is approximately 4000 m and the lower limit of permafrost is 3000 m (Fengjing et al. Citation1995).
2.2 Data collection
Precipitation (including snow and rain) samples and river samples were collected at Houxia Station (87°06.774′E, 43°12.319′N; altitude: 2145 m a.s.l.) in 2012. The precipitation was sampled (by event) from January 2012 to December 2012. Liquid samples were collected immediately after the end of rainfall and sealed in a plastic bottle; solid precipitation (snow) samples were collected and melted thoroughly at room temperature in a plastic bag before being sealed in a plastic bottle. In order to describe the change of the water isotope clearly, we collected a river water sample almost every 5 days for the entire year. In total, 70 samples of river water and 26 samples of precipitation were collected at the Houxia station.
Four sampling campaigns were undertaken in the study area on 9 March, 5 July, 29 August and 15 October 2012. About 24 samples were collected from six sites distributed along the Urumqi River basin in order to study the isotopic characteristics in different temporal and spatial domains.
It is challenging to find suitable wells for groundwater sampling in the mountainous watersheds. Along the Urumqi River, four groundwater samples were collected from one well (87°07.1′E, 43°12.9′N; altitude: 2122 m a.s.l.) during different seasons. Seven glacier meltwater samples were collected at the tongue of Glacier No. 1 of the Urumqi River (86°48.981′E, 43°06.966′N; altitude: 3743 m a.s.l.) during different seasons of 2012. Before sampling the glacier, we firstly removed the surface snow and then collected the ice in the lower part. Two snowmelt water samples were collected at the site No. 1 during 9 March and 15 October. One sample of river ice was collected at site No. 1 on 9 March.
Meanwhile, the corresponding parameters, such as amount of the precipitation, air temperature and humidity were also measured at the meteorological stations during sample collection. Before sampling, we washed the 5-mL plastic sample vial three times using the sampled water, and then filled it with the water sample. Each vial was sealed immediately with Parafilm to prevent evaporation. All samples were immediately sealed in plastic bottles after collection and stored in the laboratory at below −18°C. When the samples were analysed, they were stored at 4°C in the refrigerator to melt gradually to avoid evaporation.
2.3 Methods
2.3.1 Stable isotope and chemical analysis
The δ18O and δD values for the river water samples and precipitation samples were measured at the State Key Laboratory of Desert and Oasis Ecology, Xinjiang Institute of Ecology and Geography, Chinese Academy of Sciences. All samples were measured in 2012 using the Liquid Water Isotope analyzer (LGR DLT-100, California, USA). The precision was ±0.1‰ and ±0.8‰ for δ18O and δD, respectively (Lis et al. Citation2008). Results were reported as relative to the standard V-SMOW (Vienna-Standard Mean Ocean Water). To avoid the memory effect associated with continuous-flow methods, measurements of each sample were repeated six times, and the first two values were discarded. The measured data used the LWIA Post software for data analysis. This software determines the values of δ18O and δD by calculating the differences between the known and measured values for standard water samples. By applying these corrections, extremely accurate measurements of the isotopic ratios can be achieved.
A 500-mL bottle was filled with river water to determine the major ions (Ca2+, Mg2+, Na+, K+, Cl-, SO42- and CO3 -), and related chemical analyses were carried out in the same laboratory. Water samples were filtered through a 0.45-μm millipore membrane, using a high-performance liquid chromatography (HPLC) method with a dual-column instrument (model Dionex CD20) that has an analytical error of less than 1 mg/L. The water temperature, pH and electrical conductivity (EC), together with total alkalinity values of all water samples, were measured in the field during sampling.
2.3.2 Hydrograph separation
We used two- and three-component isotope hydrograph separation (Clark and Fritz Citation1997, Kong and Pang Citation2012, Sun et al. Citation2014) to determine the contributions of various recharge sources to the Urumqi River. Both the two- and three-component methods can be described by the following uniform equation:
where Q is total runoff discharge, Qm is the discharge of component m, and Cmb is the tracer b incorporated into the component m. In isotope hydrograph separation, one of the tracers should be an isotope. Several assumptions are required for this model (Sklash and Farvolden Citation1979, Turner and Macpherson Citation1990):
Cmb should be constant during the calculation period such as a rainfall–runoff process or snowmelt–runoff process;
Cmb should be different between each component; and
a steady-state model adequately represents watershed conditions.
To meet these assumptions, various environmental tracers such as 18O, D and d-excess were used, and geochemical data including TDS (total dissolved solids), EC and even DOC (dissolved organic carbon) and temperature were employed (Gibson et al. Citation2005, Kong and Pang Citation2010, Citation2012). In this study, we chose TDS and δ18O as tracers due to their significant differences among recharge sources.
The mean contributions of several water sources in the Urumqi River during different seasons were estimated using the above hydrograph separation analysis method.
2.3.3 Uncertainty analysis
Analytical error may cause uncertainty in the estimated contributions of different runoff components due to measurement errors in end-member concentrations. Likewise, the spatial and temporal variations in the component tracers may result in significant uncertainty in the hydrograph separations. These uncertainties should be evaluated separately as follows (Pu et al. Citation2013):
where W represents the uncertainty in the variable specified by the subscript, R1, R2 and Rn refer to components 1 and 2 and n, respectively.
The calculation of uncertainty in hydrograph separations requires tracer concentrations and an estimate of the uncertainty in each tracer. The substitution of equation (5) in equation (2) gives the uncertainty for two-component separations:
where C is tracer concentration; C1, C2 and Cs represent the 18O concentrations of the groundwater, meltwater and streamflow, respectively.
3 Analysis and results
3.1 Climate and discharge characteristics
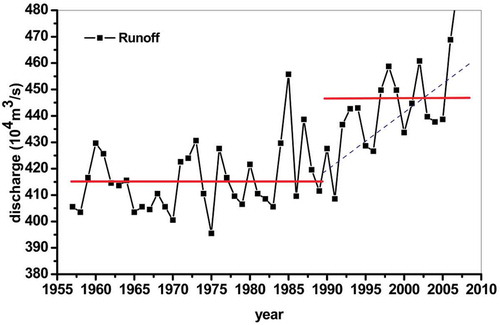
Understanding the regional climate characteristics is essential for the study of hydrological processes. Over the past 60 years, the annual mean temperature of Urumqi city increased from 6.41 to 7.39°C, and annual precipitation increased from 246.52 to 302.36 mm (). The result of the Mann-Kendall test indicates a significant increasing tendency in runoff of the Urumqi River at the 95% level of confidence. The trends in meteorological and hydrological variables are consistent with the results of previous studies (Ye et al. Citation2005, Chen et al. Citation2006, Citation2007, Li et al. Citation2010, Xu et al. Citation2010, Kong and Pang Citation2013). Climate change has resulted in streamflow changes in the Urumqi River basin. Runoff in the basin shows a significant monotonic increasing trend. Xu et al. (Citation2010) analysed eight representative rivers in Xinjiang and concluded that the discharge of most rivers increased significantly since 1990, although the magnitudes were different. A stepwise increase in Urumqi runoff occurred in approximately 1991; illustrates that the annual discharge of the Urumqi River increased from 4.156 to 4.47 × 10⁶ m3—an increase of approximately 10.0% from 1991 to 2010.
Figure 2. (a) The trends of the average annual air temperature in the Urumqi, (b) the trends of the average annual precipitation in the Urumqi from 1951 to 2010.
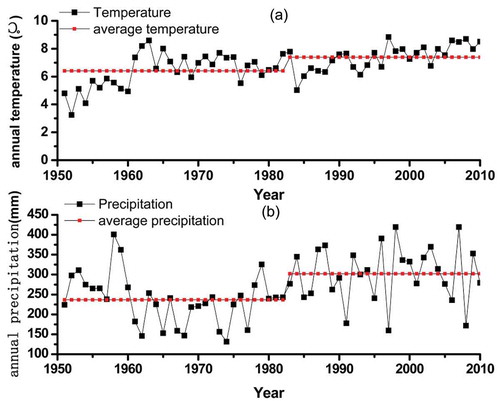
Figure 3. The trend of discharge in the Ying xiongqiao station of Urumqi River from 1957 to 2007.
3.2 Characteristics of water chemistry and isotopes
3.2.1 Water chemistry
The concentrations of the major dissolved solutes in precipitation ranged from 40 to 80 mg/L; this range is smaller than that for river water. The TDS of river water has a larger range (125–304 mg/L), while meltwater exhibits stable concentrations of major dissolved solutes.
The lowest concentration of TDS (125 mg/L) occurred at site No. 1. A higher concentration was found at site No. 3, followed by a decrease to 223.1 mg/L at site No. 4. The increasing trend is apparent from sites 4–6. The pH values for all water samples range from 6 to 8.5, indicating that the waters have slightly alkaline characteristics. In most cases, the fluctuations in pH are relatively small (approximately 7.5 ± 0.5), with the exception of the samples taken at site No. 1 in the spring (pH 8.8–9.6). The temporal evolutions of the EC values and TDS concentrations are identical, with relatively small fluctuations in downstream stations (sites 5–6) and more pronounced variations at upper stations sites (sites 1–2).
The hydrochemical streamflow characteristics are affected by various factors such as precipitation, glacial melting, snow melting, permafrost active layer, moraine components and talus–soil–water interactions (Wang Citation2014). The results show that HCO3- is the major anion in the river water, while Ca2+ is the major cation, indicating that rock–soil–water interactions play a key role in the hydrochemical processes (Sun et al. Citation2015). The general trend observed in the solute anion contents of river water samples is as follows: HCO3- > SO42- > Cl- > CO32-. The general trend in solute cation content is: Ca2+ > Mg2+ > Na+ > K+. These trends are similar to those of groundwater, indicating that the groundwater is the main water source of the Urumqi River.
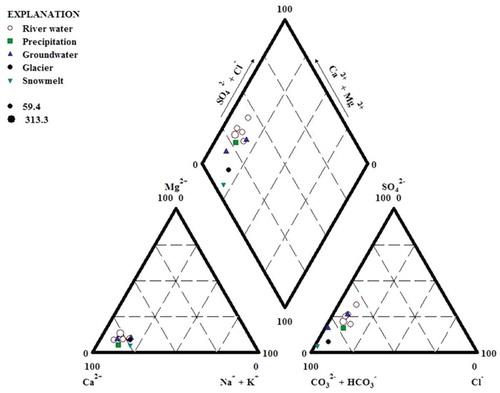
Ionic deltas, ionic ratios and saturation indices were used in an attempt to identify the hydrogeochemical processes of the Urumqi River. The Piper diagram () illustrates that river water, meltwater (including snowmelt and glacier melt) and groundwater have the same water type (Ca-HCO3). shows that the chemical character of river water is similar to those of both precipitation and groundwater, indicating that precipitation and groundwater are important sources for the Urumqi River.
Figure 4. Piper diagram of surface water, precipitation, meltwater and groundwater water along Urumqi River.
3.2.2 Water stable isotopes
During the monitoring period, δ18O values in rainwater varied between −36.2 and 0‰ (), and temporal variations in rainwater δ18O were observed. The value was especially high in June and July, indicating that the δ18O value of precipitation is correlated with temperature change. The average δ18O value of precipitation was −21.2 and −6.8‰ in spring and summer, respectively.
Figure 5. The plot of the seasonal variation in δ18O for glacier melt and precipitation of Houxia station in 2012.
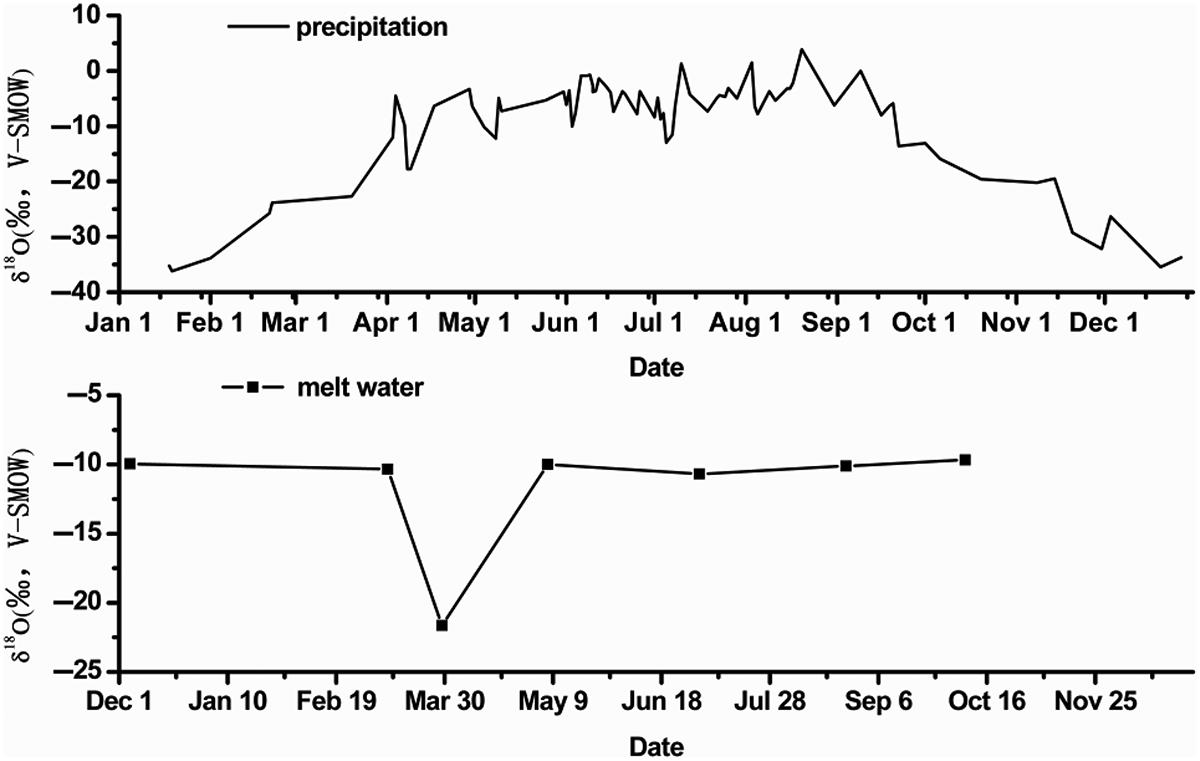
The isotope values of glacial meltwater ranged between −9.4 and −10.1‰ in δ18O and between −58.7 and −63.8‰ in δD, suggesting a stable isotope signature for glacial meltwater (). The overall isotope composition of Urumqi River stream water ranged between −10.5 and −7.3‰ in δ18O, and between −67.5 and −44‰ in δD. The isotope peak was observed in March, while the lowest point was in summer (May–August; ).
Table 1. Mean hydrochemical data of different surface-water samples collected from the Urumqi River in 2012.
Table 2. Mean isotopic composition of different water samples collected from the Urumqi River in 2012.
Figure 6. Annual variations of δ18O and δD in river water in 2012 at Houxia station on the Urumqi River.
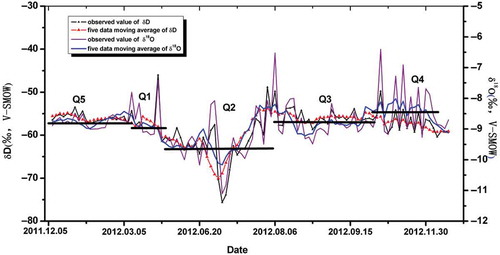
illustrates the spatial variations in average δ18O, δD and d-excess values at different sites along the Urumqi River in 2012. A decreasing trend is observed from site No. 1 to site No. 3. Moreover, as the river flows from site No. 3 to site No. 6, significant increases in isotopic compositions (≈ 0.3‰ and ≈ 1.3‰ for δ18O and δD, respectively) were observed. The lowest average isotopic composition was observed in site No. 3.
Obvious seasonal variations were found in the δ18O value of river water, with a minimum peak (–10.5‰) in June or July and a maximum peak (–7.3 to −8.0‰) in March or April. The δ18O of river water shows an increasing trend in autumn, while it remained almost constant during the river’s freezing period. The decrease in the δ18O of river water in June and July corresponds to increased discharge due to the runoff of glacial meltwater and alpine precipitation. Glacial meltwater of the Urumqi River has an extremely lower δ18O value (Glacier No. 1 is −9.8‰; ). Snowfall and rainfall δ18O values in the upstream area are also low due to the high altitude (Pang et al. Citation2011). Thus, the glacial meltwater with low δ18O could decrease the δ18O in river water. The increasing trend in the δ18O of river water during autumn is attributed to the recession of glacial meltwater, while the runoff derived from autumn precipitation with high δ18O values increases. The maximum δ18O value in river water observed in March is primarily due to river ice and frozen ground meltwater (δ18O = −7.3‰). In the spring, the isotopic concentration at site No. 1 was significantly higher than those of the other sampling sites, while all sites showed similar isotopic concentrations in the autumn. This demonstrated that the Urumqi River has different streamflow components in different seasons. In autumn, groundwater is the main water source, leading to the stabilization of stable isotopic concentrations in the river water.
3.3 Hydrograph separation in the Urumqi River
3.3.1 Isotopic time series partitioning of streamflow components
The distribution of stable water isotopes provides valuable insights into runoff generation processes at the Houxia station. Prior efforts to characterize the isotopic composition of streamflow and identify the primary source waters in the Urumqi River basin have established an in-depth understanding of seasonal variability in the streamflow signal ( and ). Hence, in Houxia station, the isotopic composition of streamflow can be divided into five well-defined stages in the time series partitioning of δ18O and δD components.
Figure 7. Schematic representation of streamflow partitioning strategy: four flowcharts illustrating the steps taken in the portioning strategy.
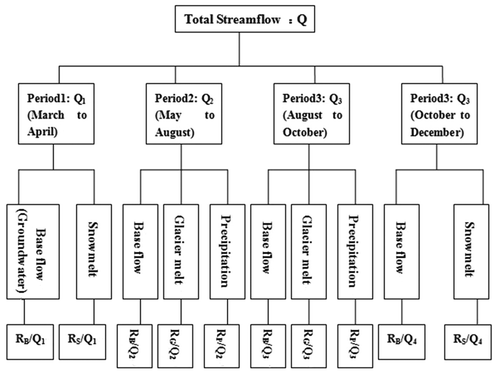
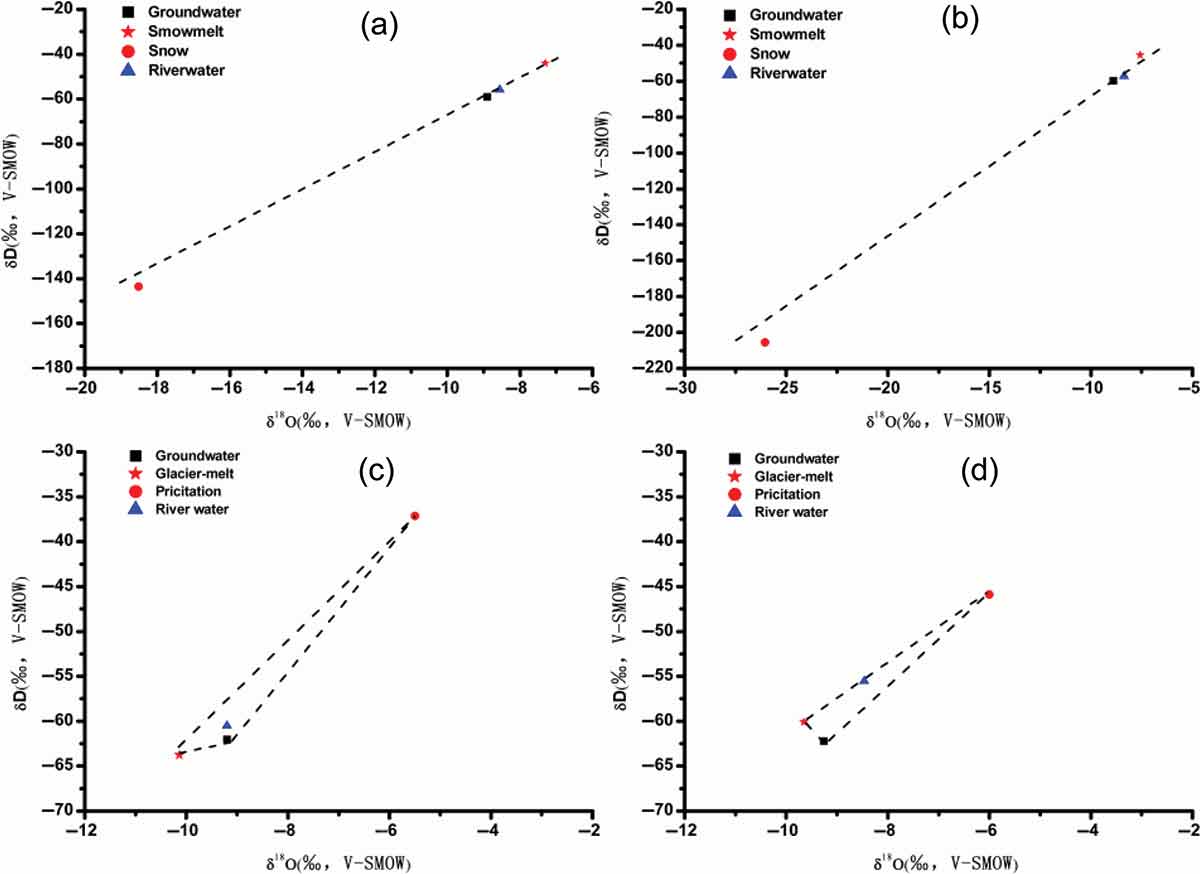
Figure 8. Relationships of mean δD and δ18O of river water, groundwater, ice meltwater and precipitation during : (a) Q1, (b) Q4, (c) Q2 and (d) Q3.
Streamflow during March and April tends to contain higher proportions of surface water derived from snowmelt and river ice; therefore, it has an isotopically enriched signature during this period. The second observed period was from 25 April to 5 August; the runoff during this period was recharged mainly by precipitation and glacial melt, and exhibited lower δ18O and δD contents. The streamflow from 5 August to 5 October contained a high proportion of groundwater. In the fourth period from late autumn to early winter, the increased runoff derived from groundwater and snowmelt caused a gradual increasing trend of isotopic values. During the fifth period from December to February, the runoff was mainly recharged by groundwater, and the isotopic composition remained stable.
3.3.2 Partitioning of streamflow components
The partitioning of streamflow using stable isotopes as conservation tracers is based on the classical two-component or three-component hydrograph separation method and is inferred from the natural cycle of seasonally active source water (snowmelt, glacial melt, groundwater, precipitation) in the streamflow, which is typical of streams in cold alpine climates. shows the changes in streamflow isotopes for the five different periods. We chose Q1, Q2, Q3 and Q4 to represent the first four periods; we did not discuss the fifth period because the streamflow in this period was mainly derived from groundwater.
The mixing ratio between source water components in streamflow is determined in two portioning steps using mass and isotope balance calculations. The first step in the breakdown of streamflow components involves the partitioning of different streamflow periods, as shown in the flowchart in .
The second step involves the partitioning of different water resource proportions. During the spring (period Q1) and late autumn (period Q4), the instantaneous contributions from direct snowmelt (RS), and baseflow (groundwater: RB) to the total streamflow Q are given by:
equation (4) is used to calculate the proportions of baseflow and snowmelt waters during the spring and late autumn, respectively. The δ values and subscripts refer to the isotopic compositions of the respective components, and TDS represents the total dissolved salts. In these periods, direct channel precipitation can be assumed to be negligible.
During the summer (period Q2) and autumn (period Q3), the instantaneous contributions of RB, RG and direct channel precipitation (RP) to Q are given by:
Kong and Pang (Citation2012) indicated that the TDS and isotopic values of river, ice meltwater and groundwater vary significantly above Houxia Station. Because significant differences in TDS and isotopes exist in the upper reaches of the Urumqi River above Houxia station, we carried out hydrograph separation in that area. We determined that the river below the Houxia section was mainly composed of groundwater due to the similar chemical and isotopic compositions between groundwater and the river water ( and ).
(a) shows that the isotopic composition of streamflow from March to April is characterized by an enriched isotopic value close to that of direct snowmelt, which is a mixture of both snowmelt and meltwater from river ice. Using the average TDS and δ18O of groundwater and direct snowmelt water as parameters, we can obtain the relative contributions of each component in the Urumqi River using equation (4).
During periods Q2 ((c)) and Q3 ((d)), the compositions of river samples (average values) were distributed in a triangle formed by precipitation, glacial meltwater and groundwater. Using the mean TDS and δ18O values of groundwater, glacier meltwater and precipitation as parameters, we can obtain the proportion of each component contributing to the Urumqi River using equation (5). The isotopic composition of streamflow from period Q4 is characterized by an enriched isotopic value close to that of direct snowmelt and groundwater ((b)). equation (4) is used to separate the streamflow of period Q4. The input parameters were the average TDS and δ18O values of groundwater and direct snowmelt water (a mixture of both snowmelt and river ice).
3.3.3 Contribution of different water sources
shows the proportions of the various water resources in the Urumqi River during the four periods. The contributions of direct snowmelt and groundwater were estimated by combining the results of the two-component separations. We estimated that 89.5% of the runoff during the spring (Q1) of 2012 was contributed by groundwater, while 10.5% was derived from direct snowmelt through the soil compartment. By late autumn (Q4) of 2012, only 9% of the runoff was derived from direct snowmelt, and 91% came from groundwater.
Table 3. Estimated fractions of water sources as a result of hydrograph separation above Houxia section along the Urumqi River.
The runoff in the summer (Q2) and early autumn (Q3) was mainly contributed by glacial meltwater, precipitation, and groundwater. We estimated that 58.2% of the runoff during the summer of 2012 was contributed by groundwater, while 20.7% and 21.1% came from precipitation and glacial meltwater, respectively (). In early autumn (Q3), 75.9% of the runoff could be attributed to groundwater, 19.1% was recharged by precipitation, and only 5% originated from glacial meltwater. The larger contributions of glacial meltwater in the summer compared to in early autumn may be due to higher temperatures in the watershed, resulting in more glacial melting. From the results, it is clear that groundwater comprises a large proportion of the runoff to the Urumqi River.
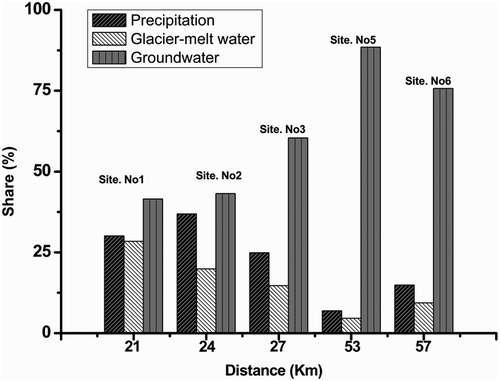
Kong and Pang (Citation2012) found that the effects of precipitation and groundwater on runoff vary significantly along the Urumqi River in August. This paper further identified the hydrological processes during the summer based on the isotopic and hydrochemical analyses of glacial melt, groundwater and precipitation in sampling sites with different altitudes. Based on the average hydrochemical and isotope values of different sampling sites, shows the contributions of various water sources at five sampling sites (excluding Houxia) of the Urumqi River in summer. Groundwater accounts for a larger and larger portion of the river water as the distance from the site to the glacier front increases. At a distance of 21 km, the proportion of groundwater exceeds 40%. The contribution of precipitation decreases gradually, while that of glacial meltwater decreases to 28.4% at a distance of 21 km and then further decreases to 9.4% at 57 km. In summary, groundwater is the main source of the Urumqi River in summer. The proportion of precipitation in the summer varies from 6.9% to 36.9%, with an average of 26.85%. The proportion of precipitation is the largest at a distance of 24 km (approximately 36.9%). Both precipitation and meltwater exhibit decreasing trends as the distance from the site to the glacier front increases.
Figure 9. Estimated fractions of water sources as a result of hydrograph separation in different sites along the Urumqi River. (Input parameters: Precipiation: TDS = 75, δ18O = −11.56 for site Nos 1–3, TDS = 75, δ18O = −6.75 for site Nos 5–6; Glacier melt: TDS = 50, δ18O = −10.63; Groundwater: TDS = 230, δ18O = −9.41.)
Previous studies on the components of runoff have primarily been conducted for individual events or on a monthly time scale. However, this paper employed isotope hydrology separation to quantify the recharge to the Urumqi River over an entire hydrological year. Four periods were considered to describe the variation in the runoff components. The results provide clear evidence regarding the contributions of different water resources in different seasons, which is beneficial for water resource management in different seasons.
4 Discussion
4.1 Uncertainties in hydrograph separations
The uncertainty analysis approach described in equation (2) may also be applied to three-component mixing problems, which require two tracers. This method of uncertainty analysis uses the TDS and oxygen-18 data for a stream water sample from the Urumqi River basin.
As for the separation in this study, temporal variations in oxygen-18 composition were observed for stream water (collected in Houxia), groundwater, meltwater (including glacial melt and snowmelt) and precipitation. However, each type of water was sampled at one site; thus, the general spatial heterogeneity of 18O concentrations should be considered when estimating the W values of the components. The standard deviations of the tracer concentrations were multiplied by the appropriate t values from Student’s t distribution to estimate uncertainty due to the variation of tracer concentrations (Uv). The accuracy of the measurement method was 0.1‰ for oxygen-18 analyses. Twice this value was used as the uncertainty in C1, C2 and Cs to calculate the uncertainty from analytical precision (Ua) in the hydrograph separation herein. Based on the assumed standard deviation and the values of 18O in mixing components, the uncertainty of hydrograph separation in the Urumqi River basin was evaluated. The estimated uncertainties are shown in . The uncertainty in the measurement method was less important than that in the temporal and spatial variations in tracer concentrations. The uncertainty terms for precipitation were generally higher than those of others components.
Table 4. Uncertainty results for isotope hydrograph separation in Urumqi River basin.
Studies on the isotope hydrology separation uncertainties in sampling and error processing have attracted more attention. In the majority of previous isotope hydrology separation studies, the isotopes of precipitation and groundwater have obvious spatial differences (Pang et al. Citation2011, Wang Citation2014). In this study, precipitation and groundwater samples were collected from the Houxia station. The errors still exist because the isotope variability is not considered. In many isotope hydrology separation studies, depth-integrated snow cores are used define the event component. However, in this study, snowmelt and glacial melt samples were collected from one sampling site, and the volume and spatial variables did not account for the isotope value.
Another error is the temporal variability of the stable isotope component in the discharge composition. Isotopic changes in the discharge components along the flow path make isotope hydrology separation much more complex (Kong and Pang Citation2010); the isotopic composition may be significantly different compared to other years.
To eliminate the uncertainties, two methods should be used in the future: (a) use a volume of weighted average values from the glacier/snow meltwater and use current meltwater isotope values from the snow lysimeter at each sampling time; and (b) set more sampling points and collect more groundwater and precipitation samples from different altitudes.
4.2 The characteristics of the streamflow components
Changes in the stable isotopic signatures of river waters are commonly used to identify hydrological source areas and flow paths in watersheds (Burns Citation2002, Buttle Citation1994, Rodgers et al. Citation2005). Stream water chemistry and nutrient supplies vary due to the diverse flow paths taken by rainfall, snowmelt and glacial melt as well as the residence time of water in the catchment compartments. In addition, the relationships between solute concentrations and streamflow changes have also provided important formation on hydrological pathways. Different catchments may show different chemical and isotopic responses to hydrological events. Rainfall sometimes passes rapidly through catchments and provides a major portion of the streamflow (Neal and Rosier Citation1990). In cold alpine arid areas, glacier meltwater contributes to streamflow as a source of recharge (Cable et al. Citation2011), and groundwater is usually the main recharge source of streamflow (Kong and Pang Citation2012). Although a number of hydrological investigations have employed isotopic tracers (Kendall and Coplen Citation2001, Naftz et al. Citation2002, Frost and Toner Citation2004), the use of isotopes to determine the contributions of rain, meltwater and groundwater to streamflow in alpine catchments has received little attention.
Like most rivers of western China (Zhao et al. Citation2011, Kong and Pang Citation2012), stream water in the Urumqi River exhibits relatively large temporal variations in both δ18O and δD, with δ18O ranging from −10.0 to −7.4 ‰ and δD from −63.4 to −46.0‰. It also shows distinct seasonal patterns where the δ18O and δD values are lower in summer than in late autumn. However, the river water isotopes of the Urumqi River exhibit more significant volatility, especially in the summer and snowmelt season. For high-elevation mountain streams, the larger portion of annual streamflow occurs during the melting of snow that accumulates from late autumn to early spring. The temporary storage of precipitation in snowpack and its subsequent melting controls the larger variability in the solute and isotopic compositions of stream water during the melt season (Jin et al. Citation2012). Typically, the isotopic and chemical concentrations of river water are clearly diluted during snowmelt due to the increased discharge. In contrast, the isotopic value of the Urumqi River was significantly richer during snowmelt (spring and late autumn), and the isotopic ratios of oxygen and hydrogen in snowmelt were larger than those reported in other studies (Jin et al. Citation2012). This indicates that strong evaporation fractionation affected the snowmelt water in the Urumqi River basin.
The hydrograph separation results for the summer indicate that precipitation had a larger contribution to runoff in this period. The range of precipitation δ18O (–36.2 to 1.5‰) in the Tarim River basin is larger than that reported by Johnson and Ingram (Citation2004) but smaller than that in Tian et al. (2007). Precipitation in arid regions of western china is a complex process (Pang et al. Citation2011, Zhao et al. Citation2011). Zhao et al. (Citation2011) investigated the origin of moisture entering the headwaters of the Heihe River basin and found that westerlies and polar vapours are the main vapour sources in the arid region of Northwest China. Pang et al. (Citation2011) found that the isotopic temperature affects the underlying processes in Northwest China; these processes include equilibrium isotope fractionation, the adiabatic rise of clouds during winter in mountainous terrain, subcloud evaporation and the recycling of moisture from the ground (soil and surface water). In arid and semi-arid regions, the recycling of terrestrial moisture via evapotranspiration has been recognized as an important component of the atmospheric moisture balance. Kong and Pang (Citation2013) found that the recycled fraction in precipitation is less than 2.0 ± 0.6% for the Tianshan Mountain stations and reaches values up to 15.0 ± 0.7% in the Urumqi region. Strong evaporation in the summer results in enriched isotopes in precipitation. This suggests that summer precipitation events, which have higher isotope values, are the main reason for the significant variation in stream water isotopes.
In arid areas of Northwest China such as Xinjiang and the Hexi Corridor, groundwater resources play a key role in economic development. Previous studies have noted the importance of temporal and spatial heterogeneity in infiltration, evaporation and groundwater recharge processes in arid and semi-arid regions (Zhang et al. Citation2013, Wang Citation2014). For the Urumqi River basin, the isotope values in groundwater are relatively stable with mean isotopic compositions of −9.15 and −58.91‰ for δ18O and δD, respectively. The groundwater isotope values of the Urumqi River basin are similar to those of the south slope of Tianshan Mountain (Wang Citation2014). According to the study of Wang (Citation2014), mountain precipitation and glacial meltwater were the main sources of the groundwater recharge.
Studies of runoff components in the Urumqi River basin are rare. Only Kong and Pang (Citation2012) have provided a streamflow composition analysis using isotopes in the Urumqi River; however, this analysis only covered the month of August, 2009. Nonetheless, long-term runoff generation and dynamics are especially important issues in watershed and water resource management. This work presented an extension to the previous study and analysed the mechanism and streamflow composition of the Urumqi River basin throughout an entire hydrological year. The results of Q2 are consistent with those of the previous study (Kong and Pang Citation2012), while the runoff components determined for the others periods are different from their study. In periods Q1 and Q4, snowmelt water is an important resource. Previous investigations in the study region have ignored the seasonal characteristics of streamflow components. This work is the first to investigate the seasonal characteristics of streamflow components, which are essential to understanding the regional water cycle.
Groundwater is the major source of recharge in the Urumqi River basin, and glacial meltwater and precipitation are also important sources. The increase in discharge to the Urumqi River is thus due not only to groundwater but also to increased recharge from precipitation and glacial melting. Also striking were the significant variations in δ18O values of stream waters between summer and early autumn. These variations in stream water isotopes were attributed to glacial meltwater and precipitation. Whether glacial runoff is related to climate change can be evaluated by the precipitation and glacial melt, which are in turn controlled by temperature (Li et al. Citation2010). In the Urumqi River basin, the melting of glaciers occurs over a three-month period (mid-May to mid-August); thus, temperature mainly affects the stream water composition in the summer. With the rapid rise of summer temperature, the increased recharge from glacial melt likely causes the Urumqi River streamflow to increase significantly. Over the past 50 years, the summer temperature and annual precipitation near the glacier increased by 0.8°C and 19%, respectively. The glacier continuously retreated from 1962 to 2003; the cumulative mass balance was −10 032 mm, or 20% of the glacier volume (Ye et al. 2005). In addition, Li et al. (Citation2010) found that the runoff increased approximately 3.554 × 10⁶ m3 (29.6%) on average from 1983 to 2006.
Both summer precipitation and temperature are negatively correlated with mass balance and positively associated with runoff. Ye et al. (2005) reported that the correlation between temperature and mass balance is much stronger, indicating that summer temperature controls glacier mass balance and runoff changes. Although the increases in annual mean temperature and annual precipitation are major reasons for the increase in Urumqi River runoff (Li et al. Citation2010), the ratio of glacial melt to precipitation in the streamflow is less than that for groundwater. The possible reasons for this are: (a) the increased precipitation is lost as evaporation due to increased temperature, or is percolated into the groundwater system; and (b) as a result of a strong reduction in glacial area, the runoff contribution from the other small glaciers in the basin may have started to decline in recent years.
Isotope hydrograph separation provides a quantitative method to differentiate the replenishment of rivers for water resource management, especially in ungauged basins. In the study of the Urumqi River, more attention should be paid to water supply, as rising temperature has become a major concern. In water resource management, both climate change and the replenishment of rivers should be given sufficient emphasis.
5 Conclusions
The Urumqi River basin has become warmer and moister in the last several decades. Our results show that significant monotonic increasing trends have occurred for both temperature and precipitation. During the past 60 years in the study area, temperature has increased by nearly 1°C, and precipitation has increased by nearly 66 mm. A stepwise increase occurred in both temperature and precipitation in approximately 1984; mean temperature and precipitation increased from 6.41°C and 236.5 mm, respectively, to 7.39°C and 302.36 mm, respectively. Climate change has resulted in streamflow changes in the Urumqi River basin. Runoff in the Urumqi River basin shows a significant monotonic increasing trend. The stepwise change in runoff occurred in approximately 1991. This change in runoff, which is a response to climate change, is lagged.
The isotopic and chemical compositions of stream water in the Urumqi River basin were presented in this study. Varying stable isotopes and solute compositions throughout the year indicate that streamflow is recharged with different sources in different seasons. Through a two-component mixing model based on mass balance, the streamflow in the Urumqi River basin is separated into snowmelt and groundwater in the spring and late autumn. In summer and early autumn, the streamflow in the basin is separated into glacial meltwater, precipitation and groundwater through a three-component mixing model. Our study shows that significant differences exist among meltwater, rainwater, groundwater and stream water. A significant seasonal variation in oxygen-18 occurred in the study period. Furthermore, we found that the Urumqi River is a groundwater-dependent river. Glacial meltwater discharges into the streamflow in summer and early autumn, with glacial melt contributions to the Urumqi River streamflow (Houxia) varying from 5% to 21%. Meanwhile, precipitation plays an important role in the wet season, with 20.7% of summer streamflow coming from precipitation. Throughout 2012, the proportion of precipitation in the streamflow component is 17.6%, and the proportion of glacial meltwater is 14.7%. Only 5% of the streamflow is recharged from snowmelt water.
Groundwater is a vital factor in the water resources of the Urumqi River basin, and glacial meltwater is an important factor of the streamflow during the summer. As the impacts of global climate change continue to worsen, water resource management and prediction in arid glacial regions require our urgent attention.
Disclosure statement
No potential conflict of interest was reported by the authors.
Additional information
Funding
References
- Arnold, J.G. and Allen, P.M., 1999. Automated methods for estimating baseflow and ground water recharge from streamflow records. Journal of the American Water Resources Association, 35 (2), 411–424. doi:10.1111/j.1752-1688.1999.tb03599.x
- Burns, D.A., 2002. Stormflow-hydrograph separation based on isotopes: the thrill is gone? what’s next? Hydrological Processes, 16 (7), 1515–1517. doi:10.1002/hyp.5008
- Buttle, J.M., 1994. Isotope hydrograph separations and rapid delivery of pre-event water from drainage basins. Progress in Physical Geography, 18 (1), 16–41. doi:10.1177/030913339401800102
- Cable, J., Ogle, K., and Williams, D., 2011. Contribution of glacier meltwater to streamflow in the Wind River Range, Wyoming, inferred via a Bayesian mixing model applied to isotopic measurements. Hydrological Processes, 25 (14), 2228–2236. doi:10.1002/hyp.7982
- Chen, Y., et al., 2006. Regional climate change and its effects on river runoff in the Tarim Basin, China. Hydrological Processes, 20 (10), 2207–2216. doi:10.1002/hyp.6200
- Chen, Y., et al., 2007. Effects of climate change on water resources in Tarim River Basin, Northwest China. Journal of Environmental Sciences, 19 (4), 488–493. doi:10.1016/S1001-0742(07)60082-5
- Chen, Y.N., et al., 2009. Hydrology and water resources variation and its responses to regional climate change in Xinjiang. Acta Geographica Sinica, 64 (11), 1331–1341.
- Clark, I. and Fritz, P., 1997. Environmental isotopes in hydrology. New York: Boca Raton Fla Lewis Publishers.
- Craig, H., 1961. Isotopic variations in meteoric waters. Science, 133 (3465), 1702–1703. doi:10.1126/science.133.3465.1702
- Craig, H. and Gordon, L.I., 1965. Deuterium and oxygen 18 variations in the ocean and the marine atmosphere. Consiglio nazionale delle richerche, Laboratorio de geologia nucleare.
- Dansgaard, W., 1964. Stable isotopes in precipitation. Tellus, 16 (4), 436–468. doi:10.1111/j.2153-3490.1964.tb00181.x
- Fengjing, L., et al., 1995. Snow and water chemistry of a headwater alpine basin, Urumqi River, Tian Shan, China. IAHS Publications-Series of Proceedings and Reports-Intern Assoc Hydrological Sciences, 228, 207–220.
- Fritz, P. and Fontes, J.C., 1980. Handbook of environmental isotope geochemistry. Volume 1. The terrestrial environment, A. Amsterdam: Elsevier Scientific Publishing Company.
- Frost, C.D. and Toner, R.N., 2004. Strontium isotopic identification of water‐rock interaction and ground water mixing. Ground Water, 42 (3), 418–432. doi:10.1111/j.1745-6584.2004.tb02689.x
- Gat, J.R., 1996. Oxygen and hydrogen isotopes in the hydrologic cycle. Annual Review of Earth and Planetary Sciences, 24 (1), 225–262. doi:10.1146/annurev.earth.24.1.225
- Gat, J.R. and Gonfiantini, R., 1981. Stable isotope hydrology. Deuterium and oxygen-18 in the water cycle. International Atomic Energy Agency. Vienna, Technical Reports Series, 210.
- Gibson, J.J., et al., 2005. Progress in isotope tracer hydrology in Canada. Hydrological Processes, 19 (1), 303–327. doi:10.1002/hyp.5766
- Gibson, J.J. and Prowse, T.D., 2002. Stable isotopes in river ice: identifying primary over‐winter streamflow signals and their hydrological significance. Hydrological Processes, 16 (4), 873–890. doi:10.1002/hyp.366
- IPCC (Intergovernmental Panel on Climate Change), 2007. Climate Change 2007. The Physical Science Basis. Report of Working Group I of the Intergovernmental Panel on Climate Change. Cambridge, UK: Cambridge University Press.
- Jin, L., et al., 2012. Identifying streamflow sources during spring snowmelt using water chemistry and isotopic composition in semi-arid mountain streams. Journal of Hydrology, 470-471, 289–301. doi:10.1016/j.jhydrol.2012.09.009
- Johnson, K.R. and Ingram, B.L., 2004. Spatial and temporal variability in the stable isotope systematics of modern precipitation in China: implications for paleoclimate reconstructions. Earth and Planetary Science Letters, 220 (3–4), 365–377. doi:10.1016/S0012-821X(04)00036-6
- Kendall, C. and Coplen, T.B., 2001. Distribution of oxygen‐18 and deuterium in river waters across the United States. Hydrological Processes, 15 (7), 1363–1393. doi:10.1002/hyp.217
- Kendall, K.A., Shanley, J.B., and McDonnell, J.J., 1999. A hydrometric and geochemical approach to test the transmissivity feedback hypothesis during snowmelt. Journal of Hydrology, 219 (3–4), 188–205. doi:10.1016/S0022-1694(99)00059-1
- Kong, Y. and Pang, Z., 2012. Evaluating the sensitivity of glacier rivers to climate change based on hydrograph separation of discharge. Journal of Hydrology, 434–435, 121–129. doi:10.1016/j.jhydrol.2012.02.029
- Kong, Y. and Pang, Z., 2013. Statistical analysis of stream discharge in response to climate change for Urumqi River catchment, Tianshan Mountains, central Asia. Quaternary International. doi:10.1016/j.quaint.2013.05.002
- Kong, Y.L. and Pang, Z.H., 2010. Isotope hydrograph separation in alpine catchments: a review. Journal of Glaciology and Geocryology, 32 (3), 619–625.
- Li, B., et al., 2012. Why does the temperature rise faster in the arid region of northwest China? Journal of Geophysical Research: Atmospheres (1984–2012), 117 (D16), 81–81. doi:10.1029/2012JD017953
- Li, Z., et al., 2010. Observed changes in streamflow at the headwaters of the Urumqi River, eastern Tianshan, central Asia. Hydrological Processes, 24, 217–224.
- Lis, G.L., Wassenaar, L I., and Hendry, M J., 2008. High-precision laser spectroscopy D/H and 18O/16O measurements of microliter natural water samples. Analytical Chemistry, 80 (1), 287–293. doi:10.1021/ac701716q
- Naftz, D., et al., 2002. Handbook of groundwater remediation using permeable reactive barriers: applications to radionuclides, trace metals, and nutrients. San Diego, CA: Elsevier.
- Nathan, R.J. and McMahon, T.A., 1990. Evaluation of automated techniques for base flow and recession analyses. Water Resources Research, 26 (7), 1465–1473. doi:10.1029/WR026i007p01465
- Neal, C. and Rosier, P.T.W., 1990. Chemical studies of chloride and stable oxygen isotopes in two conifer afforested and moorland sites in the British uplands. Journal of Hydrology, 115 (1–4), 269–283. doi:10.1016/0022-1694(90)90209-G
- Pang, Z., et al., 2011. Processes affecting isotopes in precipitation of an arid region. Tellus B, 63 (3), 352–359. doi:10.1111/j.1600-0889.2011.00532.x
- Piao, S., et al., 2010. The impacts of climate change on water resources and agriculture in China. Nature, 467 (7311), 43–51. doi:10.1038/nature09364
- Pu, T., et al., 2013. Characteristics of water stable isotopes and hydrograph separation in Baishui catchment during the wet season in Mt. Yulong region, south western China. Hydrological Processes, 27 (25), 3641–3648. doi:10.1002/hyp.9479
- Qu, S.M, et al., 2008. Isotope tracer in watershed hydrological modeling. Advances in Water Science, 19, 138–147.
- Rodgers, P., et al., 2005. Using stable isotope tracers to assess hydrological flow paths, residence times and landscape influences in a nested mesoscale catchment. Hydrology and Earth System Sciences Discussions, 9 (3), 139–155. doi:10.5194/hess-9-139-2005
- Simin, Q. and Haiying, B., 2006. Review on isotopic hydrograph separation methods. Water Resources and Power, 1, 025.
- Sklash, M.G. and Farvolden, R.N., 1979. The role of groundwater in storm runoff. Journal of Hydrology, 43 (1–4), 45–65. doi:10.1016/0022-1694(79)90164-1
- Sun, C.J., et al., 2014. Analysis on the streamflow components of the Typical inland River, Northwest China. Hydrological Sciences Journal, 10.1080/02626667.2014.1000914
- Sun, C.J., et al., 2015. Isotopic and hydrochemical composition of runoff in the Urumqi River, Tianshan Mountains, China. Environmental Earth Sciences, 10.1007/s12665-015-4144-x
- Tian, L.D., et al., 2007. Stable isotopic variations in west China: a consideration of moisture sources. Journal of Geophysical Research: Atmospheres, 112 (D10), 185–194.
- Turner, J.V. and Macpherson, D.K., 1990. Mechanisms affecting streamflow and stream water quality: An approach via stable isotope, hydrogeochemical, and time series analysis. Water Resources Research, 26 (12), 3005–3019.
- Wang, S., 2014. Hydrochemical and isotopic characteristics of groundwater in the Yanqi Basin of Xinjiang province, northwest China. Environmental Earth Sciences, 71 (1), 427–440. doi:10.1007/s12665-013-2450-8
- Xu, C.C., et al., 2010. Hydrology and water resources variation and its response to regional climate change in Xinjiang. Journal of Geographical Sciences, 20 (4), 599–612.
- Ye, B., et al., 2005. The Urumqi River source Glacier No. 1, Tianshan, China: changes over the past 45 years. Geophysical Research Letters, 32 (21), 154–164.
- Zhang, Y., et al., 2013. Spatial characteristics of surface water and groundwater using water stable isotope in the Tarim River Basin, northwestern China. Ecohydrology, 6 (6), 1031–1039. doi:10.1002/eco.1416
- Zhao, L.J., et al., 2011. Isotopic evidence for the moisture origin and composition of surface runoff in the headwaters of the Heihe River basin. Chinese Science Bulletin, 5656 (1), 58–67.