
ABSTRACT
Losses in performance of a low-dimensional rainfall–runoff model resulting from changes in the annual precipitation are assessed for five catchments located in a mountainous Mediterranean environment, the Troodos Mountains, Cyprus. For an increase of 25% or a decrease of 15% in the cumulative precipitation depth of a five-year period, model performance losses become significant: the model robustness criterion reaches 13% and simulated cumulative runoff is under- or overestimated by up to 20%. However, only the 25% decrease in the precipitation depth influences the ability of the model to predict runoff dynamics (10% decrease in the Nash-Sutcliffe coefficient). This indicates the occurrence of either non-stationary effects or temporary secondary hydrological processes, which tend to amplify the decrease (or increase) in runoff production during the drier (or wetter) period. In addition, losses in model performance are analysed between one catchment and another. High performance losses despite close physical catchment properties show the poor transferability of model parameters in this environment.
Editor D. Koutsoyiannis; Associate editor Y. Gyasi-Agyei
1 Introduction
During the last decade, the assessment of climate variability impacts on water resource availability has become a crucial issue in hydrological sciences (Liuzzo et al. Citation2010). In order to explore this research field, numerous studies have described the application of hydrological models able to deal with climate or human intervention scenarios, involving interrelated responses of processes that are often associated with feedbacks and thresholds (Maxwell and Kollet Citation2008, Shen and Phanikumar Citation2010). The models used were therefore mainly physically-based, i.e. derived deductively from established laws, with a relatively high level of complexity justified by the desire to include processes explicitly (Abbott et al. Citation1986). However, because of the lack of knowledge and data on the functioning of hydrological systems, low-dimensional rainfall–runoff models, which simulate the transformation of precipitation into streamflow by lumping catchment heterogeneities and thereby remain parametrically and computationally efficient, are often judged more appropriate than complex structures (Perrin et al. Citation2001). Although deriving physically meaningful values from the calibrated parameters of these rainfall–runoff models is a challenging task, seasonal variation in the parameter values (or in model performance given a fixed parameter set) could be interpreted, at least in part, as the result of differences in dominant hydrological processes (Harman et al. Citation2011, Coron et al. Citation2012).
The Mediterranean region is characterized by high annual and inter-annual rainfall variability (Hoerling et al. Citation2012) and is expected to be a ‘hot spot’ for climate change (Lelieveld et al. Citation2014). Runoff generation in these environments is highly non-uniform and affected by many factors, first of all rainfall, but surface conditions, vegetation, geomorphological position and antecedent moisture conditions as well (Castillo et al. Citation2003). Crabit et al. (Citation2011) found significant differences in the runoff behaviour of 11 small Mediterranean catchments located in the same hydroclimatic region. Furthermore, the relationship between groundwater levels and streamflow is often weak (Perrin and Tournoud Citation2009), suggesting transient flow processes both in time and space (Lana-Renault et al. Citation2014).
The Mediterranean island of Cyprus supplies a significant part (about 40%) of irrigation and domestic water demands from surface resources (WDD Citation2011). Indeed, to face water scarcity induced by semi-arid climate conditions, the water policy of the 1960s directed the construction of dams to store the flows of the many seasonal rivers that drain the Troodos Mountains (Christodoulou et al. Citation2007). Flows generated in the Troodos Mountains also contribute substantially to the indirect recharge of the most important aquifers of the island, which are located within the sedimentary formation of the Mesaoria plain (Udluft et al. Citation2006). Quantifying and predicting the effects of environmental variability on catchment hydrology in the Troodos Mountains is therefore of critical importance for water management in Cyprus: (a) since 1980, repeated droughts resulted in serious water shortages so that temporary restrictions of 20% on the domestic supply and 20 to 70% on irrigation were imposed (Tsiourtis Citation2004); and (b) for the 2016–2050 period, climate projections show that precipitation will likely remain highly variable inter-annually, whereas the mean annual precipitation may decrease by 2 to 7% (Hadjinicolaou et al. Citation2011).
The purpose of this study is to assess the impact of the inter-annual variability in the precipitation depth on the processes that govern the partitioning of rainfall into runoff at the catchment scale in a typical mountainous Mediterranean environment, the Troodos Mountains. To this end, the dependency on precipitation depth of the parameters of a low-dimensional rainfall–runoff hydrological model is investigated. The generalized split-sample test (GSST) developed by Coron et al. (Citation2012) is applied; this approach is based on the analysis of the transferability of the model parameters towards a drier (or wetter) climate by considering the behaviour of the catchment in the drier (or wetter) years it currently experiences. In addition, the parameter transferability is also analysed spatially, i.e. from one catchment to another, in order to highlight the dependency of model parameters and dominant hydrological processes on the physical properties and to test the applicability of calibrated models in ungauged catchments.
2 Study area and data
Five catchments located in the northern part of the Troodos Mountains are considered in this study (; ). The geology consists of an ophiolitic complex, which comprises harzburgites, gabbros, sheeted dykes and pillow lavas, from upstream to downstream. The major groundwater resources are associated with the ophiolitic complex, characterised by strong heterogeneities in hydraulic conductivity and porosity related to tectonic fracturing and hydrothermal alteration. The topography is typical of a mountain area with steep valleys. Over the upper part of the hillslope, land cover is dominated by Sclerophyll in association with cultivation patterns whereas the lower part is mainly occupied by coniferous forests.
Table 1. Physical and climatic (1980–2009 hydrological years) properties of the five studied catchments.
Figure 1. Elevation map of the Mediterranean island of Cyprus: (a) boundaries of the five studied catchments (Pr: Peristerona; Li: Livadi; Pd: Pedeios; Py: Pyrgos; At: Atsas), and (b) Peristerona catchment at Panagia Bridge showing raingauges, climatic stations and discharge monitoring station.
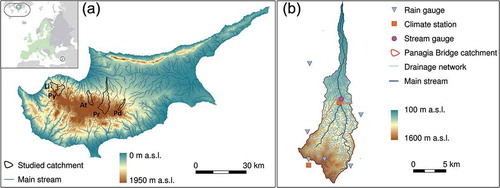
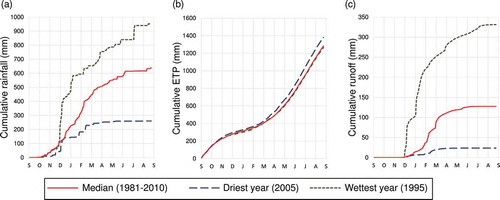
For the Peristerona River catchment, which is considered the most representative of the northern Troodos Mountains due to its large size and its central location, the minimum, median and maximum annual rainfall are 290, 620 and 940 mm, respectively. More than 80% of the rain falls between November and March; and December is the wettest month with 115 mm mean rainfall ( and ). The annual potential evapotranspiration depth ranges between 1200 and 1350 mm, and the minimum and maximum monthly values occur in January (~30 mm) and July (~170 mm), respectively (). The minimum, median and maximum annual runoff depths are 25, 130 and 330 mm, respectively; more than 90% of the runoff is produced between December and April and the high flow month is January with 35 mm mean runoff (). During the summer, river discharge is null and the first flow event generally occurs in September. The four other catchments are also characterized by highly variable annual rainfall and runoff depths and relatively stable potential evapotranspiration depths. In addition, it appears that the mean annual runoff is particularly low for the Atsas River catchment (); indeed, the mean annual runoff coefficient is 6% against 15 to 23% for the other catchments.
Figure 2. Annual precipitation estimated for the Peristerona catchment from hydrological years 1980 to 2009. The 15 wettest and the 15 driest years are shown.
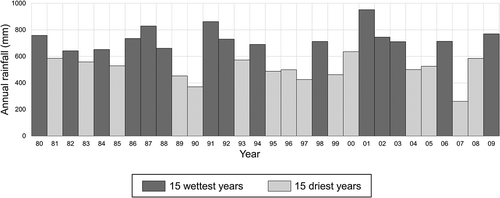
Figure 3. (a) Cumulative annual rainfall, (b) Penman-Monteith reference evapotranspiration (ETP) and (c) runoff estimated for the Peristerona catchment from hydrological years 1980–2009.
Daily precipitation on the five catchments for the 1980–2010 period was extracted from a 1-km gridded rainfall dataset. The gridded data were prepared for the whole Republic of Cyprus from 145 raingauges using inverse distance weighting (IDW) to interpolate local events, and a combination of stepwise geographically weighted regression and IDW to interpolate large events (Camera et al. Citation2013). These techniques were identified as the best performing methods out of a group of 15 (including regression models, IDW, thin plate splines and kriging), using a system of cross-validation and scoring. In cases where radar data are available, more sophisticated methods could also be used for interpolation (e.g. Gyasi-Agyei and Pegram Citation2014). For the same period, daily Penman-Monteith potential evapotranspiration (Allen et al. Citation1998) was computed from climatic records at two stations for each catchment, and daily runoff was obtained from the discharge data monitored at the catchment outlet.
3 Method
3.1 The GR4J model
The GR4J model is a daily lumped four-parameter rainfall–runoff model, which belongs to the family of soil moisture accounting models (Perrin et al. Citation2003). As many other conceptual models, its structure consists of generic components representing the catchment dynamics from a functional perspective (Fenicia et al. Citation2011) (): (a) a reservoir element for soil storage and release of water with a maximum capacity defined by the parameter X1 (mm); (b) a lag function element, including a convolution operator defined through the parameter X4 (days) and a routing store with a maximum capacity defined by the parameter X3 (mm), for transmission and delays of fluxes; and (c) junction elements for merging or splitting of fluxes. In addition, the GR4J model structure includes a gain/loss term in the modelled water balance, which can be assimilated to a groundwater exchange term, proportional to the parameter X2 (mm).
Figure 4. Simplified diagram of the GR4J rainfall–runoff model, modified from Perrin et al. (Citation2003).
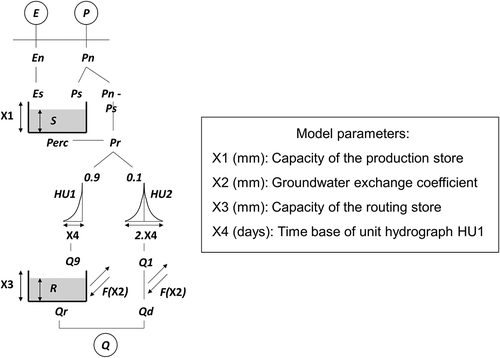
The first operation () is the subtraction of potential evapotranspiration (PET) from rainfall (P) to determine either a net rainfall (Pn) or a net evapotranspiration capacity (En). When Pn is not zero, a part Ps of Pn fills the production store; and when En is not zero, the quantity Es evaporates from the store. Both Ps and Es are determined as a function of the level in the production store (S). A percolation leakage (Perc) from the production store is then calculated as a function of S and is added to the part of the P that does not pass through the store for computing the total quantity of water (Pr) that reaches the routing functions. Pr is divided into two flow components according to a fixed split: 90% of Pr is routed by a unit hydrograph (HU1) and then a non-linear routing store; and the remaining 10% of Pr is routed by a single unit hydrograph (HU2). Both the content of the routing store and the output (Q1) of HU2 are subject to a groundwater exchange (F). The routing store is mainly responsible for low-flow simulations (Qr) computed as a function of level in the store (R). Total streamflow (Q) is finally obtained by summing Qr and Qd (Q1—F).
The GR4J model is the result of a continuous improvement process that started from a very simple structure, which was made more complex, while limiting the level of complexity between three and five parameters (Perrin et al. Citation2003). The final structure performance was assessed on 429 catchments situated in different climate conditions, from semi-arid to temperate and tropical humid. The 80% confidence intervals were calculated by Perrin et al. (Citation2003). Compared to many other rainfall models of the same type, the GR4J performance was shown statistically among the best. The required inputs for the GR4J correspond to the data available for this study, i.e. precipitation and potential evapotranspiration at a daily time-step. Moreover, the model outputs can be directly compared to the available runoff measurements.
3.2 Objective function and performance criteria
The following objective function is used for calibrating the four parameters of the GR4J model (Coron et al. Citation2012):
where ε is the objective function to minimize [L]; and Oi and Pi are the observed and predicted runoff on day i, respectively [L0.5]. The combination of the root mean-square error using square root-transformed flows for reducing influence of high flows (first term of the product (1)) and bias on total volume (second term of the product (1)) gives weight to dynamic representation as well as water balance.
To evaluate the ability of the calibrated GR4J model to predict streamflow dynamic, three criteria of the least-square type are used, based on the Nash and Sutcliffe (Citation1970) efficiency coefficient:
where NS1 is the classical Nash-Sutcliffe efficiency coefficient [-]; and Oi and Pi are the observed and predicted runoff on day i, respectively [L]. This criterion varies between -∞ and 100% (perfect simulation), 0% corresponding to the error of a naïve model that simulates a flow equal to the mean observed daily flow at each time step. On the basis of the same formulation, two other criteria computed on square root- (NS2) and logarithmic- (NS3) transformed flows are used; NS1 puts more emphasis on high-flow simulation, NS3 on low-flow simulation and NS2 gives an intermediate picture of the overall hydrograph fit (Oudin et al. Citation2006). In addition, a fourth assessment criterion is used for computing the model mean cumulative error, given in relative term by:
where BIAS is water balance error criterion [-]; and Oi and Pi are the observed and predicted runoff on day i, respectively [L]. A BIAS value higher or lower than 0% indicates an overestimation or an underestimation of the cumulative flow.
To emphasize the performance losses caused by the parameter transfer in time (i.e. from a donor period to a receiver one) or in space (i.e. from a donor catchment to a receiver one) the model robustness criterion defined by Coron et al. (Citation2012) is used:
where MRC is the model robustness criterion [-]; εD->R is the model error (equation (1)) on the receiver period/catchment using the parameters calibrated on the donor period/catchment [L0.5]; and εR->R is the smallest value of model error achievable on the receiver period/catchment, i.e. theoretically in calibration [L0.5]. The MRC takes a value of 0 if the parameter set calibrated on donor data gives the same fit it would have if it was calibrated on receiver data. The higher the MRC value, the less suitable the parameter set for the receiving period/catchment. Note that a negative value would mean that the parameter set calibrated on donor performs better on receiver than the reference set calibrated on receiver; this would be the indication of a problem in parameter calibration on receiver where the global optimum had not been identified properly.
3.3 Transferability analyses
The generalized split-sample test (GSST) was developed by Coron et al. (Citation2012) to provide insights into the transferability of several rainfall–runoff models over time under various climatic conditions. This procedure is applied on the Peristerona River catchment to assess the temporal transferability of the calibrated GR4J parameters based on the following steps:
A sliding window of 5 years is used to define 25 periods from September 1981 to August 2010. Between two periods, the window is moved by one hydrological year, thus allowing the periods to overlap.
The GR4J model is calibrated on each period by minimizing the objective function (1). Given the small number of free parameters, a prior inspection of the parameter space is made by testing a set of random parameters for situating the minimum region; then, a simple steepest descent local search procedure is applied from this region. The model is always run from September 1980 allowing at least one year warming.
Each calibrated parameter set is used to perform validation tests (model performance assessments using the NS1, NS2, NS3, BIAS and MRC criteria) on all independent periods, i.e. periods which do not overlap the corresponding calibration period.
To assess the spatial transferability of the calibrated GR4J parameters over the northern Troodos Mountains, the parameter sets calibrated on the Peristerona River catchment are used to perform validation tests on the four other catchments (Livadi, Pedeios, Pyrgos and Atsas Rivers). This calibration/validation analysis is carried out independently for each of the 25 periods defined previously.
Most of the results are presented in the form of notched boxplots. Boxplots characterize samples using the 25th, 50th and 75th percentiles, also known as the lower quartile (Q1), median (m) and upper quartile (Q3) and the interquartile range (IQR), which covers the central 50% of the data. To assist in judging differences between sample medians, the notches can be used to show the 95% confidence interval for the medians, given by m ± 1.58 × IQR/√n (n is the size of the sample); when notches do not overlap, the medians can be judged to differ significantly (Krzywinski and Altman Citation2014).
4 Results and discussion
4.1 Calibration results
4.1.1 Model performance
Annual rainfall in the Peristerona watershed ranged between 266 mm (2007/08) and 926 mm (2001/02). The 5-year averages ranged between 510 and 709 mm (). Three days in the 30-year record exceeded 100 mm rainfall, with the highest one-day rainfall (108 mm) recorded in December 1992. The NS1 value () ranges from 65% to 89% for a majority of periods, which indicates “very good” to “good” model performance for predicting streamflow dynamics (Moriasi et al. Citation2007). However, for four periods, among which the three driest periods (), the NS1 value is lower than 65%, showing poorer performance. More generally, a positive correlation exists between NS1 and the mean precipitation depth (correlation coefficient higher than 0.5, statistically significant at the 99% level of confidence). The NS2 and NS3 values ( and ) are less variable (77 to 90%) but also appear to be lower during the driest periods. The BIAS values () are 0% whatever the period considered, indicating that the predicted cumulative runoff is similar to the observed one. According to the selected criteria, the calibrated GR4J model therefore allows overall satisfactory runoff predictions.
Figure 5. (a) Mean annual rainfall for 5-year periods from hydrological years 1981 to 2009 for the Peristerona catchment; (b, c, d) Nash-Sutcliffe and (e) water balance criteria obtained in calibration for each of these periods with the GR4J rainfall–runoff model.
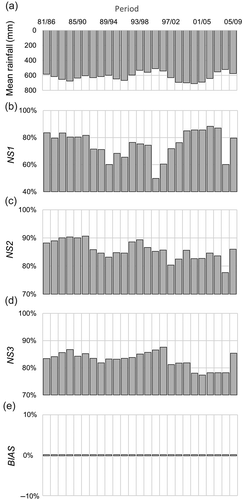
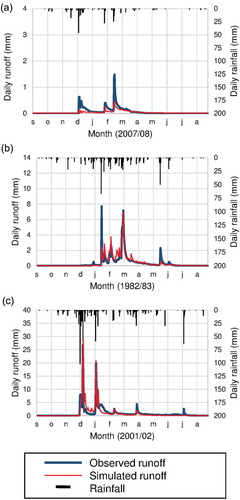
A decrease in model performance is still observed for the driest periods. The fact that the NS1 criterion is more affected than the NS2 and NS3 criteria indicates that this decrease in model performance mainly concerns high flow prediction. This is confirmed qualitatively when observed and predicted hydrographs are compared for the driest year (2007/08; minimum 1981–2009 annual precipitation, i.e. 266 mm) (). For the medium (1982/83; mean 1981–2009 annual precipitation, i.e. 622 mm) and the wettest (2001/02; maximum 1981–2009 annual precipitation, i.e. 926 mm) years, high flow prediction appears to be more consistent with observations ( and ). Such a decrease in calibrated model performance for the driest periods was also observed in previous studies with various models. This was explained by the fact that during dry periods: (a) catchments are generally characterized by small runoff events and lower runoff-to-rainfall ratios with higher percentage error in both rainfall and runoff (Li et al. Citation2012); and (b) datasets may not contain enough information to adequately calibrate model parameter responsible for simulating high flows (Gan et al. Citation1997).
Figure 6. Daily rainfall and observed and simulated runoff at Panagia Bridge (Peristerona catchment) for the hydrological years (a) 2007, (b) 1982 and (c) 2001.
4.1.2 Calibrated parameters
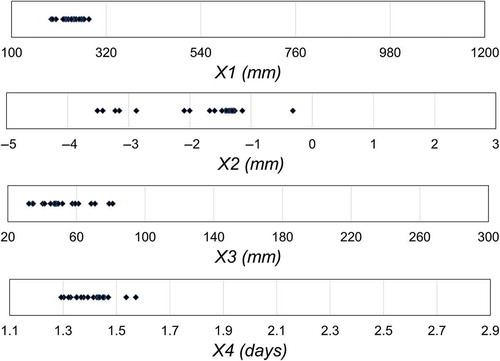
The calibrated values of the GR4J parameters are compared with 80% confidence intervals obtained based on calibrations performed by Perrin et al. (Citation2003) on 429 catchments situated in different countries all over the world (). The calibrated parameter values are located in similar areas regarding these confidence intervals whatever the period considered (). Concerning the production parameters: X1 falls between 190 and 280 mm and therefore appears to be relatively low, the confidence interval ranging from 100 to 1200 mm; and X2 is always negative, ranging from −3.5 to −0.5 mm against −5 to 3 mm for the confidence interval. Concerning the transfer parameters, both X3 (30–80 mm) and X4 (1.3–1.6 days) fall in the lower part of the corresponding confidence intervals (20–300 mm and 1.1–2.9 days). The relative stability of the calibrated parameter values, especially for X1 and X2 that govern the runoff production, could reflect some particular physical catchment properties: (a) low values for X1 are consistent with insignificant soil depth due to weathering resistant geology and steep and curt relief (Mederer Citation2009); and (b) negative values for X2 are consistent with substantial losses from surface to groundwater, most likely due to the very high density of open fractures in sheeted dykes, the location of the streams along fractures, and the coarse streambed material (Boronina et al. Citation2003, Udluft et al. Citation2006).
Figure 7. Calibrated values of the four GR4J rainfall–runoff model parameters (X1, X2, X3 and X4) obtained for 5-year periods from hydrological years 1981–2009 for the Peristerona catchment; ranges for x-axes correspond to the 80% confidence intervals computed for a large sample of catchments (Perrin et al. Citation2003).
Moreover, no significant correlation exists between the calibrated parameter values and the mean precipitation depth. For the whole 1981–2010 period, there are probably no drastic changes in the major mechanisms that control the rainfall–runoff transformation, although some terms of the water budget could be different in proportion due to shifts in processes.
4.2 Temporal transferability
4.2.1 Performance losses
The model robustness criterion (MRC), which expresses losses in model performance between calibration and validation, is plotted in the form of notched boxplots by considering different mean precipitation depths between calibration and validation periods ().
Figure 8. GR4J model performance losses due to the temporal parameter transfer plotted against change in mean annual precipitation depth (obtained for 5-year periods from hydrological years 1981–2009 for the Peristerona catchment).
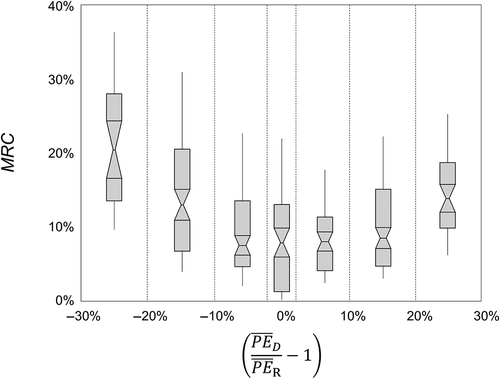
The centre boxplot () shows that performance losses occur during validation independently from the evolution in mean precipitation depth. Indeed, transferring parameters to another period with a similar mean precipitation depth leads to an increase in model error up to 13% (Q3). This is the result of the combination of (a) incompressible performance losses when passing from calibration to validation due to approximations in inputs, parameters and structure of the model; and (b) differences in the distribution of the daily precipitation between two periods with similar mean precipitation average conditions (Coron et al. Citation2012).
Left and right boxplots () show that additional performance losses occur when the mean precipitation depth decreases (left) or increases (right) from calibration to validation. For a decrease of 15% and for an increase of 25% in the mean precipitation depth, the median MRC reaches 13% and becomes significantly higher than the MRC observed independently from the evolution in this depth; and it reaches 20% for a decrease of 25% in the mean precipitation depth. Such performance losses could be explained as a form of elasticity of the rainfall–runoff relationship, i.e. a change in prevailing hydrological processes between periods of different regimes (Harman et al. Citation2011). Consequences of the increase in the mean precipitation depth on flow prediction are less marked than consequences of a decrease in this depth, which is not in agreement with the finding reported by Vaze et al. (Citation2010) and Coron et al. (Citation2012) for catchments located in Australia where transferability seems to be better from dry to wet than vice versa.
4.2.2 Consequences on runoff predictions
The values of classical (NS1), square root- (NS2) and logarithm- (NS3) transformed Nash-Sutcliffe criteria and BIAS criterion obtained in validation are plotted in the form of notched boxplots by considering different mean precipitation depths between calibration and validation periods (). These plots give information about the ability of the model to correctly predict both runoff dynamic and water balance over a period in the context of varying mean precipitation depth.
Figure 9. (a, b, c) Nash-Sutcliffe and (d) water balance criteria on simulated runoff as a function of changes in mean annual precipitation depth (obtained in validation for 5-year periods from hydrological years 1981–2009 for the Peristerona catchment with the GR4J rainfall–runoff model); right boxes show values obtained in calibration.
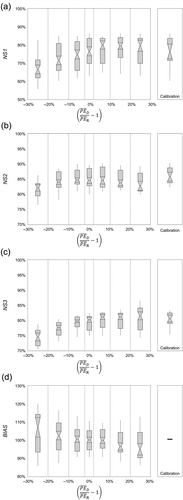
The centre boxplots show that values (Q1, m and Q3) of NS1, NS2 and NS3 ((a)–) obtained in validation are comparable to values obtained in calibration, indicating that prediction of the runoff dynamics is not significantly affected when passing from calibration to validation with a similar mean precipitation depth. The right and left boxplots show that the median NS1 value remains stable (83%) when the mean precipitation depth increases from calibration to validation and decreases when this depth decreases, significantly (−10%) for a decrease of 25%. Similar trends are observed for NS2 and NS3 values; however, the median NS3 value becomes significantly different from a decrease of 15% of the mean precipitation depth.
The median value of the BIAS remains equal to 0% when passing from calibration to validation with a similar mean precipitation depth, but its variability (IQR) increases from 0 to 10% (, centre boxplots). The median BIAS value increases or decreases when the mean precipitation depth decreases or increases from calibration to validation, respectively, showing an over- or an under-estimation of the water balance, which becomes significant (±5%) for a variation in this depth of ±25%. The variations in mean precipitation depth also result in an increase in the IQR up to 15% (+25% and −15% variations in mean precipitation depth) and 20% (−25% variations in mean precipitation depth).
The influence of changes in mean precipitation depth from calibration to validation periods on the Nash-Sutcliffe criteria shows that the ability of the model to predict runoff dynamics for low, medium and high flows becomes significantly poorer only when this depth decreases. The influence of such changes on the BIAS criterion shows that both marked increase and decrease in this depth affect the water budget prediction and its uncertainty.
4.3 Spatial transferability
Annual rainfall in the four other catchments ranged between 341 and 716 mm in Livadia, 196 and 791 mm in Pedieos, 382 and 810 mm in Pyrgos and 260 and 773 mm in Atsas. In the Pedieos watershed, five events in the 30-year record exceeded 100 mm, with the highest event measuring 154 mm (February 2003). In the other three watersheds only one event exceeded 100 mm. The values of classical Nash-Sutcliffe (NS1) criteria and BIAS criterion obtained in validation on the four selected catchments are plotted as notched boxplots and are compared to the values obtained in calibration on the Peristerona River watershed ().
Figure 10. (a) GR4J model performance losses due to the spatial parameter transfer from the Peristerona catchment to other catchments; and corresponding (b) Nash-Sutcliffe and (c) water balance criteria on simulated runoff (obtained for 5-year periods from hydrological years 1981–2009); right boxes show values obtained in calibration.
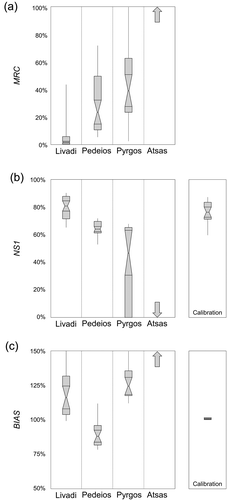
For the Livadi River catchment, no significant performance losses are observed. Indeed, the MRC values are generally lower than 0% (), and the boxplot for the NS1 and BIAS criteria are similar to those obtained in calibration ( and ). For the Pedeios and Pyrgos river catchments, performance losses increase to 13 and 23%, respectively; this significantly affects predictions of both runoff dynamic (median NS1 values decrease to 65 and 45%) and water balance (median under- and over- estimations of ~20%). The calibrated parameters are not suitable for the Atsas River catchment, the MRC values being higher than 600%, the NS1 values lower than 0% and the BIAS showing a 100% overestimation of the cumulative flow.
For the Panagia, Pomos, Pedeios and Pyrgos river catchments, no apparent link appears between physical properties (geology, geomorphology, vegetation) and losses in model performance. However, this spatial transferability analysis points out the specific hydrological behaviour of the Atsas River catchment, previously highlighted due to a markedly lower runoff coefficient compared to the other catchments under study. This could be explained, at least in part, by the geology, which is characterized by large outcropping of the upper units of the ophiolitic complex, especially gabbro (30% of the Atsas River catchment area; less than 10% of the area for the other catchments).
5 Summary and conclusion
The GR4J model performance generally ranges from “very good” to “good” during calibration and appears to be a suitable tool for modelling the dominant rainfall–runoff processes that occur in the Panagia River catchment. These processes probably remain quasi-similar during the whole 1981–2010 period, as indicated by the low variability in calibrated parameters. However, the temporal transferability analysis shows that, depending on the climatic condition, shifts in these processes could occur. Indeed, losses in model performance are highlighted when the mean precipitation depths decrease or increase from calibration to validation, showing a form of elasticity of the rainfall–runoff relationship. As a result, for a decrease (about 25%) in the mean precipitation depth, (i) the ability of the model to predict the runoff dynamics for low, medium and high flows becomes significantly poorer; and (ii) the predicted annual water budget is overestimated, up to 20%. Consequences of the increase in the mean precipitation depth on flow prediction are less marked than consequences of a decrease in this depth.
The identification and characterization of the transient processes responsible for such model performance losses require further investigation and probably a higher-dimensional model structure. The GR4J model does not capture these processes well and is therefore not sensitive enough to detect their temporal variability. However, the results show that temporal shifts in these processes, which are not taken into consideration by the model, tend to amplify the decrease (or increase) in runoff production during the driest (or wettest period). Likewise, the spatial transferability analysis does not allow one to link losses in model performance and physical catchment properties, except in one case (Atsas River catchment) marked by a significantly different geology.
In addition, poor values of efficiency criteria obtained for some catchments illustrate the risk of using a single calibrated parameter set to assess the water resources in mountainous Mediterranean environments. It also stresses the importance of the development and maintenance of gauging stations.
Acknowledgements
We would like to thank Costas Constantinos and Christos Christophi from the Cyprus Geological Survey Department, Gerald Dörflinger from the Water Development Department and Stelios Pashiardis from the Cyprus Meteorological Service for scientific discussions and data. We also thank the reviewers and the associate editor for their constructive comments on the manuscript.
Disclosure statement
No potential conflict of interest was reported by the authors.
Additional information
Funding
References
- Abbott, M.B., et al., 1986. An introduction to the European hydrological system — système hydrologique Européen “SHE”, 1: History and philosophy of a physically-based, distributed modelling system. Journal of Hydrology, 87, 45–59. doi:10.1016/0022-1694(86)90114-9
- Allen, R.G., et al., 1998. Crop evapotranspiration—guidelines for computing crop water requirements - FAO irrigation and drainage paper 56. Rome: FAO.
- Boronina, A., et al., 2003. Groundwater resources in the Kouris catchment (Cyprus): data analysis and numerical modelling. Journal of Hydrology, 271, 130–149. doi:10.1016/S0022-1694(02)00322-0
- Camera, C., et al., 2013. Evaluation of interpolation techniques for the creation of gridded daily precipitation (1 × 1 km2); Cyprus, 1980-2010. Journal of Geophysical Research, 119 (2), 693–712.
- Castillo, V.M., Gomez-Plaza, A., and Martinez-Mena, M., 2003. The role of antecedent soil water content in the runoff response of semiarid catchments: a simulation approach. Journal of Hydrology, 284, 114–130. doi:10.1016/S0022-1694(03)00264-6
- Christodoulou, G.I., Sander, G.C., and Wheatley, A.D., 2007. Characterization of the Ezousas aquifer of SW Cyprus for storage recovery purposes using treated sewage effluent. Quarterly Journal of Engineering Geology and Hydrogeology, 40, 229–240. doi:10.1144/1470-9236/06-031
- Coron, L., et al., 2012. Crash testing hydrological models in contrasted climate conditions: an experiment on 216 Australian catchments. Water Resources Research, 48, W05552. doi:10.1029/2011WR011721
- Crabit, A., Colin, F., and Moussa, R., 2011. A soft hydrological monitoring approach for comparing runoff on a network of small poorly gauged catchments. Hydrological Processes, 25, 2785–2800. doi:10.1002/hyp.v25.18
- Fenicia, F., Kavetski, D., and Savenije, H.H.G., 2011. Elements of a flexible approach for conceptual hydrological modeling: 1. Motivation and theoretical development. Water Resources Research, 47 (11), W11510. doi:10.1029/2010WR010174
- Gan, T.Y., Dlamini, E.M., and Biftu, G.F., 1997. Effects of model complexity and structure, data quality, and objective functions on hydrologic modeling. Journal of Hydrology, 192, 81–103. doi:10.1016/S0022-1694(96)03114-9
- Gyasi-Agyei, Y. and Pegram, G., 2014. Interpolation of daily rainfall networks using simulated radar fields for realistic hydrological modelling of spatial rain field ensembles. Journal of Hydrology, 519, 777–791. doi:10.1016/j.jhydrol.2014.08.006
- Hadjinicolaou, P., et al., 2011. Mid-21st century climate and weather extremes in Cyprus as projected by six regional climate models. Regional Environmental Change, 11, 441–457. doi:10.1007/s10113-010-0153-1
- Harman, C.J., Troch, P.A., and Sivapalan, M., 2011. Functional model of water balance variability at the catchment scale: 2. Elasticity of fast and slow runoff components to precipitation change in the continental United States. Water Resources Research, 47, W02523. doi:10.1029/2010WR009656
- Hoerling, M., et al., 2012. On the increased frequency of Mediterranean drought. Journal of Climate, 25, 2146–2161. doi:10.1175/JCLI-D-11-00296.1
- Krzywinski, M. and Altman, N., 2014. Points of significance: visualizing samples with box plots. Nature Methods, 11, 119–120. doi:10.1038/nmeth.2813
- Lana-Renault, N., et al., 2014. Spatial and temporal variability of groundwater dynamics in a sub-Mediterranean mountain catchment. Hydrological Processes, 28, 3288–3299. doi:10.1002/hyp.v28.8
- Lelieveld, J., et al., 2014. Model projected heat extremes and air pollution in the eastern Mediterranean and Middle East in the twenty-first century. Regional Environmental Change, 14 (5), 1937–1949. doi:10.1007/s10113-013-0444-4
- Li, C.Z., et al., 2012. The transferability of hydrological models under nonstationary climatic conditions. Hydrology and Earth System Sciences, 16, 1239–1254. doi:10.5194/hess-16-1239-2012
- Liuzzo, L., et al., 2010. Basin‐scale water resources assessment in Oklahoma under synthetic climate change scenarios using a fully distributed hydrologic model. Journal of Hydrologic Engineering, 15, 107–122. doi:10.1061/(ASCE)HE.1943-5584.0000166
- Maxwell, R.M. and Kollet, S.J., 2008. Interdependence of groundwater dynamics and land-energy feedbacks under climate change. Nature Geosciences, 1 (10), 665–669. doi:10.1038/ngeo315
- Mederer, J.M., 2009. Water Resources and dynamics of the Troodos igneous aquifer-system, Cyprus. Thesis (PhD). University of Wurzburg.
- Moriasi, D.N., et al., 2007. Model evaluation guidelines for systematic quantification of accuracy in watershed simulations. Transactions of the ASABE, 50 (3), 885–900. doi:10.13031/2013.23153
- Nash, J.E. and Sutcliffe, J.V., 1970. River flow forecasting through conceptual models part I — a discussion of principles. Journal of Hydrology, 10, 282–290. doi:10.1016/0022-1694(70)90255-6
- Oudin, L., et al., 2006. Dynamic averaging of rainfall–runoff model simulations from complementary model parameterizations. Water Resources Research, 42, W07410. doi:10.1029/2005WR004636
- Perrin, C., Michel, C., and Andréassian, V., 2001. Does a large number of parameters enhance model performance? comparative assessment of common catchment model structures on 429 catchments. Journal of Hydrology, 242 (3–4), 275–301. doi:10.1016/S0022-1694(00)00393-0
- Perrin, C., Michel, C., and Andréassian, V., 2003. Improvement of a parsimonious model for streamflow simulation. Journal of Hydrology, 279 (1–4), 275–289. doi:10.1016/S0022-1694(03)00225-7
- Perrin, J-L. and Tournoud, M-G., 2009. Hydrological processes controlling flow generation in a small Mediterranean catchment under karstic influence. Hydrological Sciences Journal, 54 (6), 1125–1140. doi:10.1623/hysj.54.6.1125
- Shen, C. and Phanikumar, M.S., 2010. A process-based, distributed hydrologic model based on a large-scale method for surface - subsurface coupling. Advances in Water Resources, 33 (12), 1524–1541. doi:10.1016/j.advwatres.2010.09.002
- Tsiourtis, N.X., 2004. Desalinisation: the Cyprus experience. European Water, 7/8, 39–45.
- Udluft, P., Kulls, C., and Schaller, J., 2006. Re-evaluation of the groundwater resources of Cyrus - GRC project report. Nicosia: Geological Survey Department of Cyprus.
- Vaze, J., et al., 2010. Rainfall-runoff modelling across southeast Australia: datasets, models and results. Australian Journal of Water Resources, 14 (2), 101–116.
- WDD (Water Development Department). 2011. Cyprus River Basin Management Plan - Annex VII. Final report on water policy (in Greek). Nicosia, Cyprus: Water Development Department of Cyprus.