
Abstract
Interactions between surface water and groundwater systems in fractured rock environments, covering large parts of southern Africa, are poorly understood, such that modelling the different water balance components is highly uncertain. Some of these uncertainties are highlighted and attempts are made to resolve them using hypothesis testing with an uncertain ensemble version of the widely used Pitman hydrological model that includes relevant groundwater components. Five study catchments are used to represent many of the major uncertainties in linking surface and groundwater resources, including the relative importance of deep unsaturated zone drainage, the balance between recharge and losses through riparian evapotranspiration and channel transmission losses. The study demonstrates that some uncertainties can be reduced, but this also involves making a number of assumptions about other aspects of a catchment water balance that can be conceptually supported but not completely validated with available data. The remaining uncertainties need to be resolved through improved process quantification and understanding, possibly using environmental tracers.
Editor D. Koutsoyiannis; Guest editor G. Mahé
Résumé
Les interactions entre eaux de surface et eaux souterraines dans les milieux fracturés, qui couvrent une grande partie de l’Afrique australe, sont mal connues, à tel point que la modélisation des différentes composantes du bilan hydrologique est très incertaine. Certaines de ces incertitudes seront pointées ici et on tentera de les appréhender en utilisant un test d’hypothèse en utilisant une version d’ensemble incertaine du modèle hydrologique bien connu de Pitman, qui inclut les composantes hydrogéologiques adéquates. Cinq bassins versants ont été utilisés pour représenter la plupart des grandes incertitudes dans la liaison surface - souterrain, y compris l’importance relative du drainage profond de la zone non saturée, l’équilibre entre la recharge et les pertes par évapotranspiration dans les berges et par transmission en chenal. L’étude démontre que certaines incertitudes peuvent être réduites, mais cela implique aussi de faire un certain nombre d’hypothèses sur d’autres aspects du bilan hydrologique du bassin versant qui peuvent être soutenues conceptuellement mais pas complètement validées avec les données disponibles. Les incertitudes qui subsistent devront être résolues grâce à une meilleure quantification et compréhension des processus, en utilisant par exemple des traceurs environnementaux.
1 INTRODUCTION
The interactions between surface water and groundwater (SW/GW) systems remain poorly understood in many catchments throughout the world and yet they are essential to effectively managing the quantity and quality of water resources. It has been well documented that these systems interact in a range of geological, topographical and climatic settings and that many surface water features, such as rivers, lakes, dams and wetlands will have varying degrees of connection with groundwater systems (Ivkovic Citation2009, Fleckenstein et al. Citation2010, Haria et al. Citation2013). There are a number of comprehensive reviews of the current understanding of the physical interactions that occur between groundwater and surface water systems (Winter Citation1999, Sophocleous Citation2002, Brunner et al. Citation2009, Unland et al. Citation2013, Lamontagne et al. Citation2014). Within South Africa the focus has tended to be more on management issues surrounding the interactions between surface water and groundwater (Xu et al. Citation2002, Parsons Citation2004, Le Maitre and Colvin Citation2008, Hughes Citation2010, Levy and Xu Citation2012), while some contributions have focused on the physical processes behind the interactions, albeit through relatively small-scale studies (Hughes and Sami Citation1992, Lorentz et al. Citation2004, Roets et al. Citation2008, Wenningger et al. Citation2008, Kelbe and Germishuyse Citation2010). One of the limiting factors in trying to understand and quantify interaction processes at scales appropriate for regional water resources management is the lack of direct data available to quantify almost all of the individual processes, from recharge, through vertical drainage, to the interactions between aquifers and river channels. This is particularly true for fractured rock aquifers, which are highly heterogeneous and are the dominant aquifer type in southern Africa. A further limitation is the general lack of availability (for desktop studies at the catchment scale) of structural geological information, which would be extremely useful in understanding the likely dynamics of sub-surface water movement, particularly the type of information that supports model development for water resource determinations. Structural geological information that has been translated into improved information on recharge and groundwater discharge is rarely available, largely due to the difficulty in understanding complex groundwater systems.
While there have been contributions that have improved the conceptual understanding of fractured rock aquifers (Berkowitz Citation2002, Nastev et al. Citation2004, Rodhe and Bockgard Citation2006), there is still a large amount of uncertainty associated with the specific characterization of individual aquifers. The inherent structural and hydraulic complexity of fractured rock systems severely limits the type and quality of data that can be obtained from field measurements. Voss (Citation2003) suggested that a priori characterization of fractured systems might be impossible, but Krásný and Sharp (Citation2007) suggested that, at the larger scale, the average permeability remains roughly constant and therefore represents a regional transmissivity value that corresponds to a representative storage. This is an important concept for models as it suggests to what extent hydrogeological conditions can be represented. Some investigations into fractured rock environments (using any type of model) assume a quasi-homogeneous flow through the bedrock by taking into account conductivity ranges as determined from hydraulic aquifer tests (Illman and Neuman Citation2000) and the effects of structures such as faults and fractures are averaged.
Within South Africa, as well as many other parts of the world, the type of model favoured by groundwater hydrologists (Levy and Xu Citation2012) differs from those typically used by predominantly surface water hydrologists (Hughes Citation2004). The former have favoured detailed numerical finite difference or finite element models, while the latter have concentrated on conceptual type, water balance models. The application of any type of model suffers from problems of a lack of specific data and system understanding to establish a model at a specific site and therefore adding complexity does not necessarily make a model better (Beven Citation1989). From a practical perspective the selection of a model primarily resolves around the purpose of the modelling exercise, as well as the availability of time, data and the model user’s training and experience (Ivkovic et al. Citation2009). Individual models have advantages and disadvantages and it is important to view different model approaches as complementary, with each approach providing different insights into a system and outputs that are used for different purposes.
The model used in this study is the conceptual type, monthly time-step, Pitman model that was modified to include more explicit groundwater components by Hughes (Citation2004). The model has been successfully used for water resources assessments in South Africa and other parts of Africa for many years (Hughes Citation2013). The objective of including the groundwater components was not to compete with existing numerical groundwater models (which are successfully used for the detailed design of groundwater abstraction developments), but to provide a more integrated modelling tool for regional water resources assessments that could account for surface water and groundwater and their interactions. The objective of this study was to first of all identify some of the conceptual understanding uncertainties associated with SW/GW interactions in typical fractured rock aquifer situations and secondly to assess whether the model can be used to resolve some of the uncertainties by testing different “hypotheses about environmental processes” (Beven Citation2012). Inevitably, a more fundamental issue arises before the latter question can be answered and that is whether the model structure is appropriate for representing the relevant processes and testing different hypotheses. This issue has been addressed in several previous applications of the model (Hughes Citation2004, Citation2009, Hughes et al. Citation2006, Citation2010, Citation2014, Tanner and Hughes Citation2013), but will also be addressed here.
2 CATCHMENT-SCALE REPRESENTATION OF SW/GW INTERACTIONS AND UNCERTAINTIES
presents a conceptual diagram of the main SW/GW interaction processes that are assumed to occur at the catchment scale and raises some key questions about the uncertainties involved in both understanding and quantifying these components of the overall water balance. The seven notes (A–G) are not designed to be an exhaustive list of all possible sources of uncertainty, but have been highlighted as some of the key issues on the basis of our experience of simulating a wide range of different catchment conditions, as well as on uncertainties referred to in the international literature.
Fig. 1 Catchment-scale processes associated with surface water and groundwater interactions and some of the key questions related to understanding and modelling.
Note A refers to the dominant mechanism of recharge and whether the main determining factor is likely to be the characteristics of rainfall events (Dawes et al. Citation2012) or the near surface moisture storage state (Cuthbert et al. Citation2013). While these are clearly important issues, they cannot really be resolved within a model that operates at a monthly time step. Ireson et al. (Citation2009) and Jiménez‐Martínez et al. (Citation2013) refer to the structural controls on the rate and type of movement of recharging water through the unsaturated zones of fractured rock systems and Notes B and C refer to similar issues. Hughes (Citation2009, Citation2010) noted the existence of a lateral flow component in recharging water that can result in re-emergence as springs above the level of the regional aquifer (Note B) and that these situations are similar to perched aquifers (Note C). One of the important issues is that, if this process of unsaturated zone re-emergence does exist, estimates of recharge to the regional aquifer based on different methods could be very different (Rushton and Ward Citation1979, Landon et al. Citation1999, De Vries and Simmers Citation2002). The existence of this process is also important from the perspective of the source of low flows in rivers and the likely impacts of abstractions from the regional aquifer. If a large proportion of the low flow regime is contributed from unsaturated zone springs then abstractions would have a negligible impact (Hughes Citation2010).
Note D refers to uncertainties in the parts of the channel network that can be considered to be receiving groundwater contributions to streamflow and the area of the catchment where groundwater is likely to be close enough to the surface to be subject to direct evapotranspiration losses from riparian vegetation. This is potentially an important issue in many semi-arid areas, where riparian evapotranspiration losses can intercept groundwater draining towards a river channel (Hughes Citation2009). Note E refers to the situation where groundwater levels are below the channel and intermittent surface runoff events can contribute to groundwater through channel transmission losses. The uncertainties in this process are often exacerbated by the presence of alluvial material forming sometimes small but significant aquifers in valley bottoms that have very different properties to the underlying fractured rock aquifer. At the catchment scale, the major uncertainties are associated with the relationships between channel flow and rates of loss (Lange Citation2005) as well as with the interconnection between the alluvial aquifer and the underlying hard rock aquifer. The latter issue will partly determine the storage capacity that is available for transmission losses (Dahan et al. Citation2008).
Note F refers to the coincidence of surface and groundwater catchments and whether significant proportions of recharge over one surface water catchment can be expected to be transferred to adjacent catchments. Within South Africa this has been the basis of one of the major criticisms of the use of catchment-based hydrology models compared to numerical groundwater models that operate with aquifer units (Department of Water Affairs and Forestry Citation2008a) that are independent of surface topography. Marklund and Wörman (Citation2007) maintain that landscape topography is the most important driving force for groundwater flow, but there are likely to be some specific structural situations where this is not the case and where groundwater drainage (or recharging water) can move across surface water catchment boundaries (Department of Water Affairs and Forestry Citation2008a). The final note refers to groundwater abstractions and the influence of borehole location relative to the groundwater discharge area in river channels (Cook et al. Citation2003). While this issue may be of less importance in catchment-scale and coarse time-scale modelling, it is nevertheless an important source of uncertainty. Certainly, groundwater abstractions are expected to reduce baseflow contributions or increase transmission losses (Braaten and Gates Citation2003).
3 THE PITMAN MODEL WITH MODIFIED GROUNDWATER COMPONENTS
The model is semi-distributed and uses independent parameter sets and climate forcing data for each defined sub-basin. The full details of the model are available in several relatively recent publications (Hughes et al. Citation2006, Hughes Citation2013) and are not repeated here. However, the important components and parameters that are relevant to this study are summarized in . Apart from the components referred to in , the full model also includes interception, evapotranspiration, surface runoff and routing components, as well as a number of options to allow for anthropogenic impacts (small dams, larger reservoirs, direct abstractions from the channel and groundwater, etc.). The interflow function can be used to represent near surface soil moisture drainage, as well as deeper unsaturated fracture drainage (Hughes Citation2010), given that ST is set to represent this storage zone as well. The recharge component is also a function of unsaturated zone storage state, but as noted earlier this should not be too restrictive within a monthly time-step model, where short-term rainfall intensities are not accounted for. Even if recharge processes are dominated by rainfall amounts rather than moisture deficits, high monthly rainfalls in the model will always be reflected in higher moisture storage levels.
Table 1 Components and parameters of the Pitman model associated with SW/GW interactions.
Although the simple groundwater geometry used in the model is highly conceptual (rather than being a more physical representation of reality as in most numerical groundwater models), the catchment-scale effects of increased (decreased) recharge leading to increased (decreased) discharge and differing delays or attenuation effects can be represented by differences in the storativity and transmissivity parameters. Riparian evapotranspiration losses are accounted for, as are channel transmission losses, albeit in a relatively inflexible and highly uncertain manner. This reflects a typical lack of hard data to define the dynamics of channel transmission loss processes. Groundwater movement out of the surface water catchment is allowed for, but only in a downstream direction in the current version of the model.
The model therefore has components that can be used to pose hypotheses about most of the process uncertainties referred to in . However, this also means that the model is subject to quite high degrees of equifinality if the results are assessed using a single assessment criterion, such as observed streamflow response. For example, experience suggests that it is typically possible to simulate the low-flow regime of rivers with many combinations of the interflow (FT and POW) and recharge (GW, SL and GPOW) parameters. If constraints can be placed on the simulated recharge values, the equifinality inevitably decreases. The model can be operated to generate a single simulated time series using one set of fixed parameters, or it can be run within an uncertainty framework using parameter distributions (normal or uniform) and simple independent Monte Carlo random sampling to generate 10 000 ensembles. There is also an option to include several ranges of output constraints (mean monthly streamflow and recharge, three percentage points of the flow duration curve and percentage of time of zero flows) that are used to limit the output ensembles to those that are behavioural relative to the input constraint boundaries. In this case the model is typically run 100 000 times or until 2000 behavioural parameter sets are found (Hughes Citation2013, Tumbo and Hughes Citation2015). Model assessments are based on four objective functions; Nash-Sutcliffe (Nash and Sutcliffe Citation1970) coefficient of efficiency values for un-transformed (CE) and natural log-transformed (CE{ln}) data and the bias of simulated mean flow relative to observed mean flow (Bias and Bias{ln}).
4 CATCHMENT MODEL ASSESSMENTS
In this study a number of catchment assessments have been made on the basis of how they can be used to represent some of the uncertainty issues referred to in . Most of the case study locations are underlain by fractured sedimentary aquifers, which cover 55% of the land area in South Africa, Swaziland and Lesotho. The number of catchments is too large to provide detailed descriptions (or location maps) within a single paper. This paper limits the descriptions to the salient points needed to understand the key issues of uncertainty in SW/GW interaction modelling and references are provided where further detail about the catchments can be obtained. Unfortunately, many of these references are based on “grey” literature rather than published papers; an unavoidable situation in a country where many of the relevant studies are government consultancy contracts. In most cases some initial runs of the uncertainty model were used to fix the non-groundwater parameters so that during later runs the total parameter equifinality was reduced, allowing a greater focus on the uncertainty in some of the groundwater parameters.
4.1 Unsaturated zone interflow
The Ecca River (33.21°S, 26.68°E) example was also referred to in Hughes (Citation2010) and represents an arid area in the Eastern Cape Province with streamflow dominated by very short events following high rainfall. The catchment is characterized by steep slopes and very thin soils except in some alluvial/colluvial areas bordering the downstream parts of the main channel. The geology consists of steeply dipping and highly fractured shales and sandstones. A 9.1-km2 tributary catchment has been used here to try and identify the source of rare baseflows that occurred during and after two major rainfall events in July and August 1979. illustrates that the measured streamflow continued for approximately 110 days after the second rainfall event, despite field observations that little near surface moisture existed some 7–10 days after the main rainfall. The prolonged baseflows could not be attributed to groundwater contributions from the regional aquifer as these water levels remained at greater than 15 m below the channel bed at all times. Because of the short duration of the event, a daily version of the Pitman model (Hughes et al. Citation2014) has been used to explore possible behavioural parameter values as a guide to likely processes. The previous daily version was slightly modified to include a similar form of the routing equation used in the monthly model (Pitman Citation1973), but applied only to the simulated surface runoff. The latter was included to smooth the effect of large daily values of surface runoff and to see if the routing function could account for the prolonged baseflows. The model was run 1000 times using simple Monte Carlo sampling from uniform parameter distributions, and an initial run with FT () set to 0 revealed that, regardless of the routing parameter value, the baseflows could not be generated. lists the ranges of the uniform distributions used in the second run, while two of the lines on illustrate the full range of the simulated flow depths. includes a parameter set for one of the best results (also shown on ) based on all three objective functions (CE = 0.73, CE (ln) = 0.67, Bias = 4.2%).
Table 2 Parameters of the daily version of the Pitman model used for the Ecca River example (ZMIN and ZMAX are parameters of the surface runoff function, while R is part of the evapotranspiration routine).
Fig. 2 Uncertainty analysis results of the application of the daily version of the model for the Ecca catchment.
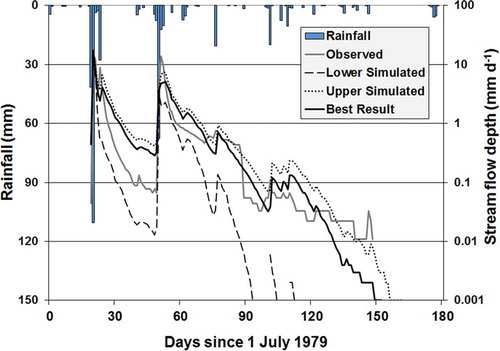
The same parameters were applied to a longer period (February 1979 to December 1980) in which there were only two additional runoff events (all less than 0.3 mm d-1), while the simulations generated some longer periods of small flows. The implication is that the model structure is too simple to correctly capture the complex surface and sub-surface runoff processes that might include delays in the interflow contributions, re-infiltration of some surface runoff, as well as evaporative losses from the channel margins. However, the model has helped to demonstrate the existence of a prolonged interflow component that occurs after heavy rainfall which cannot be linked to drainage from the regional aquifer or to drainage from the soil profile.
The headwaters of the Sabie River (25.08°S, 30.78°E) drain the steeply sloping eastern escarpment of South Africa within Mpumalanga Province. The underlying geology consists of quartzites and shales with a band of dolomite. Streamflows are observed at the gauging station X3H001 (catchment area of 173 km2) and the most evident feature of the response is a very high wet season baseflow component during wet years that is not present during very dry years when the low flows are relatively constant throughout the year. Hughes (Citation2010) ascribed this type of response to mixed processes of low-flow generation that included a relatively slowly varying groundwater drainage component and a much more seasonal unsaturated zone drainage component that is probably dominated by the dolomitic compartments. The assumption is that the unsaturated zone is highly reactive and that recharge during the wet season of dry years is too low to replenish the storage that would be depleted at the end of the previous dry season. The uncertainty version of the model with quite large parameter ranges was used together with three different periods of observed data: the total usable record of 1966–2005, the dry periods only (1981–1984 and 1991–1994) and wet periods only (1973–1977 and 1996–2001). An additional objective function (CE{Inv}, Nash-Sutcliffe using an inverse transformation) was included to further emphasise low flows. lists the groundwater parameter values and uncertainty ranges that were used in all model runs, as well as the overall best parameter sets identified for each period but based on comparisons with the full observed period.
Table 3 Parameters and objective functions for the “best” Sabie River ensembles for each test period compared with the full time series of observed data (fixed parameters; POW = 2.5, GPOW = 3.5; SL = 0, SLG = 0).
The results confirm a high degree of equifinality between FT and GW, while the sum of these parameters is relatively well identified within all of the behavioural ensembles (those with low bias statistics and higher values for the sum of the CE statistics). The wet period suggests the highest combination of FT and GW, but the resulting parameter sets tend to over-simulate for the total period (). Both T and S are not very identifiable, but there is a generally positive relationship between these two parameters. If higher S values (promoting lower fluctuations in groundwater storage) are associated with lower T values (slower outflows), these are typically accompanied by higher GW values that will increase the variability in groundwater storage to compensate. The last two columns of list two parameter sets that fall within all of the identified behavioural sets; the first (SC1) assumes dominance of interflow, while the second (SC2) assumes dominance of groundwater recharge and drainage. The first assumes that the dolomitic compartments are of the interflow component and that the groundwater will have low storativity and low transmissivity. The second assumes that at least part of the dolomitic storage is part of the groundwater system, which consequently has higher recharge, storativity and transmissivity. presents the seasonal distributions of the mean monthly simulated interflow and groundwater drainage outputs for SC1 and SC2.
Fig. 3 Mean monthly simulated components of the total baseflow (interflow and groundwater drainage) for the two Sabie River example scenarios.
The simulation results are very similar for the two scenarios, but under SC1 the mean baseflows are dominated by the interflow component and the seasonal variation in the deeper groundwater response is quite small. Under SC2 the groundwater drainage is higher with a greater amplitude of seasonal variation. This is offset by a smaller interflow response with a lower seasonal variation than in SC1. Both simulations are equally able to simulate the low baseflow response in the two extended dry periods of 1981–1984 and 1991–1994. The overall conclusion is that the model is not able to contribute to distinguishing between unsaturated zone and groundwater contributions to total baseflow in this catchment. Arguably, this could be because the dolomitic compartments, which almost certainly represent the majority of the sub-surface storage, can be represented in the model as either part of the unsaturated zone or as part of the main aquifer. The total baseflow delay is slightly longer for SC2 () and this might be reflected in the slightly worse low-flow results (CE{ln} and CE{Inv}), but the differences are small. The dolomitic zones of this catchment have therefore been well represented by both scenarios, but in different ways.
4.2 Balancing recharge, natural groundwater losses and abstractions
Apart from identifying the sources of low flows (previous section), it is also important to be able to correctly partition groundwater recharge if we wish to quantify the level of sustainable abstractions and their impacts on stream flow. Two example catchments (Breede and Crocodile river basins) are used in this section, both of which have been the subject of previous investigations, and in which there are uncertainties in the balance between recharge and groundwater losses through riparian evapotranspiration and abstractions. In the Breede River, previous studies also identified a groundwater flow component to adjacent surface water catchments (Department of Water Affairs and Forestry Citation2008a).
The headwaters of the Breede River (33.3.38°S, 19.03°E) have been the subject of several hydrological and geohydrological investigations (Department of Water Affairs and Forestry Citation2008a, Hughes and Mantel Citation2010a, Citation2010b, Tanner Citation2013, Hughes et al. Citation2014). Most of the uncertainties are associated with the complex topography and geology together with extensive water use for the production of deciduous fruit. The topography consists of steep mountain areas surrounding a broad and relatively flat alluvial/colluvial valley and contributes to many uncertainties in the rainfall inputs. The geology consists of steeply folded and faulted sequences of Witteberg sandstones, Bokkeveld mudstones and Table Mountain Group (TMG) sandstones, linked to the alluvial and colluvial valley fill. Department of Water Affairs and Forestry (Citation2008a) refers to the possibility of regional transfers of groundwater through the TMG in the lower parts of the catchment. Hughes and Mantel (Citation2010a, Citation2010b) referred to uncertainties in the water use from a large number of farm dams, but Department of Water Affairs and Forestry (Citation2008a) identified that some of the water use is from groundwater.
The focus of this study was to try and resolve some of the uncertainties in the SW/GW interaction water balance at the coarse scale of the total catchment (657 km2) and some of the other uncertainties were ignored and assumptions made about appropriate ways to simulate the surface hydrology to avoid excessive equifinality. These assumptions were based on a combination of the previous modelling results together with some preliminary runs of the uncertainty model (not included here). lists the parameters for which uncertainty was retained in the main run of the model and includes an explanation of the possible sources of uncertainty. The evaluations were based on the observed data available at gauge H1H003 since 1970 to avoid too much non-stationarity in water use. The best values within the 10 000 ensembles for CE and CE{ln} were 0.68 and 0.76, respectively, and the criteria for behavioural simulations were therefore set using limits of approximately 10% less than the best values (i.e. CE ≥ 0.61 and CE{ln} ≥ 0.68). The percent bias values were largely ignored because of the possibility of errors in the observed data, particularly with respect to high-flow measurements. This selection produced 559 ensembles that can be considered behavioural with respect to the observed flows. A second selection criterion was based on the assumption that the total water use was approximately ±10% of the median value used by Hughes and Mantel (Citation2010a), i.e. 39 ± 4 × 10⁶ m3. This reduced the set of behavioural ensembles to 175.
Table 4 Uncertain parameters used for the Breede River catchment.
) illustrates the relationship between groundwater recharge and an index of total losses from groundwater using a combination of the GW slope, Riparian strip (RIP) and GW abstraction parameters. The available recharge estimates vary from 2.0 to 6.3 mm month-1 (Department of Water Affairs and Forestry Citation2005, Citation2008a), while ) suggests that values of less than 3.5 mm month-1 are unlikely. ) plots the relationship between the two water uses for the two behavioural ensemble sets and there is a greater density of points with relatively high farm dam use and low groundwater abstraction. The Department of Water Affairs and Forestry (Citation2008a) estimate of 20.6 × 10⁶ m3 groundwater abstraction is therefore plausible, but less probable than a lower value. ) and (d) show the relationship between recharge and groundwater abstraction for the final behavioural ensemble set based on limiting total water use. ) identifies those points that have low (<0.02) or high (>0.04) values for the GW slope parameter that determines transfers to adjacent catchments and equate to annual transfer volumes of 0.33 and 0.66 × 10⁶ m3 year-1, respectively, compared to the Department of Water Affairs and Forestry (Citation2008a) estimates of 0.1–0.8 × 10⁶ m3 year-1. The model is largely insensitive to variations in this parameter, partly because of the relatively small volumes. ) illustrates that the results are more sensitive to RIP and evaporative losses, partly because this is a winter rainfall region with high evaporative demands during the dry season. The two limits (<1.0% and >1.5%) used in ) represent volumes of approximately 10.9 and 16.4 × 10⁶ m3 year-1, respectively, given no limitation on the supply of water. The higher values of RIP are considered unlikely given the high level of irrigation development in the valley bottom areas and the absence of natural riparian vegetation.
Fig. 4 Breede River uncertainty results: (a) recharge versus an index of total GW loss; (b) comparison of the two abstraction volumes; (c) impact of GW gradient parameter; and (d) impact of riparian strip parameter.
The model is able to simulate a relatively wide range of different SW/GW interactions at the scale of the total catchment and some of the uncertainty bounds have been reduced (given some assumptions about other aspects of the model) such that the groundwater balance can be summarized by:
Mean monthly groundwater recharge of between 42 and 54 mm year-1, which represents a volume of 27.6 and 35.5 × 10⁶ m3 year-1.
Between 10 and 18 × 106 m3 year-1 is likely to be abstracted from groundwater, less than 0.8 × 10⁶ m3 year-1 transferred to adjacent catchments, less than about 11 × 106 m3 year-1 lost to evapotranspiration and the remainder contributing to stream flows.
Further reductions in uncertainty would require the collection of additional information. Obtaining better abstraction information is achievable, albeit with a substantial amount of fieldwork, while confirming some of the other water balance components is likely to be much more difficult, if not impossible, at the scale of the whole catchment.
A similar approach has been adopted for a 515 km2 tributary of the Crocodile (West) River (25.64°S, 27.03°E) catchment using stream flow gauge A2H032. Mean annual rainfall and potential evaporation are approximately 600 and 1750 mm year-1, respectively, the topography is relatively flat (except in some areas with incised channels), and the catchment is underlain by fractured quartzites, shales and dolomites. The initial uncertainty runs were focussed on identifying appropriate values for the main surface runoff parameters, fixing these and then concentrating on the groundwater uncertainties. The whole of the Crocodile (West) River catchment was the subject of a previous study of groundwater availability and abstractions (Vivier et al. Citation2007), while some sub-catchments were included in the Tanner (Citation2013) study. One of the major sources of uncertainty identified by Tanner (Citation2013) was the amount of groundwater lost to riparian evapotranspiration relative to the recharge and groundwater usage. Vivier et al. (Citation2007) referred to relatively high mean annual recharge volumes of 6.7 × 10⁶ m3 year-1 (13 mm year-1) and riparian evapotranspiration losses of 11 × 106 m3 year-1, the difference being made up from channel transmission losses. However, this represents a very high value for riparian losses and would require some 1.2% of the total catchment area to be contributing to these losses. An examination of Google Earth images suggests that there could be up to 60 km of channels (effective drainage density of 0.18 km km-2) contributing to groundwater riparian losses, and that the riparian strip is less than 50 m. These values are based on the visual evidence of riparian vegetation.
Establishing appropriate parameters for the surface water components of the model proved to be difficult when the model evaluations were based on the objective functions typically used with the model. There is frequently very poor correspondence between simulated and observed flows for individual months, possibly related to poor rainfall data. However, the shape of the observed flow duration curve (FDC) could be well simulated. The evaluation of the simulated groundwater interactions was therefore based on the low flow component of the FDC and specifically the percentage time of zero flow, which in the observed records was 62%. The interflow function of the model was not used (FT = 0), while the surface runoff parameters were manually calibrated to accurately represent the low frequency of exceedence part of the FDC (20% and lower). Water use data (small farm dams and groundwater) were based on data given in Department of Water Affairs and Forestry (Citation2008b). Only GW, GPOW and RIP were then treated as uncertain and summarizes the results for all ensembles where the simulated 50th FDC percentile is zero. Within these ensembles (5302) the percentage time of zero flows varies from 50% to 67% (observed: 62%). The overall conclusion is that the behavioural recharge depth is less than 0.8 mm month-1 (4.94 × 10⁶ m3 year-1 or 1.6% of rainfall) and that the majority is lost to riparian evapotranspiration with some used for irrigation (0.37 × 10⁶ m3 year-1, based on Department of Water Affairs and Forestry (Citation2008b)).
Fig. 5 Relationship between recharge and riparian strip evapotranspiration parameter (RIP) for the Crocodile River tributary for ensembles with the 50th FDC percentile equal to zero (the open squares are for RIP values of ≤ 0.6%).
4.3 Channel transmission losses and aquifer de-watering
Simulations of catchment scale channel transmission losses are extremely difficult to validate due to the lack of real data (Shanafield and Cook Citation2014). The Gamagara River (27.84°S 22.98°E) in the Northern Cape Province of South Africa represents a situation where it is possible to use some observed groundwater level data to assess the ability of the model to simulate the transfer of water from the channel during rare flow events as well as the effects of these transfers on groundwater dynamics. This is a very arid area, with mean annual rainfall of 400 to 600 mm year-1 and high potential evaporation rates (>2000 mm year-1). The Sishen open-cast iron ore mine is located within the catchment, and aquifer de-watering began in 1967 with annual abstractions stabilizing at between 10 and 15 × 106 m3 year-1 after about 1981 (Bredenkamp and De Jager Citation2011). The assumption is that the de-watering resulted in additional transmission losses from the rare flow events, an assumption supported by anecdotal evidence about reductions in the frequency of flow events from local residents (Bredenkamp and De Jager Citation2011). A series of observation boreholes indicate that prior to de-watering groundwater levels near the river fluctuated between 10 and less than 1 m below the surface with a low amplitude of variation. After de-watering levels dropped to as much as 60 m below the surface, but also showed greater degrees of fluctuation which were associated with heavy rainfall events in the catchment. Fluctuations in water level for boreholes located away from the de-watered zone and distant from the channel are approximately between 5 and 30 m below the surface. The model was set up with four sub-catchments, two representing tributary inflows (A = 356 and B = 1451 km2), one representing the de-watered zone (C = 316 km2) and one below the de-watered zone (D = 1522 km2). There are no observed stream flow data and therefore the patterns of simulated stream flows (before losses due to de-watering) were aligned to existing model results (Midgley et al. Citation1994) and the focus of the study was on the simulated impacts of channel losses on borehole levels. As the model does not simulate groundwater levels directly (), it was necessary to use the simulated GW slope element gradients (α in )) to estimate GW depths.
Fig. 6 Groundwater conditions for the Gamagara River example: (a) model concepts; and (b) real conditions.
In the absence of de-watering the inclusion of the channel transmission loss function in the model has very small effects on the simulated flows largely because of the relatively low volume of groundwater storage available. The simulations of groundwater levels in the sub-catchments are a reasonable reflection of the observed data () and ()). Borehole BH-162 is close to the outlet of the tributary A, while boreholes BH-193 and BH-396 are just upstream and downstream of the boundary between sub-catchments C and D. ) illustrates the observed and simulated groundwater levels for sub-catchment C after de-watering based on an annual abstraction rate of 13 × 106 m3 year-1. ) shows the results for sub-catchment D (with an additional borehole (BH-214) that is close to BH-396) for simulations with and without de-watering and spanning the period when the de-watering reached a peak between 1977 and 1981. The model was established with groundwater parameters taken from previous reports (Department of Water Affairs and Forestry Citation2005, Bredenkamp and De Jager Citation2011), but one of the observations was that the storativity value for sub-catchment C had to be reduced (from 0.015 to 0.008) for the simulation based on de-watering. This was considered justified on the assumption that before de-watering the majority of the groundwater fluctuations were within the alluvial material or near surface fractured rock, while afterwards they are within more massive rock layers.
Fig. 7 Gamagara River results (simulated and observed groundwater levels: (a) sub-catchment A; (b) sub-catchment C without de-watering; (c) sub-catchment C with de-watering; and (d) sub-catchment D with and without de-watering (m bgl: metres below ground level).
) and () suggests that the simulations unaffected by de-watering generate results that approximately represent the observed borehole level variations, despite the highly conceptualized nature of the model algorithm ()). ) suggests that the variations in a borehole close to the river channel (BH-195) within the main de-watering zone are also simulated quite well after de-watering began, but that the rest water level parameter value of 55 m (below which there are no storage changes) could possibly be improved. Borehole BH-195 is some 2.5 km distant from the channel and the delayed effects of transmission loss increments to groundwater are evident, but these cannot be simulated by the model. ) shows the results for the downstream sub-catchment, spans periods than exclude and include de-watering, and includes simulations with and without de-watering effects. The de-watering effects here are related to reduced transmission losses and lower sub-surface movements from sub-catchment C after de-watering. The observed borehole levels are closer to the no de-watering simulations before about 1976, but closely follow the de-watered simulations afterwards. The simulations suggest that the reduction in total mean monthly streamflow from de-watering is approximately 20%. Some of the uncertainties inherent in these results include a lack of detailed information about how much groundwater was abstracted between 1967 (de-watering started) and when it stabilized after about 1981. Additional uncertainties exist in the simulations of the flow event volumes and therefore the volumes available for transmission losses, as well as the very simplified loss function used in the model. Despite these, and the limitations of connecting simulated groundwater gradients with actual groundwater levels, the model has adequately reproduced the real world situation.
5 CONCLUSIONS
From a modelling perspective, the overall conclusion of the study is that the Pitman model with the revised groundwater routines is a useful tool for exploring different hypotheses (Beven Citation2012) about some of the processes involved in SW/GW interactions at the catchment scale. However, in the absence of critical field information, the model is not always able to help resolve some of the uncertainties that exist. Unfortunately, such information is frequently not available and therefore these uncertainties remain regardless of the type of model that is used.
With reference to the questions raised in the introduction (), Note A referring to the nature of the recharge process is considered here to be largely irrelevant. The Ecca River example clearly indicates that deep unsaturated zone lateral drainage has to be considered as a potentially important process. Hughes (Citation2009) indicated that it will not always be possible to determine whether such processes are associated with fracture alignment or the existence of perched aquifers, while, in some catchments (Sabie River), distinguishing between the low-flow contributions to streamflow from lateral unsaturated zone drainage and drainage from the underlying aquifer may not be possible without further field information. Note D refers to the interactions between aquifers and the channel network, and specifically what area of the catchment is likely to be affected by riparian zone evapotranspiration from groundwater. Both the Breede and Crocodile river examples addressed this issue, one in a relatively wet and mountainous area, the other in a more semi-arid situation with ephemeral flows. In both cases some of the uncertainties in the groundwater volumetric balance were reduced with the help of the model together with some assumptions based on field information about the likely area of riparian evapotranspiration losses. In both catchments the total model equifinality was reduced by first of all establishing (and fixing) the parameters of the model that focus on the generation of surface water balance components.
The question raised in Note E will always be difficult to answer, but the Gamagara River example provides some further insights into the process, albeit with a high degree of uncertainty. In this example, relatively low transmission losses were simulated under natural conditions when groundwater levels were always quite close to the surface. However, the model suggests that increasing the available storage through aquifer de-watering can substantially impact on the losses from streamflow. The streamflow simulations could not be validated as there are no observed data, but the model was able to simulate observed borehole level variations quite successfully. Note F was only marginally addressed in the Breede River example, but transfer volumes referred to by previous studies (Department of Water Affairs and Forestry Citation2008a) are not a major component of the total water balance. Finally, Note G was not really addressed as most of the abstractions in both the Breede and Crocodile River catchments are close to the river channels and the open-cast mine in the Gamagara River example is also relatively close to the channel.
Hydrological models will never be adequate substitutes for real data, but there are many situations where real data are not, and never will be, available. This is especially true with respect to quantifying the water balance components of SW/GW interactions at the catchment scale. This study has demonstrated that a relatively simple hydrological model, operating at relatively coarse spatial and temporal scales, can be useful for quantifying these components, albeit with a relatively large amount of uncertainty remaining. The model is also able to point to areas of uncertainty that could be the focus of future field investigations, which should include more information than is typically available for desktop studies on the structural geology of the catchment and might also include environmental tracer studies (Tetzlaff and Soulsby Citation2008) to resolve some of the model unknowns. Both types of study are relatively rare in South African water resources assessments, but arguably will offer better opportunities for reduction in the uncertainty in the way in which models represent real world processes and therefore more reliable simulations.
Disclosure statement
No potential conflict of interest was reported by the author(s).
Additional information
Funding
REFERENCES
- Berkowitz, B., 2002. Characterizing flow and transport in fractured geological media: a review. Advances in Water Resources, 25, 861–884. doi:10.1016/S0309-1708(02)00042-8
- Beven, K.J., 1989. Changing ideas in hydrology—the case of physically-based models. Journal of Hydrology, 105 (1–2), 157–172. doi:10.1016/0022-1694(89)90101-7
- Beven, K.J., 2012. Causal models as multiple working hypotheses about environmental processes. Comptes Rendus Geoscience, 344, 77–88. doi:10.1016/j.crte.2012.01.005
- Braaten, R. and Gates, G., 2003. Groundwater-surface water interaction in inland New South Wales: a scoping study. Water Science Technology, 48 (7), 215–224.
- Bredenkamp, B.J. and De Jager, L., 2011. Impact of mining on the Gamagara River aquifer. Johannesburg, South Africa: Groundwater Consulting Services, Draft Report No. 10-387/4.
- Brunner, P., Cook, P.G., and Simmons, C.T., 2009. Hydrogeologic controls on disconnection between surface water and groundwater. Water Resources Research, 45 (1), 1–13. doi:10.1029/2008WR006953
- Cook, P.G., et al., 2003. From drainage to recharge to discharge: some time lags in subsurface hydrology. Developments in Water Science, 50 (C), 319–326.
- Cuthbert, M.O., Mackay, R., and Nimmo, J.R., 2013. Linking soil moisture balance and source-responsive models to estimate diffuse and preferential components of groundwater recharge. Hydrology and Earth System Sciences, 17, 1003–1019. doi:10.5194/hess-17-1003-2013
- Dahan, O., et al., 2008. Dynamics of flood water infiltration and groundwater recharge in hyper-arid desert. Ground Water, 46 (3), 450–461.
- Dawes, W., et al., 2012. Modelling the effects of climate and land cover change on groundwater recharge in south-west western Australia. Hydrology and Earth System Sciences, 16, 2709–2722. doi:10.5194/hess-16-2709-2012
- De Vries, J.J. and Simmers, I., 2002. Groundwater recharge: an overview of processes and challenges. Hydrogeology Journal, 10 (1), 5–17. doi:10.1007/s10040-001-0171-7
- Department of Water Affairs and Forestry, 2005. Groundwater resource assessment phase II (GRAII). Pretoria, South Africa: DWA.
- Department of Water Affairs and Forestry, 2008a. The Assessment of Water Availability in the Berg Catchment (WMA 19) by Means of Water Resource Related Models: Groundwater Model Report Volume 3—Regional Conceptual Model. Prepared by Umvoto Africa (Pty) Ltd in association with Ninham Shand (Pty) Ltd on behalf of the Directorate: National Water Resource Planning. Pretoria, South Africa: DWA, DWAF Report No. P WMA 19/000/00/0408.
- Department of Water Affairs and Forestry, 2008b. Assessment of Water Availability in the Crocodile (West) River Catchment: Irrigation Assessment. Pretoria, South Africa: DWA, Report No. P WMA 03/000/00/2208.
- Fleckenstein, J.H., et al., 2010. Groundwater-surface water interactions: new methods and models to improve understanding of processes and dynamics. Advances in Water Resources, 33, 1291–1295. doi:10.1016/j.advwatres.2010.09.011
- Haria, A.H., et al., 2013. Spatial delineation of groundwater-surface water interactions through intensive in-stream profiling. Hydrological Processes, 27, 628–634. doi:10.1002/hyp.9551
- Hughes, D.A., 2004. Incorporating groundwater recharge and discharge functions into an existing monthly rainfall-runoff model. Hydrological Sciences Journal, 49 (2), 297–311. doi:10.1623/hysj.49.2.297.34834
- Hughes, D.A., et al., 2006. Regional calibration of the Pitman model for the Okavango river. Journal of Hydrology, 331 (1–2), 30–42. doi:10.1016/j.jhydrol.2006.04.047
- Hughes, D.A., 2009. Simulating the hydrology and total dissolved solids (TDS) of an ephemeral river in South Africa for environmental water requirement determinations. River Research and Applications, 25 (7), 850–860. doi:10.1002/rra.v25:7
- Hughes, D.A., 2010. Unsaturated zone fracture flow contributions to stream flow: evidence for the process in South Africa and its importance. Hydrological Processes, 24, 767–774. doi:10.1002/hyp.7521
- Hughes, D.A., 2013. A review of 40 years of hydrological science and practice in southern Africa using the Pitman rainfall-runoff model. Journal of Hydrology, 501, 111–124. doi:10.1016/j.jhydrol.2013.07.043
- Hughes, D.A., et al., 2014. Using targeted short-term field investigations to calibrate and evaluate the structure of a hydrological model. Hydrological Processes, 28, 2794–2809. doi:10.1002/hyp.v28.5
- Hughes, D.A., Kapangaziwiri, E., and Baker, K., 2010. Initial evaluation of a simple coupled surface and groundwater hydrological model to assess sustainable groundwater abstractions at the regional scale. Hydrology Research, 41 (1), 1–12.
- Hughes, D.A. and Mantel, S.K., 2010a. Estimating the uncertainty in simulating the impacts of small farm dams on streamflow regimes in South Africa. Hydrological Sciences Journal, 55 (4), 578–592. doi:10.1080/02626667.2010.484903
- Hughes, D.A. and Mantel, S.K., 2010b. Estimating uncertainties in simulations of natural and modified stream flow regimes in South Africa. In: E. Servat, et al., eds. Global change—facing risks and threats to water resources, proceedings of the sixth friend world conference. Wallingford, UK: International Association of Hydrological Sciences, IAHS Publ. 340, 358–364.
- Hughes, D.A. and Sami, K., 1992. Transmission losses to alluvium and associated moisture dynamics in a semiarid ephemeral channel system in southern Africa. Hydrological Processes, 6 (1), 45–53. doi:10.1002/(ISSN)1099-1085
- Illman, W.A. and Neuman, S.P., 2000. Type-curve interpretation of multi- rate single-hole pneumatic injection tests in unsaturated fractured rock. Ground Water, 38 (6), 899–911. doi:10.1111/gwat.2000.38.issue-6
- Ireson, A.M., Butler, A.P., and Gallagher, A., 2009. Groundwater flooding in fractured permeable aquifers. In: G. Blöschl, et al., eds. Improving integrated surface and groundwater resource management in a vulnerable and changing world. Vol. 330. Wallingford: IAHS Publication, 244–172.
- Ivkovic, K.M., 2009. A top–down approach to characterise aquifer–river interaction processes. Journal of Hydrology, 365 (3–4), 145–155. doi:10.1016/j.jhydrol.2008.11.021
- Ivkovic, K.M., Letcher, R., and Croke, B.F.W., 2009. Use of a simple surface-groundwater interaction model to inform water management. Australian Journal of Earth Sciences, 56, 71–80. doi:10.1080/08120090802541945
- Jiménez‐Martínez, J., et al., 2013. Temporal and spatial scaling of hydraulic response to recharge in fractured aquifers: insights from a frequency domain analysis. Water Resources Research, 49 (5), 3007–3023. doi:10.1002/wrcr.20260
- Kelbe, B. and Germishuyse, T., 2010. Groundwater/surface water relationships with specific reference to Maputaland. Pretoria, South Africa: Water Research Commission, WRC Report 1168/1/10.
- Krásný, J. and Sharp Jr., J.M., 2007. Hydrogeology of fractured rocks from particular fractures to regional approaches: state of the art and future challenges. IAH Selected Paper Series, 9 (1), 1–30.
- Lamontagne, S., et al., 2014. Field assessment of surface water–groundwater connectivity in a semi-arid river basin (Murray–Darling, Australia). Hydrological Processes, 28, 1561–1572. doi:10.1002/hyp.9691
- Landon, M.K., et al., 1999. Comparison of the stable-isotopic composition of soil water collected from suction lysimeters, wick samplers and cores in a sandy unsaturated zone. Journal of Hydrology, 224, 45–54. doi:10.1016/S0022-1694(99)00120-1
- Lange, J., 2005. Dynamics of transmission losses in a large arid stream channel. Journal of Hydrology, 306 (1–4), 112–126. doi:10.1016/j.jhydrol.2004.09.016
- Le Maitre, D.C and Colvin, C.A, 2008. Assessment of the contribution of groundwater discharges to rivers using monthly flow statistics and flow seasonality. Water SA, 34 (5), 549–564.
- Levy, J. and Xu, Y., 2012. Review: groundwater management and groundwater/surface-water interaction in the context of South African water policy. Hydrogeology Journal, 20 (2), 205–226. doi:10.1007/s10040-011-0776-4
- Lorentz, S. et al., 2004. Hydrological systems modelling research programme: hydrological processes, Phase II: quantification of hillslope, riparian and wetland processes. Pretoria, South Africa: Water Research Commission, WRC Report K5/1061 and K5/1086.
- Marklund, L. and Wörman, A., 2007. The impact of hydraulic conductivity on topography driven groundwater flow. Publications of the Institute of Geophysics Polish Academy of Science, E-7, 157–167.
- Midgley, D.C., Pitman, W.V., and Middleton, B.J., 1994. Surface water resources of South Africa 1990. Volumes I to VI. Pretoria, South Africa: Water Research Commission, Report No’s 298/1.1/94 to 298/1.6/94.
- Nash, J.E. and Sutcliffe, J.V., 1970. River flow forecasting through conceptual models, part I—A discussion of principles. Journal of Hydrology, 10, 282–290. doi:10.1016/0022-1694(70)90255-6
- Nastev, M., et al., 2004. Hydraulic properties and scale effects investigation in regional rock aquifers, south-western Quebec, Canada. Hydrogeology Journal, 12, 257–269. doi:10.1007/s10040-004-0340-6
- Parsons, R., 2004. Surface water—groundwater interaction in a Southern African context. Pretoria, South Africa: Water Research Commission, Report No TT 218/03.
- Pitman, W.V., 1973. A mathematical model for generating monthly river flows from meteorological data in South Africa. Johannesburg, South Africa: Hydrological Research Unit, Univ. of the Witwatersrand, Report no. 2/73.
- Rodhe, A. and Bockgard, N., 2006. Groundwater recharge in a hard rock aquifer: a conceptual model including surface-loading effects. Journal of Hydrology, 330, 389–401. doi:10.1016/j.jhydrol.2006.03.032
- Roets, W., et al., 2008. Groundwater discharges to aquatic ecosystems associated with the table mountain group aquifer: a conceptual model. Water SA, 34 (1), 77–88.
- Rushton, K.R. and Ward, C., 1979. The estimation of groundwater recharge. Journal of Hydrology, 41 (3–4), 345–361. doi:10.1016/0022-1694(79)90070-2
- Shanafield, M. and Cook, P.G., 2014. Transmission losses, infiltration and groundwater recharge through ephemeral and intermittent streambeds: a review of applied methods. Journal of Hydrology, 511, 518–529. doi:10.1016/j.jhydrol.2014.01.068
- Sophocleous, M.A., 2002. Interactions between groundwater and surface water: the state of the science. Hydrogeology Journal, 10 (1), 52–67. doi:10.1007/s10040-001-0170-8
- Tanner, J.L., 2013. Understanding and modelling of surface and groundwater interactions [online]. Thesis (PhD). Rhodes University, South Africa. Available from: http://eprints.ru.ac.za/index.html
- Tanner, J.L. and Hughes, D.A., 2013. Assessing uncertainties in surface-water and groundwater interaction modelling—a case study from South Africa using the Pitman model. In: J. Cobbing, et al., eds. Assessing and managing groundwater in different environments, International Association of Hydrogeologists Selected Papers. London: CRC Press.
- Tetzlaff, D. and Soulsby, C., 2008. Sources of baseflow in larger catchments—using tracers to develop a holistic understanding of runoff generation. Journal of Hydrology, 359, 287–302. doi:10.1016/j.jhydrol.2008.07.008
- Tumbo, M. and Hughes, D.A., 2015. Uncertain hydrological modelling: application of the Pitman model in the great Ruaha river basin, Tanzania. Hydrological Sciences Journal, 60 (11), doi:10.1080/02626667.2015.1016948
- Unland, N.P., et al., 2013. Investigating the spatio-temporal variability in groundwater and surface water interactions: a multi-technique approach. Hydrology and Earth System Sciences, 17, 3437–3453. doi:10.5194/hess-17-3437-2013
- Vivier, J.J.P. et al., 2007. Groundwater yield model and numerical model integration into a resource management plan. Paper presented at the Biennial South African Groundwater Conference, October 2007, Bloemfontein, South Africa.
- Voss, C.I., 2003. Announcing a hydrogeology journal theme issue on “the future of hydrogeology”. Hydrogeology Journal, 11, 415–417. doi:10.1007/s10040-003-0284-2
- Wenningger, J., et al., 2008. Identification of runoff generation processes using combined hydrometric, tracer and geophysical methods in a headwater catchment in South Africa. Hydrological Sciences Journal, 53 (1), 65–80. doi:10.1623/hysj.53.1.65
- Winter, T.C., 1999. Relation of streams, lakes and wetlands to groundwater flow systems. Hydrogeology Journal, 7 (1), 28–45. doi:10.1007/s100400050178
- Xu, Y., et al., 2002. A hydrogeomorphological approach to quantification of groundwater discharge to streams in South Africa. Water SA, 28 (4), 375–380. doi:10.4314/wsa.v28i4.4910