
ABSTRACT
This research aims to provide a comprehensive evaluation of climate change effects on temperature, precipitation and potential evapotranspiration over the country of Iran for the time periods 2010–2039, 2040–2069 and 2070–2099, and under scenarios A2 and B2. After preparation of measured temperature and precipitation data and calculation of potential evapotranspiration for the base time period of 1960–1990 for 46 meteorological stations (with a nationwide distribution), initial zoning of these three parameters over the country was attempted. Maximum and minimum temperatures and values of precipitation were obtained from the HadCM3 model under scenarios A2 and B2 for the three time periods, and these data were downscaled. Corresponding maps were prepared for the three parameters in the three time periods, and spatial and temporal variations of these climatic parameters under scenarios A2 and B2 were extracted and interpreted. Results showed that the highest increase in temperature would occur in western parts of the country, but the highest increase of potential evapotranspiration would occur in the central region of Iran. However, precipitation would vary temporally and spatially in different parts of the country depending on the scenario used and the time period selected.
Editor Z. W. Kundzewicz; Associate editor not assigned
1 Introduction
Climate change is defined as “a change of climate which is attributed directly or indirectly to human activity that alters the composition of the global atmosphere and which is in addition to natural climate variability observed over comparable time periods” (UNFCCC Citation1992). This phenomenon is caused by so-called greenhouse gases in the Earth’s atmosphere. Emissions of greenhouse gases have been increasing since industrialization in the 1900s, due to increased fossil fuel burning. These gases allow solar radiation to reach the Earth’s surface, but prevent radiation from the surface travelling back into space. This causes the Earth’s temperature to rise gradually (Takara et al. Citation2009)
It is expected that climate change will strongly affect the hydrological cycle in future decades (Milly et al. Citation2005, Gedney et al. Citation2006). It will also have significant impacts on the availability, as well as the quality and quantity of water. Among the climatic variables, precipitation (P) and potential evapotranspiration (ET) have the greatest importance in long-term changes of water resources (Piao et al. Citation2007). Many researchers have predicted that climate change will accelerate water cycles, with higher ET and increased precipitation in some parts of the globe (Oki and Kanae Citation2006, Betts et al. Citation2007). But increased precipitation does not necessarily lead to sustainable water resources because less frequent but heavier precipitation may lead to extreme flood or drought occurrences (Andreadis and Lettenmaier Citation2006). Therefore, it should be emphasized that in order to monitor and assess the impact of climate change on drought occurrence, ET and P should be considered together as two major climatic variables.
Trenberth (Citation2008) evaluated the impacts of climate change and variability on heavy precipitation, floods and drought, and concluded that there is likely to be increased runoff and risk of flooding in early spring but increased risk of drought in high summer, especially over continental areas. Karamouz et al. (Citation2009) simulated flood flows under climate change scenarios using GCM models for the Kajoo River basin, located in the arid and semi-arid regions of southeast Iran, and estimated the magnitude of floods that would occur in the future due to the impacts of climate change. Abbaspour et al. (Citation2009) studied the impact of climate change on water resources in Iran. They used the SWAT model for analysis of daily river discharge and annual wheat yield data at the sub-basin level for the period 1980–2002. They also used CGCM 3.1 with scenarios A1, B1 and A2 for simulation of the water resource situation for 2010–2040 and 2070–2100. Their results indicated that daily rainfall intensities will be greater in the future, causing larger floods in the humid regions and more prolonged droughts in the dry regions.
Harmsen et al. (Citation2009) estimated precipitation (P), reference evapotranspiration (ET0), precipitation deficit (PD = P − ET0), and relative crop yield reduction (YR) for a generic crop under climate change conditions for three locations in Puerto Rico. Results from their analysis indicated that the rainy season will become wetter and the dry season will become drier. The 20-year average September precipitation excess increased for all scenarios and locations, from 121 to 321 mm between 2000 and 2090. Conversely, the 20-year average February precipitation deficit changed from −27 to −77 mm between 2000 and 2090.
Rosenberg et al. (Citation2010), evaluated the impacts of climate change on precipitation extremes and storm-water infrastructure in Washington State, USA. Although their simulations generally predicted increases in extreme rainfall magnitudes, the range of these projections is too large at present to provide a basis for engineering design, and can only be narrowed through consideration of a larger sample of simulated climate data. Nonetheless, the evidence suggests that drainage infrastructure designed using mid-20th-century rainfall records may be subject to a future rainfall regime that differs from current design standards.
Dastorani et al. (Citation2011) studied the effects of climate change on drought indices for Yazd station in Iran. This research employed the HadCM3 model based on the IPCC-SRES scenarios A2 and B2. The results indicated that the values of SPI (standardized precipitation index) and RDI (reconnaissance drought index) for scenario A2 have a negative trend along the projected years, while these indicators tended to have a positive trend when scenario B2 was applied. SPI and RDI are the most important indices for evaluation of drought characteristics (Bari Abarghouei et al. Citation2011, Kousari et al. Citation2014).
Azaranfar et al. (Citation2009) studied variations of precipitation and temperature in the Zayanderud basin in Iran using statistical methods. Their results suggested that temperature and precipitation will increase in 2010–2039. Massah Bavani (Citation2006) studied the effects of uncertainty on runoff probability distributions under climate change in the same basin. Their probability distributions were most effective in estimating runoff for 2070–2099.
Trenberth (Citation2011) studied changes in precipitation due to climate change and concluded that global warming has a direct influence on precipitation. Increased heating leads to greater evaporation and thus surface drying, thereby increasing the intensity and duration of drought. However, the water-holding capacity of air increases by about 7% per 1°C warming, which leads to increased water vapour in the atmosphere. Hence storms, whether individual thunderstorms, extratropical rain or snow storms, or tropical cyclones, are supplied with increased moisture, and produce more intense precipitation events. Such events are now occurring widely, even where total precipitation is decreasing, and this increases the risk of flooding.
Acharya et al. (Citation2013) investigated the impacts of climate change on extreme precipitation events over the Flamingo Tropicana watershed in Nevada, USA. According to their results, the predicted cumulative annual precipitation for each 30-year period shows a continuous decrease from 2011 to 2099. However, the summer convective storms, which are considered as extreme storms for the study area, are expected to be more intense in future. Extreme storm events show larger changes in streamflow under different climate scenarios and time periods. The simulated peak streamflow and total runoff volume both showed an increase of from 40% to more than 150% (during 2011–2099) for different climate scenarios.
Ge et al. (Citation2013) evaluated the effects of climate change on evapotranspiration and soil water availability in Norway spruce forests in southern Finland. Their results showed that, on average, the cumulative canopy surface evaporation and evaporation from the soil surface were 16% and 14% higher, respectively, than those at present. However, the cumulative transpiration was 12% lower.
Khalil (Citation2013) analysed the effects of climate change on evapotranspiration in Egypt. In this study, agrometeorological data were collected from 20 stations in the Nile Valley and Nile Delta to determine the variation of evapotranspiration under current and future climate conditions. The Penman-Monteith equation was used to calculate reference evapotranspiration according to the agrometeorological data. Results showed that under the current climate the Aswan region shows the highest and Damietta shows the lowest rates of evapotranspiration. However, under climate change, evapotranspiration will increase at all 20 stations, especially using scenarios A2 and B1. These results reveal that water requirements will increase under climate change conditions due to increased evapotranspiration.
Tanasijevic et al. (Citation2014) evaluated the impacts of climate change on the evapotranspiration and irrigation requirements of the olive crop in the Mediterranean region, focusing on olive growth and possible alterations to cultivable areas under changing climate. The results showed that olive flowering is likely to be advanced by 11 ± 3 days and crop evapotranspiration is expected to increase by 8% (51 ± 17 mm season−1). Net irrigation requirements were predicted to increase by 18.5% (70 ± 28 mm season−1). In addition, effective evapotranspiration of rainfed olives could decrease in most areas due to the expected reduction of precipitation and increase of evapotranspirative demand, thus making it impossible to maintain rainfed production as it is at present.
The phenomenon of global warming and climate change is the most important challenge of the 21st century. However, climate change impacts on rainfall and evapotranspiration have not been determined conclusively. Decreases in rainfall and increases in temperature would result in increases in evapotranspiration (Abtew and Melesse, Citation2013). The effects of climate change could be different in different parts of the world; therefore, regional research projects are necessary to enable results to be combined to build a comprehensive understanding of the impacts on hydrology and water resources for the whole planet. This research was carried out to provide some of the knowledge required on regional impacts of climate change on three main parameters of hydrology. The purpose was the evaluation and mapping of the impacts of climate change on precipitation, temperature and potential evapotranspiration in Iran under scenarios A2 and B2 for the time periods 2010–2039, 2040–2069 and 2070–2099. Awareness of the type and the size of changes in such important parameters would help the authorities and planners to adopt better optimized and effective management strategies for water resources to be able to cope with the conditions expected in the future.
2 Materials and methods
2.1 Study area
The study area for this research is the country of Iran, located in northwest Asia. Climate conditions vary considerably over the country, especially from north to south. In a narrow strip of northern Iran annual precipitation is over 1000 mm, and in areas covered by dense forests precipitation can reach over 1700 mm. However, most parts of Iran, especially the central and southeast regions, are warm hyper-arid areas with less than 100 mm annual precipitation and over 3500 mm annual potential evapotranspiration. This considerable variation in climate conditions causes a wide range of biodiversity in animal and plant communities. Data from different regions of Iran were chosen to cover these variations. shows the distribution of the meteorological stations selected for data collection.
Figure 1. Distribution across Iran of the synoptic meteorological stations used in this research.
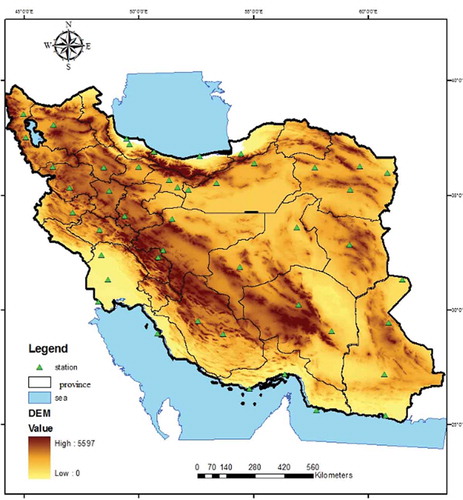
presents general information for the 46 meteorological stations. As can be seen from the table, the highest mean annual precipitation occurs at Anzali, with 1780 mm, while Zabol receives only 54 mm per year, the lowest value among the selected sites. The warmest site is Bandarabbas, with annual average temperature of 27.4°C, while the lowest value of this parameter is 11.45°C at Zanjan, in the northwest.
Table 1. Properties of meteorological stations used in this research.
2.2. Methodology
In this study, the four main sources of data were:
Historical daily temperature and precipitation data for the selected meteorological stations from 1961 to 1990 (Tmin, Tmax and P).
Projected monthly data from the HadCM3 model for the periods 2010–2039, 2040–2069 and 2070–2099 (Tmin, Tmax and P) that resulted from GCM runs for the Third Assessment Report (TAR) based on the IPCC-SRES scenario A2.
Scenario A2 is based on regionalization, with the emphasis on human wealth. The A2 storyline and scenario family describe a very heterogeneous world. The underlying theme is self-reliance and preservation of local identities. Fertility patterns across regions converge very slowly, which results in continuously increasing global population. Economic development is primarily regionally oriented and per capita economic growth and technological change are more fragmented and slower than in other storylines.
Projected monthly data from the HadCM3 model for the periods 2010–2039, 2040–2069 and 2070–2099 (Tmin, Tmax and P), based on scenario B2.
Scenario B2 is based on regionalization, with the emphasis on sustainability and equity. The B2 storyline and scenario family describe a world in which the focus is on local solutions to economic, social and environmental sustainability. It is a world with continuously increasing global population at a rate lower than that in A2, intermediate levels of economic development, and less rapid and more diverse technological change than in the B1 and A1 storylines. While the scenario is also oriented towards environmental protection and social equity, its focus is at local and regional levels.
Calculated potential evapotranspiration for each time period using monthly Tmin and Tmax.
illustrates the procedure used to study the impact of climate change on temperature, precipitation and potential evapotranspiration. After downscaling the temperature and precipitation data for the three time periods, 2010–2039, 2040–2069 and 2070–2099, at all selected sites, values of reference evapotranspiration were calculated for the base period as well as the future periods. Then, nationwide maps of mean temperature, precipitation and potential evapotranspiration for the future periods were prepared. Based on these maps, the effects of climate change on the studied parameters (T, P and ET0) have been analysed.
Figure 2. Proposed methodology for study of climate change impacts on temperature, precipitation and potential evapotranspiration in this research.
2.3 Downscaling
Downscaling is a procedure that derives local- or regional-scale information from larger-scale data such as GCM model outputs (Bates et al. Citation2008, Giorgi et al. Citation2001). The two main methods that have been adopted are dynamical and statistical downscaling approaches. Statistical downscaling methods generally develop statistical relationships to relate the large-scale atmospheric variables to local climate variables. These methods include weather pattern-based approaches, regression methods and stochastic weather generators. In all cases, the quality of the downscaled product depends on the quality of the model (Bates et al. 2008). In this study, the stochastic approach was used for downscaling of daily data of the HadCM3 model for the projected periods, with the help of ClimGen software (Massah Bavani Citation2006). Daily data include Tmin, Tmax and P. For example, for the monthly temperature:
where and
are mean monthly temperatures (Tmin or Tmax) resulting from the different scenarios (A2 and B2) for the baseline (1961–1990) and a projected period in month i. In fact,
illustrates the differences between monthly temperatures of past and future periods under the A2 or B2 scenarios. To estimate temperatures for a projected period at site scale resolution (
), monthly observed temperature data were acquired (
) and added to
of the corresponding month:
These monthly temperatures (Tmin or Tmax) were then converted to daily values using ClimGen software. A similar procedure was used for production of daily precipitation for the future periods:
where is the ratio of projected to baseline monthly precipitation resulting from HadCM3 under different scenarios.
is observed monthly mean precipitation for the selected meteorological stations, while
is the corresponding monthly mean downscaled precipitation for the projected periods. ClimGen was also used for generation of daily precipitation (Massah Bavani Citation2006).
2.4 Potential evapotranspiration model
The Hargreaves-Samani method (Ravazzani et al. Citation2012) was used for calculation of reference potential evapotranspiration. In this method, which is a commonly used approach, and is also relevant to Iranian meteorological conditions (Ravazzani et al. Citation2012), minimum temperature, maximum temperature and mean temperature were used to calculate ET0 using the following equation:
where
ET0 is potential evapotranspiration in mm/month, KT is an adjustment coefficient of temperature difference, TD is the difference between monthly minimum and maximum temperatures in °C and Ra is the radiation leaving the Earth per mm water, which is estimated for each site for each month based on geographical latitude. Kriging was used for interpolation to create the related maps.
3 Results
3.1 Precipitation
Scenario A2 shows the precipitation map for the time periods 2010–2039, 2040–2069 and 2070–2099 estimated using scenario A2. The map resolution (pixel size) was defined as a function of nationwide scale. As can be seen from the precipitation map for the base period (measured values; Map A), more precipitation occurs in the north and northwest parts of the country than in the central and southeast parts. As seen in Map B (2012–2039) precipitation (in comparison to the baseline measured values) varies from site to site, although in general there is an increase for this period compared to the base period. The greatest precipitation increase occurs at Anzali (in the north of Iran), at 76.2 mm (4.3%), while the greatest decrease is for Khoy (in the northwest), with a 21.7 mm (8.1%) decrease compared to the base period.
Figure 3. Maps of precipitation values in the base and future time periods under scenario A2. (a) Base period; scenario A2 for (b) 2010–2039, (c) 2040–2069, (d) 2070–2099.
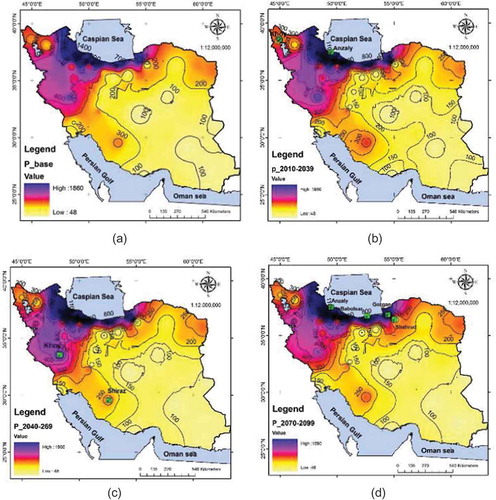
The results for 2040–2069 are different from those for 2010–2039, as for most of the sites a decrease in precipitation occurs as compared to the baseline, although for some stations an increase is still seen. Comparison of the outputs for 2040–2069 with those of 2010–2039 shows that at sites where values for 2010–2039 decrease (compared to the base period), this decrease continues sharply in 2040–2069. In addition, at some sites where increases occur in 2010–2039, these change to decreases for the following period (2040–2069). The highest increase for 2040–2069 is at Khoramabad in the west of the country, at 45.7 mm (8.86%) per year, while the highest decrease is seen at Shiraz in the south, with a value of 54.7 mm (16.93%) compared to the preceding period (2010–2039). Both stations show slight increases for 2010–2039 in comparison with the base period (1961–1990).
For 2070–2099, precipitation shows decreases at all sites except three: Babulsar (at 22 mm, which is a 2.7% increase), Gorgan (17.6 mm, 2.7% increase) and Shahroud (3.6 mm, 2.67% increase); all these stations are located in northern Iran. The highest decrease occurs at Anzali in the north, with a value of 224.2 mm (12.6%) compared to the base period, where there was an increase in precipitation amounts in both previous time periods (2010–2039 and 2040–2069). Map D clearly shows this general decrease of precipitation in 2070–2099 in comparison to the base period as well as in periods 2010–2039 and 2040–2069.
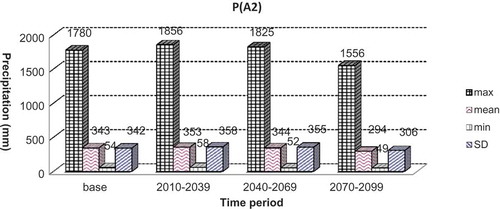
In order to have a better comparison and analysis, the highest, lowest, mean and standard deviation of precipitation in all time periods (baseline and future) are shown in . It can be seen in the figure that for almost all the parameters there is an increase for 2010–2039 and then a gradual decrease in the following time periods.
Figure 4. The values of maximum, mean, minimum and standard deviation of precipitation in the base and future time periods under scenario A2.
Scenario B2 shows the precipitation map for the base period and also for 2010–2039, 2040–2069 and 2070–2099 under scenario B2. As seen from , precipitation decreases in 2010–2039 in comparison to the base period. Although at most of the stations precipitation decreases for this time period, the highest decrease is seen at Sanandaj in western Iran, with 40.5 mm (8.62%) compared to the base period. For the same period, Bushehr on the south coast shows a 20.5 mm (8%) increase in precipitation compared to the base period.
Figure 5. Maps of precipitation values in the base and future time periods under scenario B2. (a) Base period; scenario B2 for (b) 2010–2039, (c) 2040–2069, (d) 2070–2099.
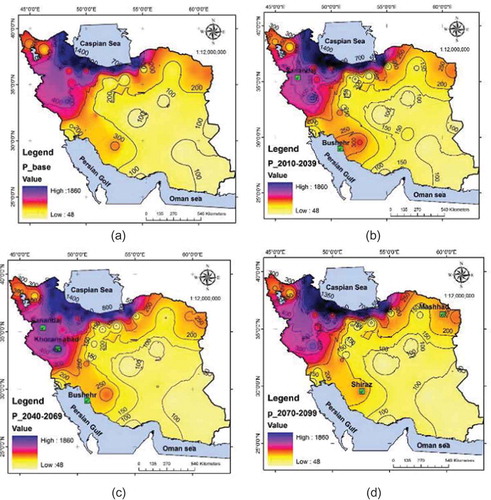
The precipitation map for 2040–2069 is shown in . This map indicates that precipitation decreases for almost half of the stations while it increases for the other half. However, the precipitation decline is less than for 2010–2039. The highest decline in precipitation for this period occurs at Shiraz, with a 37.6 mm (11.64%) decrease, and the highest increase belongs to Khorramabad, with a 38.3 mm (7.42%) increase over the values for the base period. Sanandaj in the west, which showed the highest decrease in precipitation for 2010–2039, shows a 1.7 mm (0.36%) increase in 2040–2069. Bushehr in the south, which showed the highest increase of precipitation in 2010–2039, shows a decrease of 29.1 mm (11.3%) in 2040–2069.
shows the 30-year precipitation map for 2070–2099. This map shows that for all stations except five (Abadan, Babulsar, Mashhad, Gorgan and Shahroud) precipitation amounts show considerable decreases compared to the previous 30 years (2040–2069) and also the base period. The highest decrease is 71.2 mm (22%) for Shiraz in the south. However, Mashhad in the northeast shows a 12.3 mm (5.15%) increase compared to the base period. Mashhad is a place that shows an increase of precipitation in all three studied time periods, with increases over the base period of 9.1 mm (3.81%), 17.5 mm (7.32%) and 12.3 mm (5.15%) for 2010–2039, 2040–2069 and 2070–2099, respectively. In contrast, Shiraz is a place where precipitation decreases in all three studied time periods, with the highest decrease of about 22% in 2070–2099 compared to the base period.
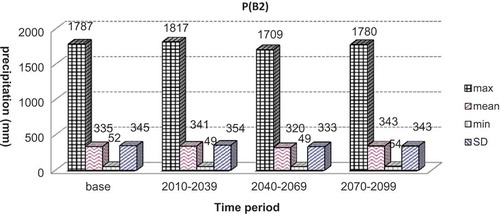
shows the maximum, minimum, mean and standard deviation (s.d.) of precipitation for the base time period and the following three 30-year periods. For 2010–2039, the values of maximum and s.d. increase, respectively, from 1780 and 343 in the base time period to 1787 and 345. However, mean and minimum values decrease from 343 and 54 mm to 335 and 52 mm. In 2040–2069, the values of maximum and s.d. increase over the base period, but the values of mean and minimum decrease compared to the base period. For 2070–2099, all four parameters show a decrease compared to the base period.
Figure 6. The values of maximum, mean, minimum and standard deviation of precipitation in the base and future time periods under scenario B2.
Comparing the results from scenarios A2 and B2, it seems that the decreases in precipitation in future decades (especially for 2070–2099) under scenario A2 are higher than under scenario B2.
3.2 Temperature
Scenario A2 shows temperature maps for Iran for the base and future time periods under scenario A2. As shows, the highest temperatures are found in the central and south-coast areas, and the lowest temperatures relate to northwest mountainous parts of the country. Bandarabbas in the south is the warmest point, with mean annual temperature of 27.4°C, and Zanjan is the coldest station, with mean annual temperature of 11.45°C. shows that at all stations temperatures increase for 2010–2039 compared to the base period. The highest increase occurs at Ahwaz and Abadan in the southwest, with a 1.6°C increase, and the lowest increase belongs to Chahbahar on the southeast coast, at only 0.8°C over the base period.
Figure 7. Maps of temperature values in the base and future time periods under scenario A2. (a) Base period; scenario A2 for (b) 2010–2039, (c) 2040–2069, (d) 2070–2099.
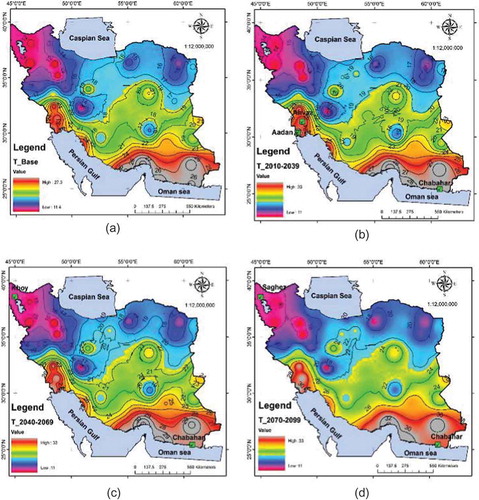
Comparing the maps in and , a clear increase in temperature is seen for all stations in 2040–2069 in comparison to the base period. The highest increase occurs at Khoy in the northwest, at 3.1°C, and the lowest increase is at Chahbahar, at 1.6°C, over the base period.
shows the temperature map for Iran for 2070–2099. This map also shows clear increases of temperature in this period over the previous periods as well as the base period. The highest increase occurs at Saghez in the west, at 5.4°C over the base period, whilst the lowest increase is seen at Chahbahar on the southeast coast, at 3.6°C over the base period.
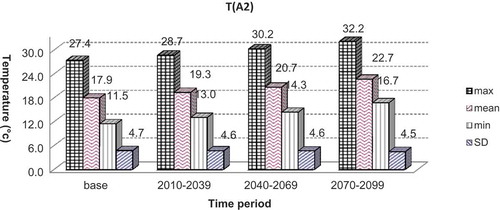
The values of maximum, mean, minimum and s.d. of temperature in the three future 30-year periods under scenario A2 and the base time period are shown in . The maximum temperatures for 2010–2039, 2040–2069 and 2070–2099 increase, respectively, by 1.3, 2.8 and 4.8°C over the base period. The increases in mean temperature for the same time periods are, respectively, 1.4, 2.8 and 4.8°C over the base period. As shows, the increased values of minimum temperature for the mentioned 30-year time periods are, respectively, 1.5, 2.8 and 5.2°C over the base time period. The values of s.d. decrease in the future periods compared to the base time period by 0.1, 0.1 and 0.2°C, respectively. This figure also shows that in all the future time periods, the increase in minimum temperature is greater than that in the maximum temperature, which is important in relation to the length of growing season for plants and for agricultural management.
Figure 8. The values of maximum, mean, minimum and standard deviation of temperature in the base and future time periods under scenario A2.
Scenario B2 shows the temperature maps of Iran for the base and future time periods under scenario B2. shows that at all stations temperature increases for 2010–2039 compared to the base period. The highest increase occurs at Khoy in northwest Iran, with a 2°C increase, and the lowest increase is at Babulsar on the north coast, with 0.8°C.
Figure 9. Maps of temperature values in the base and future time periods under scenario B2. (a) Base period; scenario B2 for (b) 2010–2039, (c) 2040–2069, (d) 2070–2099.
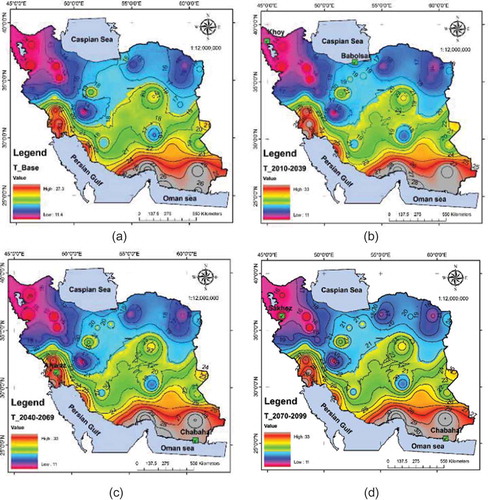
Comparing the maps in and , a clear increase in temperature is seen for all stations in 2040–2069 in comparison to the base period. The highest increase occurs at Ahwaz in the southwest, at 2.7°C, and the lowest increase is at Chahbahar in the southeast, at 1.5°C over the base period.
shows the temperature map of Iran for 2070–2099. This map also shows clear increases of temperature for this period over the previous periods and the base period. The highest increase occurs at Saghez in the west, at 4.08°C over the base period, whereas the lowest increase is seen at Chahbahar on the southeast coast, at 2.1°C over the base period. It must be mentioned that the rate of temperature increase in this period is greater than that in the previous periods (2010–2039 and 2040–2069).
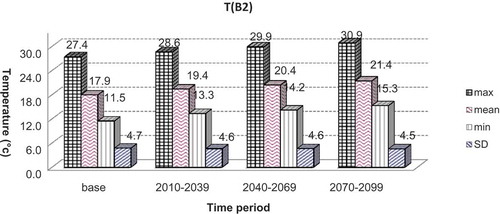
The values of maximum, mean, minimum and s.d. of temperature in future time periods under scenario B2 and the base time period are shown in . The maximum temperatures in 2010–2039, 2040–2069 and 2070–2099 increase, respectively, by 1.2, 2.5 and 3.5°C over the base period. The increases in mean temperature for the mentioned time periods are, respectively, 1.5, 2.5 and 3.5°C over the base period. As shows, the increased values of minimum temperature for the three 30-year time periods are, respectively, 1.8, 2.7 and 3.8°C over the base period. The values of s.d. decrease in all three periods compared to the base period, by 0.1, 0.1 and 0.2°C, respectively. This indicates relatively small variations of temperature among the seasons and a gradual decrease in difference between minimum and maximum values.
Figure 10. The values of maximum, mean, minimum and standard deviation of temperature in the base and future time periods under scenario B2.
3.3 Potential evapotranspiration
Scenario A2 shows maps of potential evapotranspiration rate for Iran for the base time period of 1961–1990 and the following periods of 2010–2039, 2040–2069 and 2070–2099 under scenario A2. Comparing the maps in and , it is clear that the evapotranspiration rate increases for 2010–2039 at all stations.
Figure 11. Maps of potential evapotranspiration values in the base and future time periods under scenario A2. (a) Base period; scenario A2 for (b) 2010–2039, (c) 2040–2069, (d) 2070–2099.
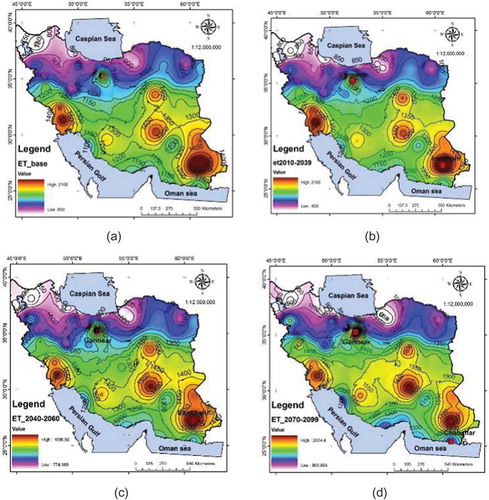
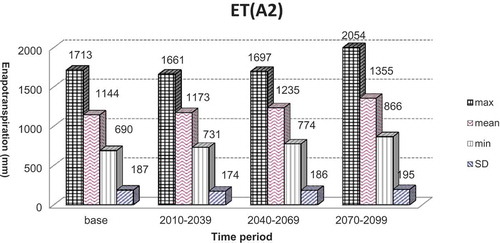
Maximum, mean, minimum and standard deviation (s.d.) of estimated potential evapotranspiration under scenario A2 are shown in . The values of the maximum in the first two periods (2010–2039 and 2040–2069) decrease compared to the base period by 52 and 16 mm, respectively. However, for the third period (2070–2099), evapotranspiration increases over the base period by 341 mm. The values of mean potential evapotranspiration increase in 2010–2039, 2040–2069 and 2070–2099 by 29, 91 and 211 mm, respectively, over the base period. The increases in minimum potential evapotranspiration in the three periods over the base period are, respectively, 41, 84 and 176 mm. Mean annual evapotranspiration shows an increase in all three periods of 29, 91 and 211 mm, respectively, over the base period. The values of s.d. decrease in 2010–2039 and 2040–2069 but increase in the last period (2070–2099) compared to the base period.
Figure 12. The values of maximum, mean, minimum and standard deviation of potential evapotranspiration in the base and future time periods under scenario A2.
Scenario B2 shows annual potential evapotranspiration maps for the base time period as well as for 2010–2039, 2040–2069 and 2070–2099 under scenario B2. As demonstrates, the potential evapotranspiration increases for all stations except Zabol and Iranshahr in the southeast in 2010–2039 in comparison with the base period. The highest increase occurs at Garmsar in central Iran. The decrease for Zabol and Iranshahr in this period is 28 mm. For 2040–2069, potential evapotranspiration increases over the base period at all stations. The highest increase occurs at Garmsar, with 240.2 mm over the base period, whilst the lowest increase is at Babulsar in the north, with 38.3 mm. In 2070–2099, potential evapotranspiration increases considerably at all stations, with the highest value of 355.9 mm at Garmsar in the central region, and the lowest value at Iranshahr in the southeast, at 44.4 mm over the base time period.
Figure 13. Maps of potential evapotranspiration values in the base and future time periods under scenario B2. (a) Base period; scenario B2 for (b) 2010–2039; (c) 2040–2069; (d) 2070–2099.
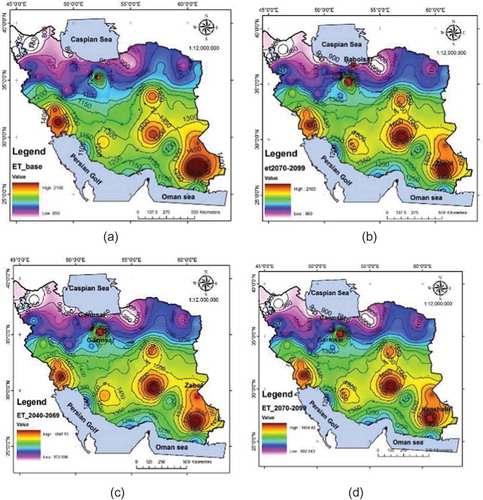
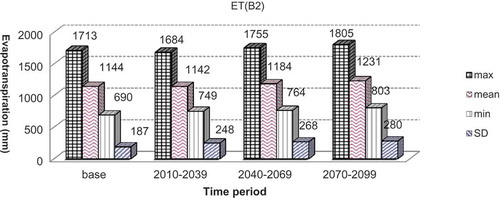
shows the values of maximum, minimum, mean and s.d. of potential evapotranspiration over the country for different time periods under scenario B2. As the figure shows, the maximum value decreases by 29 mm in 2010–2039 but increases in 2040–2069 and 2070–2099 by 42 and 92 mm, respectively, over the base time period. The value of the mean decreases by about 2 mm in 2010–2039, but increases for the subsequent time periods. The value of the minimum increases in all periods 2010–2039, 2040–2069 and 2070–2099 by 59, 74 and 113 mm, respectively. The values of s.d. also increase in all three time periods.
Figure 14. The values of maximum, mean, minimum and standard deviation of potential evapotranspiration in the base and future time periods under scenario B2.
4 Discussion
shows the stations having the highest and lowest increases and decreases in temperature, precipitation and potential evapotranspiration (for 2010–2039 under scenarios A2 and B2). The variations in each parameter and over the country have been presented and explained in previous sections, so is only for comparison of the results presented by scenarios A2 and B2 to specify the potentially hazardous regions where extreme variations occur. The table shows that the uncertainties related to the different scenarios are quite clear, as the values of the extremes and the related stations are different depending on the scenario selected. In this regard, it must be mentioned that Garmsar (in central Iran) and Iranshahr (in the southeast) are exceptions, as they respectively show the highest and lowest increases in potential evapotranspiration under both scenarios and for all three time periods. Khoy in the northwest shows two extremes: the highest increase in precipitation under scenario A2, and the highest increase in temperature under scenario B2.
Table 2. Extreme values of P, T and ET for 2010–2039 under scenarios A2 and B2.
By considering the locations of extreme values across the country (), it becomes possible to specify the most threatened regions in terms of decrease in precipitation and increase in temperature, as well as potential evapotranspiration, which limit water availability and intensify water shortage. Results show that, under scenario A2, stations located in northern parts of Iran would experience the highest increase of precipitation. However, under scenario B2, Bushehr and other stations located on the south coast show the highest increases in precipitation during future decades. Therefore, both north and south coasts are the regions experiencing the highest increases in precipitation under both scenarios and, therefore, management of water resulting from extra precipitation here will be of importance for agriculture, natural resources, storage and hydropower plants. On the other hand, increases in precipitation in these regions would increase the risk of flooding, soil erosion and landslides, which also require effective management and planning strategies. Investigation of seasonal variations of precipitation is also important, as such variations affect the types of compatible species and growing period for crops, especially in rainfed farming.
The results also show that under both scenarios the highest decrease in precipitation occurs in the west and northwest parts of the country. These areas are predicted to be affected by a precipitation decrease and water scarcity in 2010–2039. This necessitates specific planning and management of water resources for these regions to overcome the problem of water shortages. The west and northwest regions of Iran are the most important areas of the country for rainfed agriculture (especially for rainfed wheat production), which would be affected considerably by a precipitation decrease caused by climate change. Estimation and analysis of seasonal variations of precipitation under climate change scenarios is of importance for sustainable agricultural planning in these parts of the country.
Under both scenarios for 2010–2039, the highest increase of temperature occurs in the western half of the country, which is mostly mountainous and cold. Temperature increases in these regions would affect agricultural and natural resources. Most of the people in these regions are dependent on agricultural and pastoral activities, so the effects of climate change (precipitation decrease and temperature increase in 2010–2039) on their lives cannot be ignored. It should also be mentioned that in some cold regions of the country, in the west and northwest, temperature increases would increase the length of the growing season, which would be a positive effect. Under both scenarios, the lowest increases in temperature would occur in the southeast (a dry environment) and also in the north (a humid region).
As seen in , the highest increase in potential evapotranspiration occurs at Garmsar in central Iran under both scenarios. By comparing the values for different stations, it can be seen that, in general, increases in potential evapotranspiration are highest in central Iran. For 2010–2039, and under both scenarios, potential evapotranspiration decreases in southeast Iran. Central and southeast Iran are hyper-arid regions with current mean annual precipitation of less than 100 mm. In these regions, water shortage is the main problem for development at present, so climate change will intensify this issue in the future.
shows the stations that have the highest and lowest increases and decreases in temperature, precipitation and potential evapotranspiration for 2040–2069 under scenarios A2 and B2. The most important point to note for 2040–2069 is that the stations where precipitation extremes (highest increase and highest decrease) occur are the same for both scenarios. The highest increase in precipitation under both scenarios in this time period is at Khorramabad in the west. Precipitation increases occur at almost all stations of the western region under both scenarios, although the rate of increase for scenario A2 is higher than for scenario B2. In contrast, the highest decrease of precipitation in 2040–2069 occurs at Shiraz in the south. Evaluation of other stations shows that, in general, the highest decrease in precipitation in this time period occurs in the south of the country. Southern parts of the country generally have dry climatic conditions, so a precipitation decline would intensify water shortages in different sectors of this region.
Table 3. Extreme values of P, T and ET for 2040–2069 under scenarios A2 and B2.
Khoy in the northwest shows the highest increase in temperature under both scenarios. Consideration of the locations of extreme temperature values across the country makes it clear that the highest temperature increases for 2040–2069 would occur in western parts of the country. The rate of increase for scenario A2 is higher than for scenario B2. Chahbahar and other stations located in the southeast region show the lowest increases of temperature for 2040–2069. Similar to 2010–2039, the highest increase in potential evapotranspiration would occur at Garmsar in central Iran under both scenarios for 2040–2069. By comparing values for different stations, it can be seen that, in general, increases in potential evapotranspiration are highest in northern parts of the central region. The lowest increase of evapotranspiration for 2040–2069, under both scenarios, belongs to the southeast of Iran.
The highest and lowest increases and decreases in temperature, precipitation and potential evapotranspiration for 2070–2099 under scenarios A2 and B2 are shown in . The most important point to note for 2070–2099 is the clear decrease of precipitation (), which drops considerably even compared to the base time period, by about 50 mm on average over the country. As the present average annual precipitation for the country is about 250 mm, a 50 mm (20%) decrease would be a big drop in precipitation, and would seriously affect the availability of water across the country. Overall, it can be predicted that for the next 30 years (from the present) the average precipitation will increase across the country; for the following 30 years conditions will be mostly similar to those in the base time period; and for the third 30 years a considerable decrease in precipitation will occur across the country. In this final time period, the highest decrease in precipitation occurs at Anzali in the north under scenario A2. However, under scenario B2 the southern part of country experiences the highest decrease of precipitation.
Table 4. Extreme values of P, T and ET for 2070–2099 under scenarios A2 and B2.
The highest increases of temperature under both scenarios occur in western parts of Iran. Under both scenarios the lowest increase in temperature occurs in the southeast. Similar to the previous time periods, the highest increase in potential evapotranspiration occurs in central Iran under both scenarios for 2070–2099. The lowest increase of potential evapotranspiration for 2070–2099, under both scenarios, also belongs to the southeast. The most threatened regions in this time period are west and central parts of Iran, which experience the highest increases, respectively, in temperature and potential evapotranspiration, which would increase water loss from soils, vegetation and surfaces, and deplete subsurface water resources. This would affect wildlife, natural ecosystems and people, especially during drought periods and the warm seasons.
Overall, – show that the highest increase in temperature occurs in western parts of the country, but the highest increase in potential evapotranspiration belongs to central regions of Iran. However, variations of precipitation are different in different parts of the country depending on the scenario used and the time period selected. It must be mentioned that even an increase in precipitation would not result in more availability of water due to the temperature increase, which would increase evapotranspiration. In general, it can be said that increasing average global temperatures will result in a number of impacts on the hydrological cycle, including changes in precipitation. Precipitation will be directly impacted by changes in atmospheric circulation and increases in atmospheric water vapour and evaporation associated with warmer temperatures. Precipitation changes are expected to differ from region to region, as seen in this research, with some areas becoming wetter and others becoming dryer. Any change in precipitation amount will result in corresponding regional changes in runoff, thus impacting water supply management regimes. Water resources in arid and semi-arid regions, like most parts of Iran, will be most vulnerable to changes in precipitation, since runoff and river flows in these areas are particularly sensitive to changes in precipitation. Additionally, changes in average rainfall will impact groundwater recharge rates, thus potentially impacting water supplies. Water resource managers who experience a decrease in precipitation may have to explore new sources of supply, implement demand management activities, or invest in new treatment techniques. Managers who experience an increase in precipitation may need to make infrastructure investments to mitigate an increased risk of flooding and higher reservoir levels, along with developing new treatment processes. The results of this study are similar to those of other researchers, such as Azaranfar et al. (Citation2009) on effects of climate change on temperature and precipitation, and Ge et al. (Citation2013), Khalil (Citation2013) and Tanasijevic et al. (Citation2014) on the effects of climate change on evapotranspiration.
5 Conclusions
Climate change modelling is fraught with uncertainties, but analysis of these uncertainties is beyond the scope of this research. As seen in this research, the results of the model for temperature, precipitation and potential evapotranspiration under the scenarios A2 and B2 are different in different areas of Iran. The extreme values produced by scenario A2 are higher than those of scenario B2. At all stations, for all three time periods (2010–2039, 2040–2069 and 2070–2099) and under both scenarios, temperature increases but the rate of increase under scenario A2 is higher than under B2. Potential evapotranspiration is another parameter that increases in all three studied time periods under both scenarios and at all stations (except for a few stations in time period 2010–2039) across the country, but the rate of increase under scenario A2 is again higher than under B2. Therefore, it can be said that, during the following decades and under both scenarios, temperature and potential evapotranspiration show an increase, and this increase intensifies from 2010–2039 toward 2070–2099. This condition would limit water availability and increase the demand for water in different sectors. However, regarding precipitation, the results do not follow a clear ascending or descending trend like that seen for temperature and potential evapotranspiration. For example, under both scenarios in 2010–2039, some stations show an increase but some show a decrease. From 2010–2039 toward 2070–2099, more stations show a decrease in precipitation, and in 2070–2099 all but a few stations have a decrease in precipitation compared to the base time period. Variation of precipitation under scenario A2 is higher than under B2. Although the results produced under scenarios A2 and B2 are different, the general trends for all three parameters are almost the same for both scenarios. This indicates that Iran will be strongly affected by global warming and climate change during future decades. As most parts of Iran are hyper-arid, arid and semi-arid regions, water shortage is already a big problem for social and economic development. Mean annual precipitation over the country is about 250 mm, whereas mean annual potential evapotranspiration is over 2100 mm, resulting in high sensitivity of the state to water-related problems. Climate change would definitely intensify this condition over the coming decades. Therefore, to be able to cope with the difficult conditions expected in the future, more research and efficient management and planning strategies are required, especially for high-risk zones where the greatest effects of climate change are expected to take place. According to this research, western parts of the country are at most threat of water shortage in the future.
Disclosure statement
No potential conflict of interest was reported by the authors.
References
- Abbaspour, K.C., et al., 2009. Assessing the impact of climate change on water resources in Iran. Journal of Water Resources Research, 45 (10), W10434 (pp:16).
- Abtew, W. and Melesse, A., 2013. Evaporation and evapotranspiration. Netherlands: Springer.
- Acharya, A., Lamb, K., and Piechota, T.C., 2013. Impacts of climate change on extreme precipitation events over Flamingo Tropicana watershed. JAWRA Journal of the American Water Resources Association, 49 (2), 359–370. doi:10.1111/jawr.2013.49.issue-2
- Andreadis, K.M. and Lettenmaier, D.P., 2006. Trends in 20th century drought over the continental United States. Geophysical Research Letters, 33 (10), L10403. doi:10.1029/2006GL025711
- Azaranfar, A., Abrisham, A., and Tajreshi, M., 2009. Analysis of impact of climate change in precipitation and temperature in Zayanderud Basin. 4th Iranian national conference on water resource, Tehran, Iran.
- Bari Abarghouei, H., et al., 2011. The survey of climatic drought trend in Iran. Stochastic Environmental Research and Risk Assessment, 25 (6), 851–863. doi:10.1007/s00477-011-0491-7
- Bates, B.C., et al., eds., 2008. Climate Change and Water, technical paper of the Intergovernmental Panel on Climate Change. Geneva: IPCC Secretariat.
- Betts, R.A., et al., 2007. Projected increase in continental runoff due to plant responses to increasing carbon dioxide. Nature, 448 (7157), 1037–1041. doi:10.1038/nature06045
- Dastorani, M.T., et al., 2011. Assessment of potential climate change impacts on drought indicators (Case study: Yazd station, Central Iran). Journal of Desert, 16, 159–167.
- Ge, Z.-M., et al., 2013. Effects of climate change on evapotranspiration and soil water availability in Norway spruce forests in southern Finland: an ecosystem model based approach. Ecohydrology, 6 (1), 51–63. doi:10.1002/eco.v6.1
- Gedney, N., et al., 2006. Detection of a direct carbon dioxide effect in continental river runoff records. Nature, 439, 835–838. doi:10.1038/nature04504
- Giorgi, F., et al., 2001, Regional climate information, evaluation and projections, Chapter 10. In: J.T. Houghton, et al. eds., Climate change 2001: The Scientific Basis Contribution of Working Group I to the Third Assessment Report of the Intergovernmental Panel on Climate Change. Cambridge: Cambridge University Press, 583–638.
- Harmsen, E.W., et al., 2009. Seasonal climate change impacts on evapotranspiration, precipitation deficit and crop yield in Puerto Rico. Agricultural Water Management, 96 (7), 1085–1095. doi:10.1016/j.agwat.2009.02.006
- Karamouz, M., et al., 2009. Long lead flood simulation using downscaled GCM data in arid and semi-arid regions: a case study. Journal of Desert, 14 (2), 185–196.
- Khalil, A.A., 2013. Effect of climate change on evapotranspiration in Egypt. Researcher, 5 (1), 7–12.
- Kousari, M.R., et al., 2014. Trend detection of drought in arid and semi-arid regions of Iran based on implementation of reconnaissance drought index (RDI) and application of non-parametrical statistical method. Water Resources Management, 28 (7), 1857–1872. doi:10.1007/s11269-014-0558-6
- Massah Bavani, A.R., 2006. Risk assessment of climate change and its impacts on water resources, Case study: Zayandeherud basin. Thesis (PhD). Tarbiat Modarres University, Iran (in Persian).
- Milly, P.C.D., Dunne, K.A., and Vecchia, A.V., 2005. Global pattern of trends in streamflow and water availability in a changing climate. Nature, 438 (7066), 347–350. doi:10.1038/nature04312
- Oki, T. and Kanae, S., 2006. Global hydrological cycles and world water resources. Science, 313 (5790), 1068–1072. doi:10.1126/science.1128845
- Piao, S., et al., 2007. Changes in climate and land use have a larger direct impact than rising CO2 on global river runoff trends. Proceedings of the National Academy of Sciences, 104 (39), 15242–15247. doi:10.1073/pnas.0707213104
- Ravazzani, G., et al., 2012. Modified Hargreaves-Samani equation for the assessment of reference evapotranspiration in Alpine river basins. Journal of Irrigation and Drainage Engineering, 138 (7), 592–599. doi:10.1061/(ASCE)IR.1943-4774.0000453
- Rosenberg, E.A., et al., 2010. Precipitation extremes and the impacts of climate change on stormwater infrastructure in Washington State. Climatic Change, 102 (1–2), 319–349. doi:10.1007/s10584-010-9847-0
- Takara, K., et al., 2009. Assessing climate change impact on water resources in the tone river basin, Japan using super-high-resolution atmospheric model output. Journal of Disaster Research, 4 (1), 12–23.
- Tanasijevic, L., et al., 2014. Impacts of climate change on olive crop evapotranspiration and irrigation requirements in the Mediterranean region. Agricultural Water Management, 144, 54–68. doi:10.1016/j.agwat.2014.05.019
- Trenberth, K.E., 2008. The impacts of climate change and variability on heavy precipitation, floods and drought. In: M.G. Anderson, ed. Encyclopedia of hydrological sciences. John Wiley and Sons. Part 17.
- Trenberth, K.E., 2011. Changes in precipitation with climate change. Climate Research, 47 (1), 123–138. doi:10.3354/cr00953
- UNFCCC (United Nations Framework Convention on Climate Change), 1992. United Nations Framework Convention on Climate Change [online]. United Nations. Available from: http://unfccc.int/2860.php [Accessed 7 October 2012].