
ABSTRACT
A regionalized rain/no-rain classification (RNC) based on scattering index methodology is developed for detecting rainfall signatures over the land regions of the Mahanadi basin (India), using data products from the passive and active sensors onboard the Tropical Rainfall Measuring Mission (TRMM), namely the TRMM Microwave Imager (TMI) and Precipitation Radar (PR). The proposed model, developed using data for two years from the orbital database, was validated using PR and in-situ data for selected case study events in 2011 and 2012. Performance evaluation of the model is discussed using 10 metrics derived from the contingency table. Overall, the results show superior performance, with an average probability of detection of 0.83, bias of 1.10 and odds ratio skill score greater than 0.93. Accurate rainfall detection is obtained for 95% of case study events. The relative performance of the proposed model is dependent on rainfall type, but it should be useful in rainfall retrieval algorithms for current missions such as the Global Precipitation Measurement Mission.
Editor M.C. Acreman; Associate editor Y. Gyasi-Agyei
1 Introduction
For more than two decades, microwave radiometers have been used to produce unprecedented satellite images of Earth’s weather and proved to be a valuable resource for quantitative estimation of precipitation from space. Significant contributions have been extended by the microwave instruments onboard the Tropical Rainfall Measuring Mission (TRMM) satellite, namely the TRMM Microwave Imager (TMI) and the Precipitation Radar (PR) (Petty and Krajewski Citation1996, Kummerow et al. Citation1998, Anita et al. Citation2008, Montero-Martinez et al. Citation2012, Sun et al. Citation2012, Tarnavsky et al. Citation2012, Saber et al. Citation2014, Moazami et al. Citation2015). With the widespread acceptance of microwave-based precipitation products, it has also been recognized that they include large uncertainties (Kummerow et al. Citation1998, Citation2005, Coppens et al. Citation2000). Studies that quantified the global uncertainty offered by microwave rainfall algorithms showed climatologically distinct space/time domains contributing approximately 25% uncertainty to their rainfall products which goes undetected by a microwave radiometer (Kummerow et al. Citation2005). Nearly 20% of this can be attributed to changes in cloud morphology and 5% to the rain/no-rain thresholds.
To date, most instantaneous passive microwave rain retrieval algorithms make use of a database constructed using a cloud model simulation that associates calculated microwave brightness temperatures to physically plausible sample rain events. Delineation of rainfall signatures from microwave footprints, also known as rain/no-rain classification (RNC) is an essential pre-processing step which assists in the succeeding rainfall retrieval technique (using the database). Physically based over-land rainfall retrieval algorithms using microwave data incorporate rainfall screening as an integral part before applying the succeeding over-land rain retrieval techniques. According to Grody (Citation1991), “the physics of rain detection and screening are every bit as important as those of conversion”. The emissivity characteristics of background surfaces (land/ocean) play a crucial role in the proper understanding of the fundamentals of RNC classification. The existing RNC algorithms to detect rainfall signatures follow different principles depending on whether the underlying surface is land or ocean. This is because the ocean surface appears “cold” to a radiometer operating in the microwave region, thereby offering good contrast for detecting rain drops, which appear radiometrically warm. As this phenomenon utilizes the strong physical relationship between low-frequency (6–37 GHz) microwave brightness temperature (Tb) and liquid rainfall, over-ocean RNC techniques are essentially emission based. However, as land appears as a radiometrically “warm” background, the warm emission from raindrops becomes cluttered by emission from the highly varying land surface background. Hence, unlike the oceans, land surfaces present difficulty in modelling the RNC algorithms due to the spatio-temporal variations of emissivity with varying surface conditions (Prigent et al. Citation1998, Weng et al. Citation2001, Pellarin et al. Citation2003).
Over-land RNC algorithms rely solely on the ice scattering phenomenon in the high-frequency (85 GHz) microwave channel (Wilheit Citation1986, Spencer et al. Citation1989, Grody Citation1991, Adler et al. Citation1993, Ferraro and Marks Citation1995, Lin and Hou Citation2008, Wang et al. Citation2009, Gopalan et al. Citation2010). Over-land RNC algorithms are considered ambiguous in nature due to several factors, such as saturation of the 85GHz Tb during heavy rainfall events, depression of the 85GHz Tb in the presence of desert/snow cover, and a change in emissivity due to surface wetness during rainfall, which cause difficulty in using radiative transfer models. These uncertainties need to be tackled to avoid erroneous estimations of rainfall (Wilheit Citation1986, Ferraro et al. Citation1998, Kummerow Citation2001).
As experience with SI-based RNC studies grew, it became increasingly important to develop algorithms to suit the highly varying emissivity from the background land surface. Results of the ensuing development of RNC algorithms over the land regions are summarized in . To date, various approaches exist to accurately detect areas where rain is falling within a radiometer footprint (or pixel). One of the first rainfall screening studies was conducted by Ferraro et al. (Citation1986). They proposed the use of multiple microwave frequency channels from the Scanning Multichannel Microwave Radiometer (SMMR) to identify rainfall signatures. Pioneering work by Grody (Citation1991) initiated the use of RNC algorithms to pre-process rainfall retrieval algorithms such as the Goddard scattering algorithm (GSCAT) (Adler et al. Citation1994, Ferraro et al. Citation1994, Kummerow and Giglio Citation1994, Kummerow et al. Citation1996, Ferraro Citation1997, Seto et al. Citation2005).
Table 1. Global rain/no-rain classification algorithms based on scattering index, SI.
The screening methodology has evolved continuously and is known as the Grody-Ferraro screening methodology; it is currently built into the operational satellite precipitation algorithm known as the Goddard profiling algorithm (GPROF) (Kummerow Citation2001). RNC algorithms based on scattering index (SI) by Grody (Citation1991) relied largely on low-frequency microwave channels, especially 19 and 22 GHz in vertical polarization. Adler et al. (Citation1993) devised a global empirical relation for the Special Sensor Microwave Imager (SSM/I) to calculate the estimated value of Tb at 85 GHz (V) under clear-sky/non-rainy conditions (Tb,est) using a fixed value of 243 K. Later, Ferraro et al. (Citation1994) and Ferraro and Marks (Citation1995) suggested the concept of using low-frequency channel combinations (10–37 GHz) to represent Tb,est. Since the introduction of the Grody-Ferraro screening methodology (Ferraro et al. Citation1986, Grody Citation1991, Citation1998), it has been the technique most applied for use in microwave land precipitation algorithms. Various versions of this technique (based on SI) have been applied in SSM/I, TMI and Advanced Microwave Scanning Radiometer-EOS (AMSR-E) missions (McCollum and Ferraro Citation2003). The GPROF employs an RNC discrimination algorithm prior to rainfall retrieval using a probabilistic Bayesian approach (Kummerow et al. Citation2011). Nevertheless, RNC discrimination over land regions is still seen as a challenging task (Grecu and Anagnostou Citation2001, Seto et al. Citation2005, Biscaro and Morales Citation2008, Kida et al. Citation2009). An authoritative description of RNC using passive radiometers can be found in Indu and Kumar (Citation2014).
RNC algorithms developed globally might not perform well for regional catchments of small areal extent. This can be attributed to the spatio-temporal variations of land surface emissivity values. Hence, global RNC methods cannot be efficiently applied for rainfall pre-processing and weather-related studies over such areas. Keeping this in mind, the present study proposes a regionalized RNC algorithm over the land regions of the Mahanadi basin in India. The Tb,est value is modelled using a combination of microwave low-frequency channels that are least sensitive to scattering and better represent the emissivity variations of the study region. With the launch of successor missions to study precipitation measurement on a global scale, several microwave sensors have recently been or will soon be launched into orbit (Tapiador et al. Citation2012, Tanvir et al. Citation2014). At this stage, the present study uses orbital data products from the TRMM satellite, namely 1B11, 2A12, 2A21, 2A25 and 2A23. However, future extensions of this study are aimed at assisting RNC discrimination using the more recently launched Global Precipitation Measurement (GPM) mission, which carries a dual-frequency precipitation radar (DPR) accompanied by the Global Microwave Imager (GMI) (Islam et al. Citation2012, Hou et al. Citation2013). Details of the study region and data used are presented in Sections 2 and 3, respectively. The SI methodology implemented for RNC and metrics used for performance evaluation are explained in Section 4. Section 5 discusses the results of dichotomous classification, and key conclusions are summarized in Section 6.
2 Study region
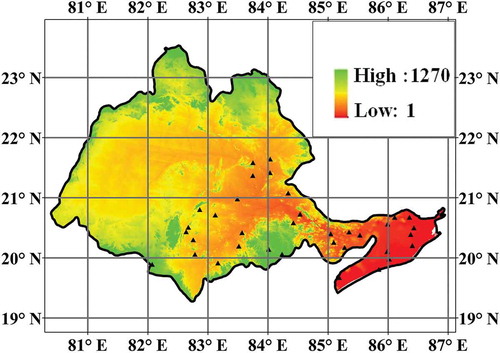
The study region selected for this work is the basin of the River Mahanadi, India, covering an area of approximately 141 589 km2 with an average elevation of 426 m. Situated between latitudes 19°N and 24°N and longitudes 80°E and 87°E, the basin extends across four states, namely Madhya Pradesh, Orissa, Bihar and Maharashtra, flanked by the central Indian hills to the north, the Eastern Ghats on the south and east, and the Maikala range to the west. Physiographic classification of the basin shows the hilly regions of the northern plateau and Eastern Ghats, the delta of the coastal plains, and the central interior region traversed by the River Mahanadi and its tributaries. From it can be seen that the basin has mainly vegetative land cover, comprising forest, cropland, grassland, etc. shows the topography of the study region.
Figure 1. Land use/land cover in the Mahanadi basin (2010).
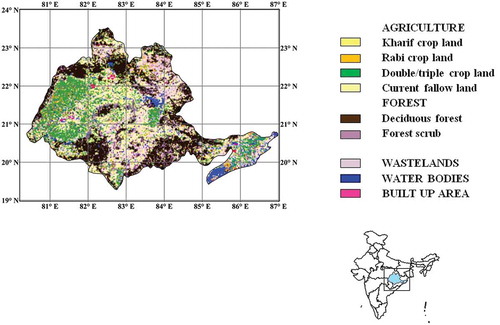
Figure 2. Topography of the Mahanadi basin from the GTOPO digital elevation model. ▴, locations of the automatic weather stations within the basin.
The basin experiences four seasons: cold weather, hot weather with frequent thunderstorms, southwest monsoon and post monsoon. The average highest and lowest relative humidities in the basin are 82% and 31.6%, respectively. The basin, which has a typical tropical monsoon climate, receives heavy to very heavy rainfall during the Indian summer monsoonal months of June to September (when monsoon depressions from the Bay of Bengal move northwestward). The rainfall of the Mahanadi basin compared with the average rainfall for India as a whole differs by 250 mm in monsoon months (with Mahanadi receiving 1200 mm and India receiving 945 mm). Even a small variation in this seasonal rainfall can have an adverse impact on the economy. In the past, the basin has been repeatedly subjected to adverse hydro-meteorological conditions such as floods, droughts and cyclones. Therefore, rainfall retrieval algorithms generated for the study region using passive microwave data require an efficient RNC algorithm that can effectively detect the rainfall signature irrespective of emissivity variations offered by the vegetated land surface background.
3 Data used
TRMM was a joint mission between the National Aeronautics and Space Administration (NASA) and the Japan Aerospace Exploration Agency (JAXA) to monitor and study tropical rainfall. Launched in 1997 into a near circular orbit, it had two instruments operating in the microwave spectrum, namely the TRMM Microwave Imager (TMI) and the Precipitation Radar (PR). A detailed description of the TRMM sensor package is available in Kummerow et al. (Citation1998). The current study utilizes the latest version (version 7) of data from the TRMM Science Data and Information System (TSDIS) for a 4-year data period from 2009 to 2012. The data products are briefly summarized below.
3.1 Precipitation radar (PR) data
The TRMM PR was the first rain radar in space to have the capacity to provide three-dimensional rainfall structure. Operating at 13.8 GHz, this 128-element active phased array system provided a vertical resolution of 250 m at nadir (Kummerow et al. Citation1998). The sensitivity of the PR was 0.5 mm/h (Kawanishi et al. Citation2000). The vertical and horizontal resolutions of PR data were 250 m and 5 km (i.e. ~0.04°), respectively. As the geometrical configurations of TMI and PR are different, the same region was sampled with an approximate time shift of 1 min between the two instruments (Viltard et al. Citation2000, Montero-Martinez et al. Citation2012). The data used for the present study include surface-type flags from the standard product 2A21 (Meneghini et al. Citation2000), rainflags (rain certain/rain possible/no rain), rainfall type (convective/stratiform) from the standard product 2A23 (Awaka et al. Citation1998), and the near-surface rain rate from the 2A25 product (Iguchi et al. Citation2000).
3.2 TRMM microwave imager (TMI) data
The TRMM passive instrument measured Tb at five frequencies (10.65, 19.35, 21.3, 37.0 and 85.5 GHz) using both horizontal (H) and vertical (V) polarizations, except for the 21.3 GHz channel which was measured in vertical polarization only. Hereafter, these channels will be referred to as 10 V, 10 H, 19 V, 19 H, 22 V, 37 V, 37 H, 85 V and 85 H, respectively. The 1B11 data product has horizontal resolution varying with frequency (5 km × 7 km for 85 GHz to 10 km × 63 km for 10 GHz). For the present study, data for TMI brightness temperatures from the standard product 1B11 and surface flags from the standard product 2A12 (Kummerow Citation2001, Gopalan et al. Citation2010) were used.
3.3 The 3B42 data
The TRMM Multi-satellite Precipitation Analysis (TMPA) level-3 data product, also known as 3B42, combines precipitation estimates from various satellite systems (passive microwave data and geostationary infrared data) as well as land surface precipitation gauge analysis, to produce high-quality precipitation estimates. The TMPA data are computed at a spatial resolution of 0.25° × 0.25° with a 3-hourly temporal resolution over the tropical region (Huffman et al. Citation2007, Huffman Citation2010, Huffman and Bolvin Citation2013). The TRMM 3B42 product provides a good qualitative check for rainfall patterns and has been widely used for many research applications (Bitew et al. Citation2012, Gianotti et al. Citation2012, Wu et al. Citation2012, Liu Citation2015). For the present study, gridded rainfall data from 3B42 were used to select 15 typical dates having high rainfall values over the study region during the monsoon months of 2011 and 2012. These were examined using the TRMM Online Visualization and Analysis System (TOVAS). More details about TOVAS can be obtained at http://disc2.nascom.nasa.gov/Giovanni/tovas/.
3.4 Automatic weather station (AWS) raingauge data
The automatic weather station (AWS) designed by the Indian Space Research Organization (ISRO) is a very compact, low-cost system housed within a portable self-contained package. Among many other sensors, it has a tipping-bucket raingauge with accuracy better than 1 mm. Presently, more than 300 (rapidly increasing with time) AWS are deployed over specific regions of India. These data are available through the website www.mosdac.gov.in. For the validation of the proposed algorithm, AWS raingauge data for all 34 stations () in the study region for the Indian summer monsoonal months of 2011 and 2012 were used.
Table 2. Automatic weather stations (AWS) located within the Mahanadi basin.
4 Methodology
The methodology for developing the regional SI-based rainfall screening technique using passive sensor footprints is summarized in .
Figure 3. Flowchart summarizing the methodology adopted.
4.1 Data collocation
As the spatial resolutions of TMI channels vary with respect to one another as well as with respect to PR data, collocation was performed as the initial step. Several studies have approached collocation by spatial resolution enhancement (Rapp et al. Citation2009). In the present study, the resolution of low-frequency channels (10 V, 10 H, 19 V, 19 H, 21 V, 37 V and 37 H) was increased by a linear interpolation technique to match the resolution of the 85 V channel. Collocation was performed by using geolocation information from the TRMM PR and TMI dataset (Gopalan et al. Citation2010). As a result, a TMI pixel can be assigned at the 85 V resolution as the “nearest neighbour” for every PR pixel in an orbit, using:
where Di refers to the distance between each of the ith TMI pixels from a given PR pixel. This process makes available three to four PR pixels as the nearest neighbours for every TMI pixel within a PR swath. As a result, for every high-resolution TMI 85 V pixel, corresponding PR pixels, near-surface rain rate and rain type were estimated. The surface type information from the PR 2A12 data product was used to extract/filter all the footprints (or pixels) lying over the land region of the Mahanadi basin. In this process, the pixels tagged as “coast” are excluded from the analysis. The rainfall type (convective and stratiform) represented by each of these collocated over-land pixels was estimated using storm type information present in the TRMM 2A23 data product. This initial data processing procedure, comprising data collocation and extraction of over-land footprints, was adopted for all the orbits passing over the study region during the 4-year period 2009 to 2012.
4.2 Rain/no-rain classification based on scattering index
The present study used collocated data over the land regions of the study area to develop a region specific SI, using the synergy of low-frequency TMI channels. The key idea in this technique is that Tb for the 85 V channel is affected by frozen ice particles and raindrops in the atmosphere. As over-land rainfall retrieval from passive sensors relies on ice scattering in the 85 V channel, the basis for developing SI involves modelling the 85 V Tb during clear-sky days (Tb,est). The value of Tb,est represents the 85 V Tb value when there is no scattering in the atmosphere. This study used quasi-simultaneous observations at low-frequency TMI channels (least affected by scattering due to ice clouds aloft) to model the non-scattering 85 V Tb. To examine the scattering effects of various TMI channels, collocated TMI Tb (for the 2-year period 2009 and 2010) for all the TMI channels was plotted against near surface rain rate from the active sensor (PR), after binning the rain rate. The results, as seen in , show that the 85 (V & H) and 37 (V & H) channels are most sensitive to over-land rainfall as compared to all the other TMI channels (10 V, 10 H, 19 V, 19 H, 22 V). Development of Tb,est should include combinations of those channels that are least affected by ice scattering in the atmosphere and that have increased sensitivity to land surface emissivity. Different land surfaces contribute varying amounts of emission to a microwave radiometer footprint (Ferraro et al. Citation1998). Demonstrating the behaviour of microwave land surface emissivity over varying land surface conditions has been attempted on a global scale by Prigent et al. (Citation1998), Weng et al. (Citation2001) and Pellarin et al. (Citation2003). A predominantly vegetative land surface background, such as that observed in the study region, would contribute volume scattering, as the microwave radiation can arise from below and within the canopy.
Figure 4. Relationship of near surface rain rate (NSR) with collocated over-land Tb (from TMI) for the Mahanadi basin.
The present study used Tb from the 19 V and 22 V channels during clear-sky conditions for simulation, as these channels are known to remain least affected by scattering due to the presence of ice clouds (Ferraro et al. Citation1998). These channels are also known to better represent Tb,est values due to their increased sensitivity to land surface emissivity (Adler et al. Citation1994, Kummerow and Giglio Citation1994, Indu and Kumar Citation2014). The difference between Tb,est and the observed 85 V Tb (Tb,obs) gives a measure quantifying the degree of scattering by ice particles and raindrops in which rain rate is proportional to the amount of scattering. Once Tb,est has been developed, the SI is obtained using:
Defining a suitable threshold to detect raining clouds to suit every climatic regime is nearly impossible due to the lack of corresponding validation data. The usual procedure for selecting a threshold is either to detect even the lightest rain at the cost of misclassifying non-raining clouds or to detect rain only above a certain threshold at the expense of eliminating light rain pixels. The choice of either a liberal or a conservative threshold will affect the accuracy of the RNC and this area needs to be researched further. Several authors have come up with different threshold values for detecting rainfall signatures using SI models. The threshold is either set to zero or estimated to be equivalent to kσ, where k is a constant varying with area and climatic conditions and σ depicts standard deviation of the residuals between estimated and observed 85 V for the non-rainy period selected for analysis (Seto et al. Citation2005). The present study uses an ideal value of zero as the suitable threshold for scattering. Throughout this study, the above explanation means that any value of SI even slightly greater than zero is attributed to the presence of atmospheric ice and hence is indicative of rainfall signature.
4.3 Categorical statistics
This study analysed the performance of the proposed RNC method using a total of 10 performance statistics. RNC is a typical example of dichotomous classification having just two possibilities, either zero or unity. Hence, the result of the categorical estimate can be expressed in the form of a 2 × 2 contingency matrix, as shown in (Tartaglione Citation2010), wherein the elements of the table denote the number of positive estimates (hits, element a), the number of events with a negative estimate (misses, element b), the number of positive estimates that were not accompanied by an event (false alarms, element c), and the number of negative estimates that did not have any associated events (element d) (Schaefer Citation1990). The 10 performance statistics used in the present study are given in .
Table 3. Contingency matrix.
Table 4. Performance statistics used in the study.
The most popular measures to assess RNC are probability of detection (POD) and false alarm ratio (FAR). POD, or prefigurance (Panofsky and Brier Citation1965), is the likelihood that an event would be estimated given that it occurred. The false alarm ratio (FAR) is an element of the conditional distribution of events given the estimate. Due to the negative orientation of FAR, smaller values indicate better estimates (Wilks Citation1995). Another measure used to compare the average estimate with the average observations is the bias. The bias (B) signifies the ratio of the number of “yes” estimates to the number of “yes” observations. This measure when less than one indicates underestimation and when greater than one indicates overestimation. The threat score (TS), or critical success index (CSI), indicates the number of correct “yes” estimates divided by the total number of occasions on which the event was estimated or observed (Wilks Citation1995). CSI has been widely used as a performance measure for rare events as it does not use the content of null events, unlike POD and FAR (Montero-Martinez et al. Citation2012).
This study used various skill scores or relative accuracy measures derived from contingency tables. A skill score is the ratio of differences of scalar representations of the classification performance (Stanski et al. Citation1989, Wilks Citation1995). Different skill scores perform differently. Some of the skill scores used in the present study are the Heidke skill score (HSS), the Kuiper skill score (KSS), the Gilbert skill score (GSS) and the odds ratio skill score (ORSS). The ideal classification yields a HSS value of 1, which implies that the performance of the classification is 100%, whereas inferior classification can even take negative values. The GSS, also known as the equitable threat score, was proposed by Gilbert (Citation1884). A perfect estimate of the GSS is a value of 1, whereas a worst estimate is a value of 0. The “odds” or “risk” of an event happening, denoted by the ORSS, is the ratio of the probability that the event will happen to the probability of it not happening. The ORSS varies between +1 and –1, where a score of 1 indicates perfect skill and a score of 0 represents no skill. Negative values imply that the estimate was opposite to what was originally observed. Stephenson (Citation2000) stated that associated variables giving odds ratios larger than unity can be tested for significance by considering the natural logarithm of the odds ratio referred to as “log odds”. The present study evaluated the performance of the proposed RNC algorithm on selected dates using these 10 performance measures and the case study results are presented in Section 5.
5 Results and discussion
5.1 Proposed model
As global scattering indices are highly variable for different regions and seasons, a regional scattering index would better explain the background emissivity variations (Mishra et al. Citation2011). The present study was conducted over the Mahanadi basin, India, and the performance of the algorithm was validated using PR rainflag data for a total of 15 dates during the monsoon seasons of 2011 and 2012. The PR 2A25 product rainflag provides “rain” and “no rain” definitions for each pixel. Rain/no-rain (RNC) algorithms of TMI are usually evaluated by assuming the RNC given by the PR to be “true” or near perfect. This assumption is acceptable in evaluating RNC by TMI over land, because the PR detects precipitation independently of land surface type with a very high accuracy (Seto et al. Citation2005, Tanvir et al. Citation2014 among others). Studies by Seto et al. (Citation2008) summarized several PR-dependent RNC algorithms that employed PR rainflags for validation.
This study used a total of 1 623 070 collocated over-land TMI datasets under clear-sky conditions from all orbits passing over the Mahanadi basin during the years 2009–2012. As explained in Section 4.2 and from , channels 19 V and 22 V were used to model high-resolution 85 V Tb under clear-sky conditions as they are least affected by scattering (Ferraro et al. Citation1998). The 19 V and 22 V channels are a good choice also because of their sensitivity to topography and land surface emissivity. Varying topography tends to modify the viewing angle locally with respect to the horizontal and vertical polarizations. The differing slopes in the topography (as observed for the study region) tend to mix the vertical and horizontal polarizations as defined relative to the mean flat surface. Vegetative growth usually changes with topography, and the 19 GHz channel is known to be more sensitive to topography (Prigent et al. Citation1998). The present study utilizes the vertical polarization as it is known to be less affected by aliasing with changes in land use/land cover. Also, with increasing biomass density, the vertical polarization is known to increase compared to the horizontal polarization.
From the analysis conducted with various linear polynomial models, the polynomial regression model shown by Equation (3) was chosen to depict Tb,est for the Mahanadi basin using a 2-year orbital database.
The values of the model coefficients in Equation (3) at the 95% confidence level are: a = 215.4, b = −14.91, c = 14.73, d = 0.0298, e = −0.0082 and f = −0.0202.
In Equation (3), x denotes 19 V and y represents 22 V Tb. The observed fit has a correlation coefficient of 0.9080 and R2 is 0.81. That is, the model is able to explain 81% of the variation in 85 V Tb due to the low-frequency predictor variables of 19 V and 22 V. Though various thresholds of SI have been adopted by different authors, the present study used a threshold of 0, which means that any value of SI greater than 0 is considered as containing a rainfall signature.
5.2 Results of dichotomous classification
Evaluation of the proposed RNC algorithm is presented in a performance diagram. This diagram, popularly used for weather-related studies, shows the geometric relationship between the main quality measures (namely POD, FAR, B and CSI) obtained for the 15 case studies (Roebber Citation2009). In , the dashed lines represent bias scores, with labels on the outward extensions of the lines. The crosshairs denote the confidence intervals achieved using 1000 bootstrapped samples from the contingency table. The labelled solid contours show critical success indices (CSI) (Roebber Citation2009).
Figure 5. Performance diagram showing categorical statistics for the 15 days. The triangles represent each of the 15 case study dates. Their locations on the performance diagram give the values of performance statistics (POD, B, FAR, CSI), with cross hairs representing the confidence interval obtained using 1000 bootstrapped samples from the contingency table. Success ratio = 1 − FAR.
From , it can be observed that performance statistics for all the 15 case study dates lie in the upper right of the diagram, which indicates near perfect estimation. The average POD for all the events is 0.8326, giving confidence that the proposed classification method performs well in estimating individual precipitation events for the study area. In the case of FAR, the results indicate that, overall, the number of times that precipitation events were falsely detected is very low. The average bias value (1.10) indicates a very slight tendency of the classification to overestimate. A major limitation of the representation using a performance diagram is that it neglects knowledge of the number of times a null event was estimated (element d of the contingency table) (Stephenson Citation2000). However, when the event of interest is less rare, as in our case, it becomes important to account for the non-events in the analysis. To overcome this limitation, various skill scores were assessed for the case studies.
lists the results of dichotomous classification using the proposed model for the 15 selected case study dates. The values of HSS and KSS for all the dates lie between 0.57 and 0.85. From the discussions in Section 4.3, this indicates that the proposed method exhibits a fairly good level of skill. The HSS and KSS values are fairly similar for all the days, even though the latter uses unbiased random estimates as reference whereas the former uses biased ones. The value of the GSS observed is greater than 0.43 for all the days. Of all the performance measures, it shows relatively poor performance for the proposed classification method. The low value may be because it penalizes both misses and false alarms in the same way without distinguishing their sources. The ORSS values for all the days are higher than 0.93, which is a good indication of the performance of the proposed RNC method. Though the use of skill scores enables quantification of non-events in the verification process, they lack the ability to face statistical comparison/testing. To overcome this limitation, the log odds ratio was calculated for each of the days. The log odds ratios for all the days indicate that for the individual rain events the measure is significant at 95% confidence level. This implies that there is a less than 5% chance of the skill being due to pure chance. Overall comparison shows that the results of the proposed method are in good agreement with the validation data for the study region. Performance evaluation of the proposed model during different rain regimes is discussed in the next section.
Table 5. Results of dichotomous classification using proposed model for the 15 days.
5.3 Analysis based on rain type
Tropical precipitation can be broadly classified into convective rainfall of high rain rate (>5 mm/h) having a small, intense, horizontally inhomogeneous radar echo and stratiform precipitation of low rain rate (<5 mm/h) with a widespread, horizontally homogeneous radar echo (Schumacher and Houze Citation2003). To assess the sensitivity of the proposed model to rain types, the storm type information embedded in the 2A23 PR data product was used to classify each day’s footprints (or pixels) into convective and stratiform rainfall types. After classification, this study analysed the performance of the proposed RNC algorithm using POD and FAR measures. lists the results of dichotomous classification based on rainfall type. The average rain rate, number of footprints, POD and FAR estimated for both the rain types from show that, for each selected day during the monsoonal period, the majority of the footprints represent stratiform signatures. For the convective rain type, a FAR of zero for all the days implies that the model has successfully identified all the rainfall signatures. The highest POD, of 100%, was observed for 21 June 2012 and lowest POD, of 74%, was observed for 2 July 2011. Analysis of stratiform rain type shows that, overall, the performance of the proposed model is directly proportional to the efficiency with which it is able to demarcate raining and non-raining pixels of stratiform rain type. The performance diagram for stratiform rainfall for all the days is shown in . This also supports the fact that the success of the proposed model is dependent on its capability of RNC of stratiform rainfall. The lowest value of POD (0.57) was obtained for 2 July 2011. From , it can be observed that, even though overall the proposed model performs efficiently, for 2 July 2011 the comparative performance is worst, with 60% POD, bias value of 0.86 and FAR of 30%, indicating underestimation.
Table 6. Results of dichotomous classification based on rainfall type for the 15 days.
Figure 6. Performance diagram showing categorical statistics for stratiform rainfall (as explained for ).
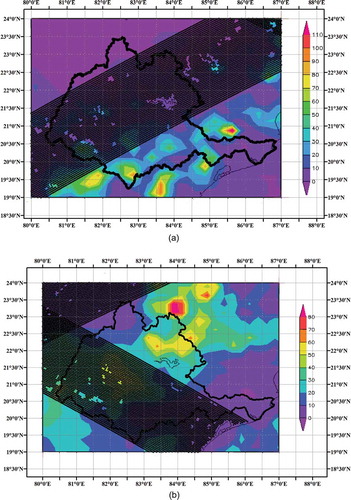
and shows the spatial distribution of accumulated rainfall occurring over the study region during the months June–July–August–September (JJAS) of 2011, which was estimated from the PR 2A25 data product. To analyse the performance of the proposed model on this date, 3B42 data showing accumulated rainfall for the date were overlain on the Mahanadi basin, as shown in . The corresponding orbital pass is also shown. It can be observed that the orbital pass considered for 2 July 2011 passed over the region with very little rainfall, most of which was stratiform in nature owing to the comparatively low detection rate. shows the 3B42 data and orbital pass over the basin for 21 June 2012. It can be observed that on 21 June 2012 the average rainfall received was between 0 and 80 mm and the orbital passes for this day overlapped with regions of high rainfall (nearly 60 mm). Hence, it can be concluded that the proposed method performs well during convective rainfall, but some anomaly is observed during stratiform rainfall.
Figure 7. Accumulated rainfall over the Mahanadi basin during JJAS 2011 showing (a) convective rainfall and (b) stratiform rainfall.
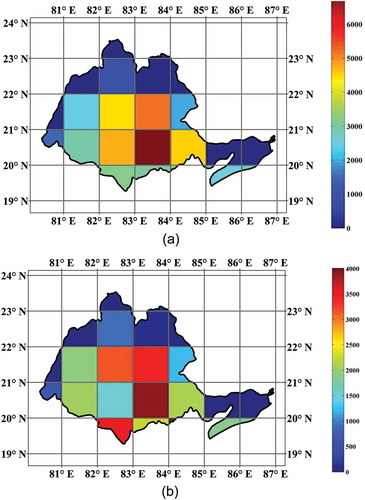
Figure 8. TRMM 3B42 product showing accumulated rainfall (mm) for the Mahanadi basin on (a) 2 July 2011 and (b) 21 July 2011.
5.4 Analysis using AWS raingauge data
Performance evaluation of the RNC algorithm is usually conducted on the assumption that RNC by the PR is always perfect. For the present study, the proposed RNC algorithm has also been validated using AWS raingauge data. For each of the case study dates, the geographical locations of all the TMI data points within each orbital pass were compared with the locations of all the 34 AWS. The TMI data points that were closest to the AWS stations (based on the nearest distance method) were employed for the present study. summarizes the comparison of results obtained using AWS and the PR rainflags as reference for the performance measures of POD, FAR, TS and B. Based on data availability, the results of four case study dates are presented. From , it can be observed that the proposed RNC algorithm performs well when compared with the AWS raingauge data, with high values of POD and low values of FAR for the case study dates except for 23 September 2011. Upon further examination it can be observed that very few TMI data points exist close to the AWS stations for 23 September 2011, of which most belong to the stratiform rainfall type. The results confirmed that model performance is affected when encountering low-intensity rainfall belonging to the stratiform regime.
Table 7. Results of proposed RNC algorithm validated with AWS raingauges and PR rainflags.
6 Conclusions
This study proposed a SI-based RNC algorithm to detect the presence of rainfall over land regions of the hydrologically variant basin of Mahanadi, India, using TRMM orbital data from passive and active sensors. The low-frequency channels 19 V and 22 V were used to estimate the non-scattering portion of 85 V Tb (Tb,est). The detection threshold for scattering (due to ice clouds) was considered to have an ideal value of zero. The performance of the proposed model was analysed for 15 individual precipitation events for 2011 and 2012 using 10 performance metrics derived from the contingency table. Visualization of multiple performance measures (POD, FAR, B and CSI), along with their corresponding confidence intervals using the performance diagram, indicated that the proposed method gives near perfect accuracy, with accurate rainfall detection for more than 95% of the case studies. Furthermore, statistical significance testing of the performance measures conducted using log odds ratios indicated that the results obtained are statistically significant and hence highly reliable.
Performance evaluation of the proposed model during convective and stratiform rainfall events indicated that model performance was affected when the rain type was stratiform with a rain rate of <1.7 mm/h. This was also observed during model validation using tipping-bucket raingauge data from the AWS located within the study region. Based on these results it can be inferred that the proposed RNC algorithm can be effectively used for rainfall preprocessing, or as a quality check for the Mahanadi basin. This would reduce the computational burden for succeeding rainfall retrieval algorithms applied over the study region. With the TRMM satellite having reached the end of its mission lifetime, it is expected that the proposed method will assist in the development of rainfall retrieval algorithms for the successor Global Precipitation Measurement (GPM) mission.
Acknowledgements
The TRMM data used in this study were acquired as part of the NASA Earth–Sun System Division, archived and distributed by the Goddard Earth Sciences (GES) Data and Information Services Center (DISC) Distributed Active Archive Center (DAAC). The authors wish to thank the reviewers for their constructive comments and suggestions which helped to improve the quality of the manuscript. The first author wishes to thank Dr. Kaushik Gopalan for providing fruitful discussions during the early phases of this study. The second author wishes to thank the support given by the Ministry of Earth Sciences, Government of India, through the project no. MoES/ATMOS/PP-IX/09.
Disclosure statement
No potential conflict of interest was reported by the authors.
References
- Adler, R., et al., 1993. Estimation of monthly rainfall over Japan and surrounding waters from a combination of low- orbit microwave and geosynchronous IR data. Journal of Applied Meteorology, 32, 335–356. doi:10.1175/1520-0450(1993)032<0335:EOMROJ>2.0.CO;2
- Adler, R., Huffman, G.J., and Keehn, P.R., 1994. Global tropical rain estimates from microwave-adjusted geosynchronous IR data. Remote Sensing Reviews, 11, 125–152. doi:10.1080/02757259409532262
- Anita, A., Neil, M., and Max, K., 2008. Evaluation of five satellite products for estimation of rainfall over Uganda. Hydrological Sciences Journal, 53 (6), 1137–1150. doi:10.1623/hysj.53.6.1137
- Awaka, J., Iguchi, T., and Okamoto, K., 1998. Early results on rain type classification by the tropical rainfall measuring mission (TRMM) precipitation radar. Proc. Eighth URSI Commission F Open Symp., Aveiro, Portugal, Union Radio-Scientifique Internationale, 143–146.
- Biscaro, T.S. and Morales, C.A., 2008. Continental passive microwave-based rainfall estimation algorithm: application to the amazon basin. Journal of Applied Meteorology and Climatology, 47, 1962–1981. doi:10.1175/2007JAMC1744.1
- Bitew, M.M., et al., 2012. Evaluation of high-resolution satellite rainfall products through streamflow simulation in a hydrological modeling of a small mountainous watershed in Ethiopia. Journal of Hydrometeorology, 13, 338–350. doi:10.1175/2011JHM1292.1
- Coppens, D., Haddad, Z.S., and Im., E., 2000. Estimating the uncertainty in passive microwave rain retrieval. Journal of Atmospheric and Oceanic Technology, 17, 1618–1629.
- Ferraro, R., et al., 1998. A screening methodology for passive microwave precipitation retrieval algorithms. Journal of Atmospheric Sciences, 55, 1583–1600. doi:10.1175/1520-0469(1998)055<1583:ASMFPM>2.0.CO;2
- Ferraro, R. and Marks, G.F., 1995. The development of SSM/I rain rate retrieval algorithms using ground based radar measurements. Journal of Atmospheric and Oceanic Technology, 12, 755–770. doi:10.1175/1520-0426(1995)012<0755:TDOSRR>2.0.CO;2
- Ferraro, R.R., 1997. Special Sensor Microwave Imager derived global rainfall estimates for climatological applications. Journal of Geophysical Research, 102, 16715–16735. doi:10.1029/97JD01210
- Ferraro, R.R., Grody, N.C., and Kogut., J.A., 1986. Classification of geophysical parameters using passive microwave satellite measurements. IEEE Transactions on Geoscience and Remote Sensing, 24, 1008–1013. doi:10.1109/TGRS.1986.289564
- Ferraro, R.R., Grody, N.C., and Marks, G.F., 1994. Effects of surface conditions on rain identification using the DMSP-SSM/I. Remote Sensing Reviews, 11, 195–209. doi:10.1080/02757259409532265
- Gianotti, R.K., Zhang, D., and Eltahir, E.A.B., 2012. Assessment of the regional climate model version 3 over the maritime continent using different cumulus parameterization and land surface schemes. Journal of Climate, 25, 638–656. doi:10.1175/JCLI-D-11-00025.1
- Gilbert, G.F., 1884. Finley’s tornado predictions. Amer. Meteor. J., 1, 166–172.
- Gopalan, K., et al., 2010. Status of the TRMM 2A12 land precipitation algorithm. Journal of Atmospheric and Oceanic Technology, 27, 1343–1354. doi:10.1175/2010JTECHA1454.1
- Grecu, M. and Anagnostou, E.N., 2001. Overland precipitation estimation from TRMM passive microwave observations. Journal of Applied Meteorology, 40, 1367–1380. doi:10.1175/1520-0450(2001)040<1367:OPEFTP>2.0.CO;2
- Grody, N.C., 1991. Classification of snow cover and precipitation using the special sensor microwave imager. Journal of Geophysical Research, 96, 7423–7435. doi:10.1029/91JD00045
- Hou, A.Y., et al., 2013. The global precipitation measurement (GPM) mission. Bulletin of American Meteorological Society, 95, 701–722. doi:10.1175/BAMS-D-13-00164.1
- Huffman, G.J., et al., 2007. The TRMM multi-satellite precipitation analysis (TMPA): quasi-global, multi-year, combined –sensor precipitation estimates at fine scales. Journal of Hydrometeorology, 8, 38–55. doi:10.1175/JHM560.1
- Huffman, G.J., 2010. The TRMM multi-satellite precipitation analysis (TMPA). In: F. Hossain and M. Gebremichael, et al., eds. Satellite applications for surface hydrology. New York: Springer, 3–22.
- Huffman, G.J. and Bolvin, D.T., 2013. Real-Time TRMM Multi-Satellite Precipitation Analysis Dataset Documentation. Available from: ftp://meso-a.gsfc.nasa.gov/pub/trmmdocs/rt/3B4XRT_doc_v7.pdf
- Iguchi, T., et al., 2000. Rain-profiling algorithm for the TRMM precipitation radar. Journal of Applied Meteorology, 39, 2038–2052. doi:10.1175/1520-0450(2001)040<2038:RPAFTT>2.0.CO;2
- Indu, J. and Kumar, D.N. 2014. Rain/no rain classification using passive microwave radiometers. Venkataraman Lakshmi, ISBN: 978-1-118-87203-1, Remote Sensing of the Terrestrial Water Cycle, American geophysical Union & John Wiley & Sons, Inc, pages 3–26.
- Islam, T., et al., 2012. Performance evaluation of the TRMM precipitation estimation using ground-based radars from the GPM validation network. Journal of Atmospheric and Solar-Terrestrial Physics, 77, 194–208. doi:10.1016/j.jastp.2012.01.001
- Kawanishi, T., et al., 2000. TRMM precipitation radar. Advances in Space Research, 25, 969–972. doi:10.1016/S0273-1177(99)00932-1
- Kida, S., et al., 2009. Improvement of rain/no-rain classification methods for microwave radiometer observations over the ocean using a 37 GHz emission signature. Journal of the Meteorological Society of Japan, 87A, 165–181. doi:10.2151/jmsj.87A.165
- Kummerow, C., et al., 1998. The tropical rainfall measuring mission (TRMM) sensor package. Journal of Atmospheric and Oceanic Technology, 15, 809–817. doi:10.1175/1520-0426(1998)015<0809:TTRMMT>2.0.CO;2
- Kummerow, C., 2001. The evolution of the Goddard profiling algorithm (GPROF) for rainfall estimation from passive microwave sensors. Journal of Applied Meteorology, 40, 1801–1820. doi:10.1175/1520-0450(2001)040<1801:TEOTGP>2.0.CO;2
- Kummerow, C., et al., 2005. Quantifying global uncertainties in a simple microwave rainfall algorithm. Journal of Atmospheric and Oceanic Technology, 23, 23–37.
- Kummerow, C. and Giglio, L., 1994. A passive microwave technique for estimating rainfall and vertical structure information from space. Part I: algorithm description. Journal of Applied Meteorology, 33, 3–18. doi:10.1175/1520-0450(1994)033<0003:APMTFE>2.0.CO;2
- Kummerow, C., Olson, W.S., and Giglio, L., 1996. A simplified scheme for obtaining precipitation and vertical hydrometeor profiles from passive microwave sensors. IEEE Transactions on Geoscience and Remote Sensing, 34, 1213–1232. doi:10.1109/36.536538
- Kummerow, C.D., et al., 2011. An observationally generated a priori database for microwave rainfall retrievals. Journal of Atmospheric and Oceanic Technology, 28, 113–130. doi:10.1175/2010JTECHA1468.1
- Lin, X. and Hou, A., 2008. Evaluation of coincident passive microwave rainfall estimates using TRMM PR and ground measurements as references. Journal of Applied Meteorology and Climatology, 47, 3170–3187. doi:10.1175/2008JAMC1893.1
- Liu, Z., 2015. Comparison of precipitation estimates between version 7 3-hourly TRMM multi-satellite precipitation analysis (TMPA) near-real-time and research products. Atmospheric Research, 153, 119–133. doi:10.1016/j.atmosres.2014.07.032
- McCollum, J. and Ferraro, R.R., 2003. The next generation of NOAA/NESDIS SSM/I, TMI and AMSR-E microwave land rainfall algorithms. Journal of Geophysical Research, 108, 8382–8404. doi:10.1029/2001JD001512
- Meneghini, R., et al., 2000. Use of the surface reference technique for path attenuation estimates from the TRMM precipitation radar. Journal of Applied Meteorology, 39, 2053–2070. doi:10.1175/1520-0450(2001)040<2053:UOTSRT>2.0.CO;2
- Mishra, A.M., et al., 2011. Improved rainfall estimation over the Indian regions using satellite infrared technique. Advances in Space Research, 48, 49–55. doi:10.1016/j.asr.2011.02.016
- Moazami, S., et al., 2015. Comprehensive evaluation of four high-resolution satellite precipitation products over diverse climate conditions in Iran. Hydrological Sciences Journal. doi:10.1080/02626667.2014.987675
- Montero-Martinez, G., Zarraluqui-Such, V., and Garcia-Garcia, F., 2012. Evaluation of 2B31 TRMM-product rain estimates for single precipitation events over a region with complex topographic features. Journal of Geophysical Research, 117, D02101.
- Panofsky, H.A. and Brier, G.W., 1965. Some applications of statistics to meteorology. University Park, PA: The Pennsylvania State University, 224.
- Pellarin, T., et al., 2003. Global soil moisture retrieval from a synthetic L-band brightness temperature data set. Journal of Geophysical Research, 108, 4364. doi:10.1029/2002JD003086
- Petty, G.W. and Krajewski, W., 1996. Satellite rainfall estimation over land. Hydrological Sciences Journal, 41, 433–451.
- Prigent, C., Rossow, W.B., and Matthews, E., 1998. Global maps of microwave land surface emissivities: potential for land surface characterization. Radio Science, 33, 745–751. doi:10.1029/97RS02460
- Rapp, A., Lebsock, M., and Kummerow, C., 2009. On the consequences of resampling microwave radiometer observations for use in retrieval algorithms. Journal of Applied Meteorology and Climatology, 48, 1981–1993. doi:10.1175/2009JAMC2155.1
- Roebber, P.J., 2009. Visualizing multiple measures of estimate quality. Weather and Estimating, 24, 601–608.
- Saber, M., et al., 2014. Comprehensive evaluation of four high-resolution satellite precipitation products over diverse climate conditions in Iran. Hydrological Sciences Journal. doi:10.1080/02626667.2014.987675
- Schaefer, J.T., 1990. The critical success index as an indicator of warning skill. Weather and Forecasting, 5, 570–575. doi:10.1175/1520-0434(1990)005<0570:TCSIAA>2.0.CO;2
- Schumacher, C. and Houze Jr., R.A., 2003. Stratiform rain in the tropics as seen by the TRMM precipitation radar. Journal of Climate, 16, 1739–1756. doi:10.1175/1520-0442(2003)016<1739:SRITTA>2.0.CO;2
- Seto, S., et al., 2008. Advanced rain/no-rain classification methods for microwave radiometer observations over land. Journal of Applied Meteorology and Climatology, 47, 3016–3029. doi:10.1175/2008JAMC1895.1
- Seto, S., Takahashi, N., and Iguchi, T., 2005. Rain/no-rain classification methods for microwave radiometer observations overland using statistical information for brightness temperatures under no-rain conditions. Journal of Applied Meteorology, 44, 1243–1259. doi:10.1175/JAM2263.1
- Spencer, R.W., Goodman, H.M., and Hood, R.E., 1989. Precipitation retrieval over land and ocean with the SSM/I: Identification and characteristics of the scattering signal. Journal of Atmospheric and Oceanic Technology, 6, 254–273. doi:10.1175/1520-0426(1989)006<0254:PROLAO>2.0.CO;2
- Stanski, H.R., Wilson, L.J., and Burrows, W.R., 1989. Survey of common verification methods in meteorology. WMO/TD-No.359, World Meteorological Organization, Geneva, Switzerland. 114.
- Stephenson, D.B., 2000. Use of the “Odds Ratio” for diagnosing forecast skill. Weather and Forecasting, 15, 221–232. doi:10.1175/1520-0434(2000)015<0221:UOTORF>2.0.CO;2
- Sun, Z., et al., 2012. Precipitation patterns and associated hydrological extremes in the Yangtze river basin, China, using TRMM/PR data and EOF analysis. Hydrological Sciences Journal, 57 (7), 1315–1324. doi:10.1080/02626667.2012.716905
- Tanvir, I., et al., 2014. Non-parametric rain/no rain screening method for satellite-borne passive microwave radiometers at 19-85 GHz channels with the random forests algorithm. International Journal of Remote Sensing, 35 (9), 3254–3267. doi:10.1080/01431161.2014.903444
- Tapiador, F.J., et al., 2012. Global precipitation measurement: methods, datasets and applications. Atmospheric Research, 104-105, 70–97. doi:10.1016/j.atmosres.2011.10.021
- Tarnavsky, E., Mulligan, M., and Husak, G., 2012. Spatial disaggregation and intensity correction of TRMM-based rainfall time series for hydrological applications in dryland catchments. Hydrological Sciences Journal, 57 (2), 248–264. doi:10.1080/02626667.2011.637498
- Tartaglione, N., 2010. Relationship between precipitation estimate errors and skill scores of dichotomous estimates. Weather Estimate, 25, 355–365.
- Viltard, N., et al., 2000. Combined use of the radar and radiometer of TRMM to estimate the influence of drop size distribution on rain retrievals. Journal of Applied Meteorology, 39, 2103–2114. doi:10.1175/1520-0450(2001)040<2103:CUOTRA>2.0.CO;2
- Wang, N.Y., et al., 2009. TRMM 2A12 land precipitation product-status and future plans. Journal of Meteorological Society of Japan, 87A, 237–253. doi:10.2151/jmsj.87A.237
- Weng, F., Yan, B., and Grody, N.C., 2001. A microwave land emissivity model. Journal of Geophysical Research, 106 (20), 115–20 123. doi:10.1029/2001JD900019
- Wilheit, T.T., 1986. Some comments on passive microwave measurement of rain. Bulletin of the American Meteorological Society, 67, 1226–1232. doi:10.1175/1520-0477(1986)067<1226:SCOPMM>2.0.CO;2
- Wilks, D.S., 1995. Statistical methods in the atmospheric sciences. San Diego, CA: Academic Press.
- Wu, H., et al., 2012. Evaluation of global flood detection using satellite-based rainfall and a hydrologic model. Journal of Hydrometeorology, 13, 1268.1284. doi:10.1175/JHM-D-11-087.1