
ABSTRACT
High-resolution data on the spatial pattern of water use are a prerequisite for appropriate and sustainable water management. Based on one well-validated hydrological model, the Distributed Time Variant Gains Model (DTVGM), this paper obtains reliable high-resolution spatial patterns of irrigation, industrial and domestic water use in continental China. During the validation periods, ranges of correlation coefficient (R) and Nash-Sutcliffe efficiency (NSE) coefficient are 0.67–0.96 and 0.51–0.84, respectively, between the observed and simulated streamflow of six hydrological stations, indicating model applicability to simulate the distribution of water use. The simulated water use quantities have relative errors (RE) less than 5% compared with the observed. In addition, the changes in streamflow discharge were also correctly simulated by our model, such as the Zhangjiafen station in the Hai River basin with a dramatic decrease in streamflow, and the Makou station in the Pearl River basin with no significant changes. These changes are combined results of basin available water resources and water use. The obtained high-resolution spatial pattern of water use could decrease uncertainty of hydrological simulation and guide water management efficiently.
Editor M.C. Acreman; Associate editor X. Fang
KEYWORDS:
1. Introduction
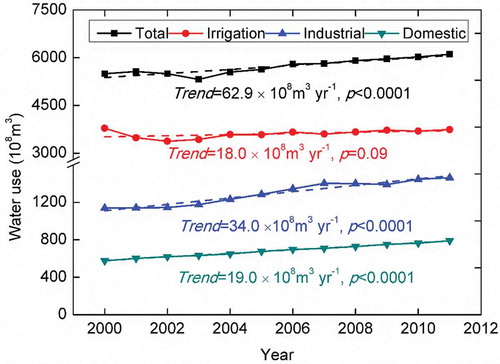
Water scarcity problems plague regions of many countries today. Typical examples are northern China; some provinces, such as Punjab province in north India and Sindh province in south Pakistan, on the border between India and Pakistan; the Middle East; and the middle and western areas of the USA. Approximately 2.4 billion people are currently living in highly water-stressed areas (Oki and Kanae Citation2006, Xia et al. Citation2007). While this problem includes the combined effects of human intervention and climate change, humans have affected terrestrial water fluxes on an unprecedented scale (Coe and Foley Citation2001, Dong et al. Citation2012, Chang et al. Citation2014, Zhan et al. Citation2014, Zuo et al. Citation2014). Humans directly change the dynamics of the water cycle and pose great threats to water availability, especially through water withdrawals for irrigation, industrial and domestic purposes (Haddeland et al. Citation2014). According to the statistics of the China Water Resources Bulletins for the years 2000–2011, annual amounts of irrigation, industrial and domestic water use and their total amounts are obtained, as shown in (http://www.mwr.gov.cn/), which depicts that all types of water use follow significant increasing trends in the period 2000–2012 (p < 0.1). In particular, the total water use is rising rapidly, almost reaching 635 × 109 m3, which is the upper limit for total water use for the year 2015 set by the Central People’s Government of the People’s Republic of China. Although irrigation water use indicates no significant increase in recent years, it accounts for almost 70% of total water use. Better management for these three types of water use will play an important role in future water resources and could ease water scarcity effects tremendously.
Figure 1. China: annual irrigation, industrial, domestic and total water use for the period 2000–2011 and linear trends (in 108 m3 year-1) showing p values of Student’s t confidence test of the trends.
Both the severe water shortage problems across the globe and the task to manage transboundary basins (such as those providing water resources to the Punjab province, north India) increase the need for information on spatial water use. Many studies have been conducted to estimate water use around the world. The earliest study is likely associated with the “Comprehensive Assessment of Freshwater Resources of the World” supported by a consortium of UN organizations, which proposed the first global water resources and water-use assessment system, symbolizing the start of water-use estimation (Raskin et al. Citation1997). Döll et al. (Citation1999) and Alcamo et al. (Citation1997) put forward the WaterGAP1.0 (Water – Global Assessment and Prognosis) model to assess the current water resources situation, which included a water-availability and a water-use model. These model simulations were carried out on a national scale. Döll and Siebert (Citation2002) presented a global model of irrigation requirements with a spatial resolution of 0.5°. Based on WaterGAP1.0, Alcamo et al. (Citation2003) constructed the WaterGAP2 model, which consisted of a global water-use model and global hydrology model. The development of WaterGAP2 mainly represented the combination of the computation of water availability at the river basin scale with the modelling of water use based on dynamics of structural and technological changes in various water-use sectors. Its spatial resolution was improved from a national scale to 0.5°. De Nys et al. (Citation2008) developed a simulation tool WaDI (Water Delivery for Irrigation) to address the strategic interaction of water demand and supply in irrigation schemes. Taking the semi-arid Northeast of Brazil as an example, Folhes et al. (Citation2009) used Landsat imagery to calculate water consumption by irrigated agriculture. Flörke et al. (Citation2013) developed the WaterGAP3 model to simulate historic domestic, manufacturing, and thermo-electric water uses. The spatial resolution at a global scale was further improved to 5′, which provided spatially explicit information. Nnaji et al. (Citation2013) used questionnaires, interviews, observations and secondary data to estimate the water supply and consumption status in Nsukka Metropolis. Condon and Maxwell (Citation2014) adopted an integrated hydrologic model to diagnose temporal and spatial patterns of managed irrigation and water availability in the Little Washita Basin in southwestern Oklahoma, USA.
Referring to China, many studies have attempted to obtain water-use quantities. The research methods can be classified into two categories. The first and simplest category is the regression analysis method, and these studies generally occurred in the earlier time. This method constructs regression models between water use and its factors and has a reasonable accuracy (Shao et al. Citation1998, Wang Citation2001). The second category comprises mathematical methods, which use advanced mathematical approaches, such as the least square, the neural network and the Markov chain method, to estimate water use (Zhu Citation2012, Zhao et al. Citation2013). Mathematical methods can obtain more accurate water-use estimates than regression analysis methods. However, neither method contains any mechanism processes, and they generally yield point estimations of water use that do not reflect information on spatial distribution.
Generally, some studies could add a water-use component to their hydrological models and obtain water-use distribution information, but the resolutions are not high enough for high-efficiency water resource management and limit the reliability of conclusions towards water management concepts derived from the hydrological simulations. For example, while WaterGAP models have experienced fast development at the simulation resolution from a national scale to 5′, the resolution is too coarse for accurate regional simulation. Other researchers have adopted methods without mechanism processes and could only obtain point estimation of water use. Therefore, the means to obtain high-resolution, such as 1-km, spatial water-use distribution information are needed. Estimating the spatial distribution of human water use properly may help to cope with the water shortage problems and could guide water management more efficiently. The models employed in the above studies can be divided into statistical and deterministic approaches. Statistical approaches, such as regression analysis methods and mathematical methods, calculate water-use information based on historical datasets and might reach their limits in terms of appropriateness for estimating future trends. In contrast, deterministic approaches, i.e. physically-based hydrological models could simulate the realistic water cycle and make forecasts in changing environments (e.g. under climate and land-use changes) and under conditions of changes in water users’ behaviour and technologies (e.g. improving irrigation efficiencies).
This paper combined the advantages of the latest research and finally obtained high-resolution spatial patterns of water use in continental China. We employed a well-validated hydrological model, the Distributed Time Variant Gains Model (DTVGM), to simulate three types of water-use distribution (irrigation water, industrial water and domestic water) with 1-km resolution. Section 2 introduces the data and methods; Section 3 displays and discusses the results; and Section 4 summarizes the conclusions.
2. Data and method
2.1 DTVGM model
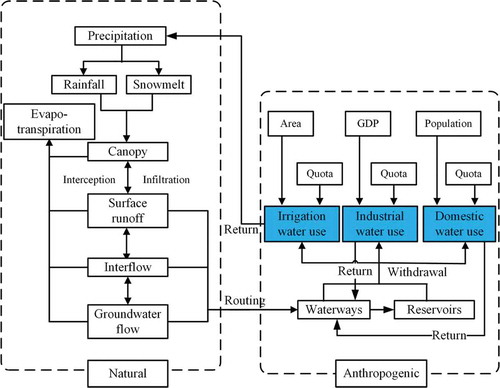
The DTVGM model adopted herein is a distributed hydrological model combining natural runoff and anthropogenic effects, as shown in (Xia et al. 2005). The anthropogenic effects mainly represent the exploitation and utilization of water resources, which greatly changes the natural hydrological cycle. It has been well tested and successfully applied to many basins (Li et al. Citation2010, Cai et al. Citation2014, Ma et al. Citation2014, Xia et al. Citation2014). The DTVGM divides a watershed into a set of sub-basins and calculates the hydrological processes (evapotranspiration, infiltration, runoff generation, and runoff routing) for each sub-basin. A daily time step is used for hydrological simulation. The water balance of DTVGM is described using the following equation:
Figure 2. DTVGM structure. DTVGM model is a distributed hydrological model combining natural runoff and anthropogenic effects.
where P is precipitation (mm); AW is soil moisture (mm); AWu is the soil moisture of the upper layer (mm); AWg is the soil moisture of the lower layer (mm); WMu is the saturated soil moisture of the upper layer; g1 and g2 are time variant factors (0 < g1 < 1, g2 > 1); C is the land cover parameter; Kr is the sub-surface runoff coefficient (0 < Kr < 1); Kg is the groundwater runoff coefficient (0 < Kg < 1); Epi is potential evapotranspiration; i is the time period; and j is the sub-basin number. The expression g1(AWui/WMuCj)g2Pi is used to estimate surface runoff, AWuiKr is used to estimate sub-surface runoff, and AWgiKg is used to estimate groundwater runoff. After runoff generation, the DTVGM applies the kinematic water routing scheme to obtain channel routing. Here, two key modules of the DTVGM, a reservoir module and a water-use module, are introduced.
2.1.1 Reservoir module
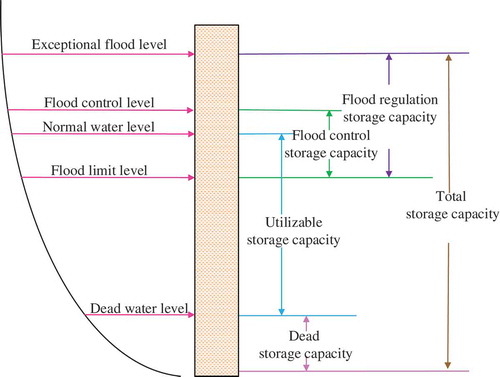
Reservoirs play a significant role in hydrological models. The existence of a large number of reservoirs not only changes the natural hydrological cycle tremendously but also provides people with water-use sources. According to the first national census of water resources, China has constructed approximately 0.1 million reservoirs, which introduces many difficulties in simulations of the actual water cycle (Sun et al. Citation2013). Reservoirs feature two types of characteristics, water level and storage capacity, and the relationship between them is shown in . Previous studies ignored their effect in the process of hydrological simulation, but this may lead to great uncertainty. This paper provides information for estimating the effect of reservoirs, referring to the adaptation of temporal water supply to time-dependent demand, and to support dimensioning of planned reservoirs aiming at satisfying the water demand.
Figure 3. Characteristics of a reservoir: relationship between water level and storage capacity. Reservoir operation begins after the calculation of the sub-basin routing and provides water use resources.
Reservoirs are distributed unevenly in a watershed; for example, certain sub-basins may have more than one reservoir, whereas others may have none. Considering simplicity and applicability, this paper employs a reliable method to construct reservoirs in a sub-basin by defining a threshold of accumulation area. Because there are more than 0.1 million ponds and reservoirs that were built to irrigate in China, the threshold of accumulation area is defined as 100 km2. If the accumulation area is larger than the threshold, a reservoir will be built in the basin, and its various storage capacity values will be defined by multiplying the threshold by a coefficient. Reservoir operation may begin after the calculation of the sub-basin routing and will provide water-use resources.
The reservoir operation rule in the DTVGM is as follows ():
Table 1. The reservoir operation rule in DTVGM. H: reservoir water level, Hd: dead water level, Hf: flood control water level, Hn: normal water level, Hc: check flood level, Qo: outflow of reservoir, Qi: inflow of reservoir, Qs: maximum outflow to save town, Qg: flow of full generating electricity, Qe: minimum flow for ecological needs.
Flood season (generally April–October):
If reservoir water level is greater than dead water level and less than flood control water level, outflow is equal to flow of full generating electricity. If inflow is less than outflow, reservoir water level will decrease to dead water level; if inflow is greater than outflow, reservoir water level will increase to flood control water level.
If reservoir water level is greater than flood control water level and the inflow is less than maximum outflow to safe town, outflow is equal to inflow. If the inflow is greater than maximum outflow to safe town, outflow is equal to maximum outflow to safe town.
If reservoir water level is less than dead water level, and if inflow is greater than flow of full generating electricity, outflow is equal to flow of full generating electricity; if inflow is less than flow of full generating electricity, outflow is equal to inflow.
Non-flood season (other months):
If reservoir water level is greater than dead water level and less than normal water level, outflow is greater than minimum flow for ecological needs and less than flow of full generating electricity, more water will be kept in the reservoir or less water will be supplied by the reservoir.
If reservoir water level is greater than normal water level, outflow is equal to inflow and greater than minimum flow for ecological needs.
If reservoir water level is less than dead water level, and if inflow is less than minimum flow for ecological needs, outflow is equal to inflow; if inflow is greater than minimum flow for ecological needs, outflow is equal to minimum flow for ecological needs.
2.1.2 Water-use module
The process of water use is to calculate the balance between water supply and water needs. The DTVGM mainly considers three types of water use: irrigation water, industrial water and domestic water. Ecological water use is also included in reservoir needs. The model then analyses the supply and demand balance. With this model, the water-use pattern of each type in 2000 for China is obtained. The detailed process is shown in .
Figure 4. Flowchart of water use calculation.
The irrigation water-use calculation uses two parameters, agricultural area and irrigation quota. The agricultural area can be obtained from land-use data. The irrigation quota is defined by varying monthly allocation value, and is calculated as follows:
where Irn is the gross irrigation water requirement (mm); αj is the monthly allocation value (j = 1, 2, …, 12), which is determined by irrigation schedule; β is the annual water use per unit area (mm), which is defined by crop type and irrigation method; and S1 is the irrigation area. The parameters are adapted to consider eventual changes in irrigation strategies and methods. This improves the quality of the model output and raises reliability of conclusions towards water management derived from the model output.
In actual drought sub-basins, the evapotranspiration will be regarded as the required maximum irrigation water use. When a drought sub-basin receives water from precipitation, the required irrigation water use decreases. Thus, the amount of net irrigation demand may be calculated as the difference between evapotranspiration and precipitation in theory. In China, the irrigation manner can be described as an extensive form of management. Farmers often employ flood irrigation systems, so the government has formulated an irrigation norm to save water. Thus, the actual irrigation water use can be calculated by:
where Ir is the actual irrigation water use (mm) and P is the precipitation (mm). High irrigation efficiency will decrease the actual irrigation water use.
The actual industrial water use of a basin is really hard to obtain, but the data of industrial GDP (gross domestic product) and water use per unit GDP are recorded. Generally, industrial water use is highly correlated with industrial GDP. Therefore, we calculated industrial water using the industrial GDP, as follows:
where Inn is the industrial water requirement, GDP is industrial gross domestic product, GDPN is industrial water-use quota (i.e. the water use per unit GDP and per unit time), and Δt is calculation time.
Domestic water use results from the water demands of people’s daily lives. A greater number of people results in more water use. Therefore, we calculated domestic water use in a sub-basin, based on population distribution, as:
where Lin is the domestic water-use requirement, Po is the number of population, and PN is domestic water-use quota, i.e. water use per person.
When using the DTVGM, especially when the supplied water cannot satisfy all of the water-use demands, a water intake and water-use order should be defined. Usually, the water intake order is first from waterways, then reservoirs, and finally underground water, and the water-use order should first satisfy domestic water, then industrial water, and finally irrigation water.
2.2 Input data and model set-up
China is divided into nine major river basins based on their boundaries, i.e. Songliao River basin, Hai River basin, Yellow River basin, Huai River basin, Yangtze River basin, Pearl River basin, Southwest River basin, Southeast River basin and Inland River basin. The data used in this study can be categorized into four types: basin attribute data, river network data, observed meteorological data and observed hydrological data. Basin attribute data consist of topographic information, land use, soil attributes, population, GDP, water-use quota, return water coefficient (the proportion of water returning to the river in relation to water withdrawals), reservoir and waterway information and so on. The detailed sources of certain important attribute data are as follows.
2.2.1 Basin attribute data
The topographic information is based on a digital elevation model (DEM) of Shuttle Radar Topography Mission (SRTM) datasets with a resolution of 90 m × 90 m (http://srtm.csi.cgiar.org/), as shown in . The land-use data are obtained from the Data Centre of Resources and Environment of the Chinese Academy of Sciences (CAS) and extracted from Landsat Thematic Mapping (TM) images obtained in 2000 (Liu Citation1996, Liu et al. Citation2003, Liu and Buhe Citation2000, Tian et al. Citation2005). The soil attribute data are derived from a soil database of China constructed by Shangguan et al. (2013), with a resolution of 30 arc-s. The dataset includes physical and chemical soil attributes.
Figure 5. Input data for the DTVGM: (a) the SRTM DEM datasets (90 m × 90 m); (b) China population data at 1 km resolution; (c) China GDP at 1 km resolution; (d) the extracted China river network; (e) interpolated China precipitation data; and (f) the calculated China potential evapotranspiration.
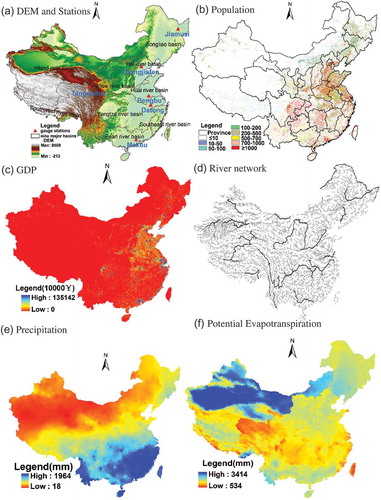
The population dataset is from previous work, which combines remote sensing data and observed residence polygon data to simulate the population distribution of China in 2000 (Mao et al. Citation2012). The simulated result at 1 km resolution is of high accuracy and could be used in this research, as shown in .
The GDP data are also from the Data Centre of Resources and Environment of the CAS and are based on a quantitative model (Liu et al. Citation2005). These data have a resolution of 1 km in . The quality of this product is reliable and could be used in this research.
For the water-use quota and return water coefficient, we adopted statistical data from the China Water Resources Bulletin. The mean return water coefficients of industrial, domestic and irrigation water use are 0.76, 0.45 and 0.36, respectively. The mean domestic water-use quota is 0.14 m3 per person per day. The mean industrial water-use quota is 300 m3 per 10 000 yuan GDP. The mean annual irrigation water use per unit area is 652 mm. The water-use quota and return water coefficient are different in different basins and years. We obtained these data from the basins’ Water Resources Bulletin.
2.2.2 River routing network data
Accurate river routing network data are a prerequisite to simulate the water cycle correctly. They are a critical input for runoff routing in hydrological models because they provide the basic morphological characteristics and outlines of the basins. Based on the latest HydroSHEDS river network product (Lehner et al. Citation2008), we adopted the widely-used ArcInfo ArcHydro Tools of Geographic Information System (GIS) software to extract the river network. The extracted network is shown in .
2.2.3 Observed meteorological data
The observed meteorological data used in this study are from the China Meteorological Data Sharing Service System and include daily values of precipitation, evapotranspiration, average temperature, maximum temperature, minimum temperature, astronomical radiation, and other information collected by 739 stations during the period 1956–2009. To use these data in the adopted hydrological model, the scattered meteorological data should be interpolated into a spatial pattern. For the interpolation method, we chose a stable and accurate method known as the Inverse Distance Weighting (IDW) method, and the interpolated precipitation result for 2000 is shown in .
With the observed daily data of evapotranspiration, solar radiation, average, maximum and minimum temperature, considering the observation data and the method reliability, the Hargreaves and Samani equation (Raziei and Pereira Citation2013) was employed to calculate the potential evapotranspiration of each sub-basin. The observed daily data of evapotranspiration were used to determine the equation parameters by regression analysis. The equation is as follows:
where a and b represent parameters with ranges of 0.0023–0.0032 and 0.5–0.6, respectively, that are finally determined when the simulated potential evapotranspiration approaches the observed values very closely. The parameter Q0 is solar radiation (mm day-1), and T, Tmax and Tmin are the daily average, maximum and minimum temperatures (°C), respectively. The obtained potential evapotranspiration is shown in .
2.2.4 Observed hydrological data
The observed hydrological data were obtained from the Bureau of Hydrology, Ministry of Water Resources of the People’s Republic of China. Here, the daily discharge data of six hydrological stations were used. Attributes of the six stations are listed in , and their spatial distribution is shown in .
Table 2. Station attributes of the China river basins used in this study.
2.3 Model calibration and validation
Before the DTVGM is adopted to simulate the water-use distribution in China, its validity and feasibility should be validated. Model calibration and validation are the processes to realize this goal. Model calibration is the initial testing of the model and tuning it to reflect a set of observed data by determining the most suitable parameters (Boscarello et al. Citation2013, Willems Citation2014). Based on calibration results, model validation could be implemented by using the new set of observed data and the optimal parameters. According to Refsgaard and Storm (Citation1996), a model is said to be validated if its accuracy and predictive capacity in the validation period have been proven to lie within acceptable limits.
We conducted calibration and validation at the basin scale, i.e. model calibration and validation was performed for each basin individually, and the most suitable parameters were selected for each basin. For the three basins without selected gauge stations – Southwest, Southeast and Inland – parameters were derived from the nearest stations, because these often have the most similar basin characteristics. The parameters of Southwest and Southeast river basins were obtained from Datong station, and those of Inland River basin were taken from Tangnaihai station. To ensure that the model has a proper initial state, a warm-up period is used – in this study, it is defined as one year. Based on the current observed hydrological data of six basins, the warm-up, calibration and validation periods are defined, as shown in .
For the model calibration and validation processes, two widely-used model evaluation indices, the correlation coefficient (R) and the Nash-Sutcliffe efficiency (NSE) coefficient (Nash and Sutcliffe Citation1970), were adopted to evaluate model efficiency. The correlation coefficient R is used to test whether the change trends between the simulated values and the observed values are in accordance (see equation (7)), and its value has a range of 0–1. Usually, a value of 0.6 is used as the threshold of reliability; when R > 0.6, the simulated results can be treated as reliable (Moriasi et al. Citation2007):
where Qo is the observed flow, Qc is the simulated flow, is the average simulated flow, and
is the average observed flow.
The NSE is an indicator to assess the prediction abilities of the hydrological model, and its value ranges from – ∞ to 1:
where Qo is the observed flow, and Qc is the simulated flow.
3 Results and discussion
3.1 DTVGM calibration and validation
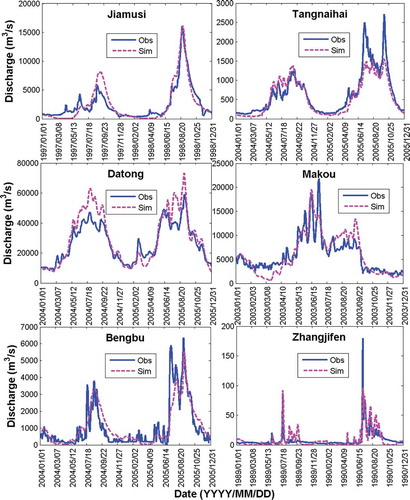
The simulated and observed discharge curves at six stations for the calibration and validation periods are shown in and , respectively, and the values of the two model performance indices are shown in .
Table 3. Model performance indices for the calibration and validation periods.
Figure 6. Discharge curves of six stations for the calibration period. Obs: observed discharge, Sim: simulated discharge.
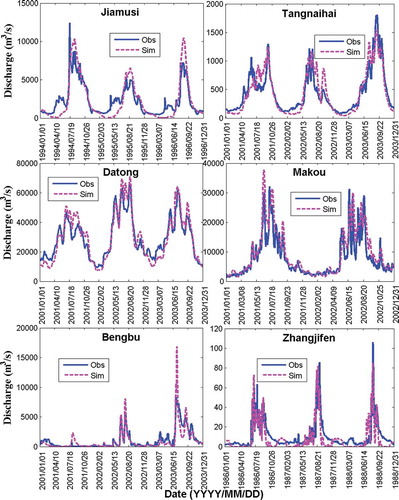
Figure 7. Discharge curves of six stations for the validation period. Obs: observed discharge, Sim: simulated discharge.
For the calibration period, shows that the simulated discharge curves of the six stations fit well with observed discharge as a whole. The simulated discharge during the high-flow period captured the observed discharge with higher accuracy than during the low-flow period, and all peak flows are captured with high accuracy, except for the peak at Bengbu station, where the simulated peak was much higher than the observed value. The deviation of peak discharge at Bengbu station may be caused by the limited accuracy of input data in the DTVGM hydrological model. From , it can be seen that R is in the range 0.68–0.96 and NSE has a range of 0.60–0.84. The two indices have high values and meet the demands of model applicability.
shows that, for the validation period, the simulated discharge curves of the six stations could fit with the observed discharge; R has a range of 0.67–0.96 and NSE is in the range 0.51–0.84 (). Compared with the calibration period, the validation period showed relatively weaker correlations between simulated and observed data, but the indices still meet the demands of model feasibility.
The calibrated and verified model can be used to simulate the three main types of water use in China (irrigation, industrial and domestic) using the year 2000 as an example. With the most suitable parameters for each basin, simulated water use at the basin scale could be obtained.
To evaluate water-use results, the total amount of simulated water was compared with the observed water use at the basin scale, obtained from the water resources bulletins of the nine basins in China. Here, an accuracy criterion known as relative error (RE) is adopted to assess the suitability of the DTVGM for water-use simulation (Equation (9)). The RE can have a range of 0 to 1; if RE is close to 0, it means that the simulated result is similar to the observed water use.
where Wo is the observed water-use amount, and Ws is the simulated water-use amount.
shows the irrigation and industrial water-use amounts and REs in nine Chinese basins, and shows domestic and total water-use amounts and REs. It can be seen that almost all obtained RE values are less than 5%, except for the industrial water-use RE of 7.5% in the Southwest River basin. These generally small RE values indicate that simulated water-use results are sufficiently accurate.
Table 4. Relative errors (RE, %) of irrigation and industrial water use (IRWU and INWU, respectively; O: observed; S: simulated) of nine Chinese basins in 2000.
Table 5. Relative errors (RE, %) of domestic and total water use (DOWU and TWU, respectively; O: observed; S: simulated) of nine Chinese basins in 2000.
3.2 Spatial pattern of water use in year 2000
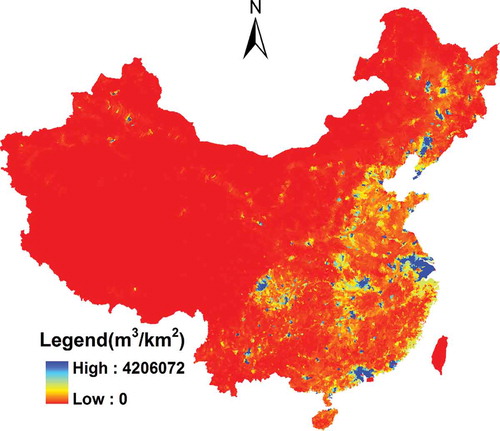
From , it can be seen that the irrigation water-use distribution shows several characteristics. First, water use differs between geographical locations. The area north of the Yangtze River features more water use than the area south of the Yangtze River. East China features more water use, whereas West China uses less water. This distribution pattern is the combined result of population density and the natural environment. Second, water use varies in different basins: it is concentrated in the Hai, Huai, Yellow, Yangtze and Pearl river basins.
Figure 8. Irrigation water-use distribution of China in 2000.
On the whole, the irrigation water-use distribution is closely related to water-use demands, availability of water supply, climate conditions, crop types, irrigation methods, and other factors. In order to face the challenge of a large amount of irrigation water use, irrigation efficiency should be considered. Three typical irrigation methods, i.e. flood irrigation, sprinkler irrigation and trickle irrigation, have different impacts on water use. Trickle irrigation is the most efficient method and will save more water, while flood irrigation, which has been widely used across the whole of China, is the least efficient. Employing the trickle irrigation method to raise efficiency will provide a way to lower gross irrigation demand in order to adapt to limited water supply in future.
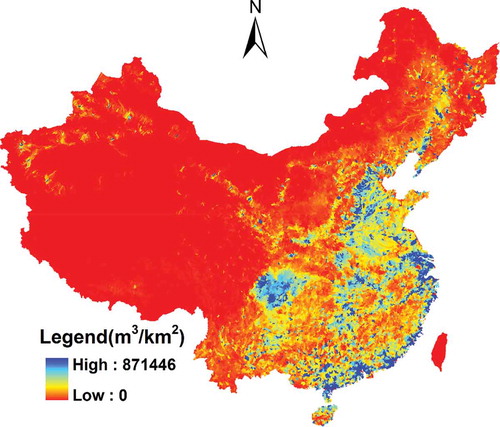
The industrial water-use distribution is shown in ; it can be seen that the industrial water-use distribution pattern approximates the actual distribution of industry. In other words, water use is mainly concentrated in four industrial bases in China: the “central-southern Liaoning” region, the “Beijing-Tianjin-Tangshan” region, the “Shanghai-Nanjing-Hangzhou” region and the “Pearl River Delta” region. The industrial water use increases with economic development and burgeoning industries. To compensate for the large withdrawals due to huge irrigation water demand, the water use in industry will face the challenge to become more effective in terms of water use.
Figure 9. Industrial water-use distribution of China in 2000.
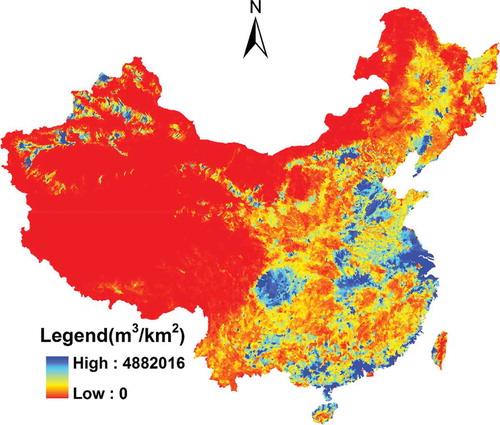
The domestic water-use distribution, as shown in , has a very uneven distribution pattern. For East China, which contains highly developed areas and has a larger population, the water use is greater. However, in West China it is the opposite situation.
Figure 10. Domestic water use distribution of China.
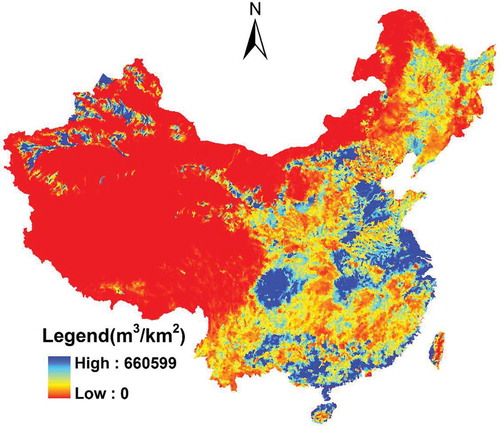
Based on the three types of water uses, shows the total water-use distribution. This figure represents water-use distribution comprehensively and includes all water-use distribution features. This specific and explicit spatial information can be used to provide better guidance for water resource management and sustainable water development for governors in China and will play an important role in easing China’s water scarcity problem.
Figure 11. Total water use distribution of China in 2000.
3.3 Discharge changes before and after water use
To determine the effect of water use on river discharge, we compared the discharge before and after water use at six stations. The discharge before water use refers to the natural river flow derived from rainfall–runoff processes, and discharge after water use refers to the anthropogenic effects on the natural river flow, such as water withdrawn for irrigation. If a hydrological station is located in a region that has a high demand for water resources, more water will be withdrawn from the river channel; thus its corresponding discharge will be significantly lower. Otherwise, the discharge will not have changed much and will retain natural river flow characteristics. Therefore, the discharge change with and without water use could be used to evaluate simulated water-use results. Here, two stations with different anthropogenic effects are taken as examples, as shown in .
Figure 12. Discharge changes before and after water use in 2000: (a) Zhangjiafen station, and (b) Makou station.
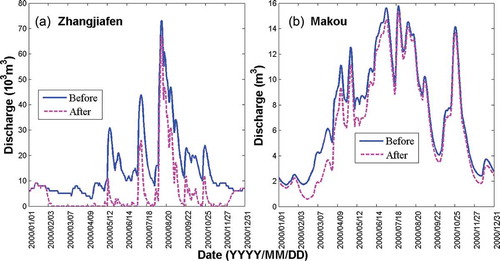
An example of dramatic discharge change before and after water use in 2000, at Zhangjiafen station in the Hai River basin, is presented in , which shows that discharge decreased significantly after water use, especially in certain water shortage months, such as February and March. This phenomenon is the result of scant precipitation and high water demands. Zhangjiafen station is located on the Miyun Reservoir, which provides water for the city of Beijing, the political, economic and cultural centre of China. Beijing has a population of more than 20 million and a high demand for water resources (Li et al. Citation2012). Its main water source and regular water supply are guaranteed by the Miyun Reservoir. This situation leads to a remarkable decrease in the river flow at Zhangjiakou station. This dramatic change reflects the huge anthropogenic effect on the local discharge by pumping water resources for human water use.
An example of insignificant discharge change before and after water use, Makou station, is presented in , which shows no distinct change in discharge before and after water use. Makou station experiences a tropical monsoon climate and has abundant rainfall throughout the year. Therefore, human water use for irrigation, industry, and domestic purposes can be satisfied by natural rainfall and the overall water use has little effect on the river flow of Makou station.
4 Conclusions
Based on the well-validated DTVGM hydrological model, this study obtained reliable high-resolution spatial patterns for three types of water use in continental China: irrigation, industrial and domestic water use. The reasonableness and considerable accuracy of these patterns was also demonstrated. The spatial patterns display information on high-resolution water-use distribution. Compared with the previous water-use estimations, this study not only adopted a distributed hydrological model, which can reflect the physical processes of water use, but also improved simulation resolution.
Proper estimations of the spatial distribution of human water use could help cope with water shortage problems and could guide efficient water management. The simulated water-use distribution results will play a significant role in allocation, regulation, and planning of water resources in China. Furthermore, with the water resource shortage problem becoming increasingly challenging, this modelling can provide a tool for policy analysis in water resources development and management, because the spatial distribution of the water use, considered as an important component of the terrestrial hydrological cycle, will be helpful for studying regional water balance. Only with sufficient knowledge of these components can effective decisions on water management be taken on how, where and when to use and not to use freshwater resources. In order to coordinate water uses, spatially explicit information is needed to perform appropriately the coordination function in water management.
During the modelling process, due to the absence of certain useful information, this paper simplified certain assumptions in the simulation process, such as the reservoir construction method, in which reservoirs are constructed in sub-basins by defining a threshold of accumulation area and the water-use calculation equation, which may have large influence on the simulation results. Future work will focus on the following four aspects. First, applicable measures should be taken to construct reliable reservoirs. Second, more water-use impact factors should be considered. Third, model uncertainty analysis should be done. Fourth, the question of water quality should be explored based on the estimated water quantity, which will be helpful for working out options to eventual disadvantageous impacts of water use in future water management concepts. Thus, more accurate spatial water-use patterns will be obtained in the near future.
Disclosure statement
No potential conflict of interest was reported by the authors.
Additional information
Funding
Related Research Data
References
- Alcamo, J., et al., 1997. Global change and global scenarios of water use and availability: an application of WaterGAP 1.0. Report A9701, Centre for Environmental Systems Research, University of Kassel, Germany.
- Alcamo, J., et al., 2003. Development and testing of the WaterGAP 2 global model of water use and availability. Hydrological Sciences Journal, 48 (3), 317–337. doi:10.1623/hysj.48.3.317.45290
- Boscarello, L., Ravazzani, G., and Mancini, M., 2013. Catchment multisite discharge measurements for hydrological model calibration. Procedia Environmental Sciences, 19, 158–167. doi:10.1016/j.proenv.2013.06.018
- Cai, M., et al., 2014. A distributed hydrological model driven by multi-source spatial data and its application in the Ili River Basin of Central Asia. Water Resources Management, 28 (10), 2851–2866. doi:10.1007/s11269-014-0641-z
- Chang, J., et al., 2014. Impact of climate change and human activities on runoff in the Weihe River Basin, China. Quaternary International. doi:10.1016/j.quaint.2014.03.048
- Coe, M.T. and Foley, J.A., 2001. Human and natural impacts on the water resources of the Lake Chad basin. Journal of Geophysical Research: Atmospheres, 106, 3349–3356. doi:10.1029/2000JD900587
- Condon, L.E. and Maxwell, R.M., 2014. Feedbacks between managed irrigation and water availability: diagnosing temporal and spatial patterns using an integrated hydrologic model. Water Resources Research, 50 (3), 2600–2616. doi:10.1002/2013WR014868
- De Nys, E., et al., 2008. WaDI (water delivery for irrigation): a simulation tool to address strategic interaction of water demand and supply in irrigation schemes. Agricultural Water Management, 95 (3), 224–232. doi:10.1016/j.agwat.2007.10.005
- Döll, P., Kaspar, F., and Alcamo, J., 1999. Computation of global water availability and water use at the scale of large drainage basins. Mathematical Geosciences, 4, 115–122.
- Döll, P. and Siebert, S., 2002. Global modeling of irrigation water requirements. Water Resources Research, 38 (4), 8–1. doi:10.1029/2001WR000355
- Dong, L.Q., Zhang, G.X., and Xu, Y.J., 2012. Effects of climate change and human activities on runoff in the Nenjiang River Basin, Northeast China. Hydrology and Earth System Sciences Discussions, 9 (10), 11521–11549. doi:10.5194/hessd-9-11521-2012
- Flörke, M., et al., 2013. Domestic and industrial water uses of the past 60 years as a mirror of socio-economic development: a global simulation study. Global Environmental Change, 23 (1), 144–156. doi:10.1016/j.gloenvcha.2012.10.018
- Folhes, M.T., Rennó, C.D., and Soares, J.V., 2009. Remote sensing for irrigation water management in the semi-arid Northeast of Brazil. Agricultural Water Management, 96 (10), 1398–1408. doi:10.1016/j.agwat.2009.04.021
- Haddeland, I., et al., 2014. Global water resources affected by human interventions and climate change. Proceedings of the National Academy of Sciences, 111 (9), 3251–3256. doi:10.1073/pnas.1222475110
- Lehner, B., Verdin, K., and Jarvis, A., 2008. New global hydrography derived from spaceborne elevation data. Eos, Transactions American Geophysical Union, 89 (10), 93–94. doi:10.1029/2008EO100001
- Li, L., et al., 2010. Evaluation of the subjective factors of the GLUE method and comparison with the formal Bayesian method in uncertainty assessment of hydrological models. Journal of Hydrology, 390 (3–4), 210–221. doi:10.1016/j.jhydrol.2010.06.044
- Li, M., Xia, J., and Meng, D., 2012. Long-term trend analysis of seasonal precipitation for Beijing, China. Journal of Resources and Ecology, 3 (1), 64–72. doi:10.5814/j.issn.1674-764x.2012.01.010
- Liu, H., et al., 2005. Spatialization approach to l km Grid GDP supported by remote sensing. Geo-Information Science, 7 (2), 120–123.
- Liu, J., 1996. Study on the micro survey of Chinese resources and environment by remote sensing and its dynamic. Beijing: Weather Press.
- Liu, J., et al., 2003. Study on spatial pattern of land-use change in China during 1995–2000. Science in China Series D: Earth Sciences, 46 (4), 373–384. doi:10.1360/03yd9033
- Liu, J. and Buhe, A.S., 2000. Study on spatial-temporal feature of modern land-use change in China: using remote sensing technique. Quaternary Sciences, 3, 229–239. (in Chinese)
- Ma, F., et al., 2014. An estimate of human and natural contributions to flood changes of the Huai River. Global and Planetary Change, 119, 39–50. doi:10.1016/j.gloplacha.2014.05.003
- Mao, Y., Ye, A., and Xu, J., 2012. Using land use data to estimate the population distribution of China in 2000. GIScience & Remote Sensing, 49 (6), 822–853. doi:10.2747/1548-1603.49.6.822
- Moriasi, D.N., et al., 2007. Model evaluation guidelines for systematic quantification of accuracy in watershed simulations. Transactions of the ASABE, 50 (3), 885–900. doi:10.13031/2013.23153
- Nash, J.E. and Sutcliffe, J.V., 1970. River flow forecasting through conceptual models, Part I—a discussion of principles. Journal of Hydrology, 10, 282–290. doi:10.1016/0022-1694(70)90255-6
- Nnaji, C.C., Eluwa, C., and Nwoji, C., 2013. Dynamics of domestic water supply and consumption in a semi-urban Nigerian city. Habitat International, 40, 127–135. doi:10.1016/j.habitatint.2013.03.007
- Oki, T. and Kanae, S., 2006. Global hydrological cycles and world water resources. Science, 1068–1072. doi:10.1126/science.1128845
- Raskin, P., et al., 1997. Water futures: assessment of long-range patterns and problems. Comprehensive assessment of the freshwater resources of the world. Sweden: Stockholm Environment Institute Stockholm.
- Raziei, T. and Pereira, L.S., 2013. Estimation of ETo with Hargreaves–Samani and FAO-PM temperature methods for a wide range of climates in Iran. Agricultural Water Management, 121 (0), 1–18. doi:10.1016/j.agwat.2012.12.019
- Refsgaard, J.C. and Storm, B., 1996. Construction, calibration and validation of hydrological models. Distributed Hydrological Modelling. Springer Netherlands, 22, 41–54. doi:10.1007/978-94-009-0257-2_3
- Shangguan, W., et al., 2013. A china dataset of soil properties for land surface modeling. Journal of Advances in Modeling Earth Systems, 5, 212–224. doi:10.1002/jame.20026
- Shao, D.G., Guo, Y.Y., and Shen, P.J., 1998. Research on long- term forecast model of regional irrigation water requirement. Irrigation and Drainage, 17-3, 28–33. (In Chinese)
- Sun, Z.G., Zhang, L., and Duan, Z.D., 2013. Number and locations of reservoirs in China. China Water Resources, 7, 10–11. (In Chinese)
- Tian, Y., et al., 2005. Modeling population density using land cover data. Ecological Modelling, 189 (1–2), 72–88. doi:10.1016/j.ecolmodel.2005.03.012
- Wang, R.L., 2001. A correlation analysis of irrigation water and rainfall in Baoji irrigation district. Technique of Seepage Control, 7 (3), 42–46+48. (In Chinese)
- Willems, P., 2014. Parsimonious rainfall–runoff model construction supported by time series processing and validation of hydrological extremes – part 1: step-wise model-structure identification and calibration approach. Journal of Hydrology, 510, 578–590. doi:10.1016/j.jhydrol.2014.01.017
- Xia, J., et al., 2007. Towards better water security in North China. Water Resources Management, 21 (1), 233–247. doi:10.1007/s11269-006-9051-1
- Xia, J., et al., 2014. Systematic solutions and modeling on eco-water and its allocation applied to urban river restoration: case study in Beijing, China. Ecohydrology & Hydrobiology, 14 (1), 39–54. doi:10.1016/j.ecohyd.2014.02.003
- Xia, J., Ye, A.Z., and Wang, G.S., 2005. A distributed time-variant gain model applied to Yellow River(I): model theories and structures. Engineering Journal of Wuhan University, 38 (6), 10–15. (In Chinese)
- Zhan, C.S., et al., 2014. Quantitative contribution of climate change and human activities to runoff changes in the Wei River basin, China. Hydrology and Earth System Sciences, 18 (8), 3069–3077. doi:10.5194/hess-18-3069-2014
- Zhao, J., Zhao, Y.X., and Huang, Q., 2013. Forecast of water resource demand in Xi’an city using neural network and support vector machine models. Journal of Northwest A & F University (Natural Science Edition), 41 (7), 217–223. (In Chinese)
- Zhu, X.T., 2012. Urban water consumption forecast based on improved particle swarm optimization BP neural network. Computer and Modernization, 8, 21–23+27. (In Chinese)
- Zuo, D., et al., 2014. Identification of streamflow response to climate change and human activities in the Wei River Basin, China. Water Resources Management, 28 (3), 833–851. doi:10.1007/s11269-014-0519-0