
ABSTRACT
The Bio-Ecological Drainage System (BIOECODS) is a sustainable drainage system, which adopts a “control at source” approach for urban storm water management in Malaysia. This study attempts to model a small-scale BIOECODS using InfoWorks SD. New modelling techniques are used to fully integrate the surface and on-line subsurface conveyance system, in which overland flow routing is described by a storm water management model that uses a nonlinear reservoir method and the kinematic wave approximation of the St Venant equation, and subsurface flow is described by the Horton method in conjunction with the Soil Conservation Service (SCS) curve number (CN) method. The observed water levels at primary outlets are compared with those obtained from model simulation. The modelling approach has been proven successful as the hydrographs (predicted and observed) match each other closely, with a mean error in the range of 4.58–7.32%. Results from the model showed that the BIOECODS is able to attenuate peak flow by 60–75%, and increase the lag time by 20 min within an area of <28 300 m2 when compared with a traditional drainage system.
Editor D. Koutsoyiannis; Associate editor G. Di Baldassarre
1 Introduction
Urbanization has been recognized as the major factor responsible for increased peak flow and surface runoff volume as the infiltration capacity in urban areas has decreased compared to pre-developed conditions (Barber et al. Citation2003, Chen and Adams Citation2006, Ouyang et al. Citation2006, Seilheimer et al. Citation2007, Newcomer et al. Citation2014). The negative impact of urbanization in turn leads to problems such as floods (Chow Citation1959, Driscoll et al. Citation1990, Perrin et al. Citation2001, Di Baldassarre et al. Citation2013). Over the period 2006–2009, cities such as Johor, Malaysia, have suffered from the impact of floods, which cost over USD 500 million and claimed 46 lives (Chan Citation2012). As urbanization increases, these problems are expected to become more severe and, hence, viable and cost-effective solutions are urgently sought to reduce the impacts.
The launch of the Urban Stormwater Management Manual for Malaysia (MSMA) emphasized the implementation of best management practices (BMP) and sustainable urban drainage systems (SUDS), e.g. retention ponds, wetlands, grass swales, detention ponds etc. (DID Citation2000, MSMA Citation2012), for new developments in Malaysia to govern storm water in both quantity and quality. It is expected that, through such measures, negative impacts such as flash floods, water scarcity and water pollution can be mitigated. In conjunction with efforts by the Government of Malaysia to promote the “control at source” approach, the Government of Malaysia via Public Work Department Malaysia constructed a small-scale Bio-Ecological Drainage System (BIOECODS) on an area of approximately 28 300 m2 in the Larut Matang district of Perak state in Malaysia in 2005. The BIOECODS project (Zakaria et al. Citation2003; Ab. Ghani et al. Citation2004) has taken a series of procedures to reduce runoff volumes and rates and also pollutant loads in channels by implementing a source control approach for storm water management. This includes a series of components, namely ecological swales with on-line subsurface detentions, and dry detention as part of the BIOECODS that contributes to the treatment of storm water. The design and concept of the BIOECODS drainage system are shown in .
Figure 1. Simple design and concept of BIOECODS system.
One of the main components of the BIOECODS system is the “grass swale” or “ecology ditch”, a modified partial infiltration trench, designed to reduce and attenuate peak discharges by infiltrating a portion of the total runoff and reducing flow velocity. At the same time, the grass swale helps to improve water quality by removing pollutants through the filtering action of the grass (Urbonas and Stahre Citation1993, Lee and Bang Citation2000). Since the completion of the BIOECODS project, a number of studies (Lai and Mah Citation2012) have been carried out to evaluate the effectiveness and performance of BIOECODS components for urban storm water management. However, it has been found that almost all the previous modelling efforts were not very successful due to difficulty in integrating the ecological swale and the on-line subsurface detention system (Abdullah et al. Citation2004).
In view of the potential of BIOECODS or other similar projects for future implementation to overcome long-term surface runoff problems as urbanization increases, it is important to have a model that is capable of simulating the rainfall–runoff interaction effectively. Such a model would be very useful for further analysis, assessment and design of similar projects where both surface and subsurface drainage systems have very close interaction with each other.
2 Method and materials
2.1 Description of the study area
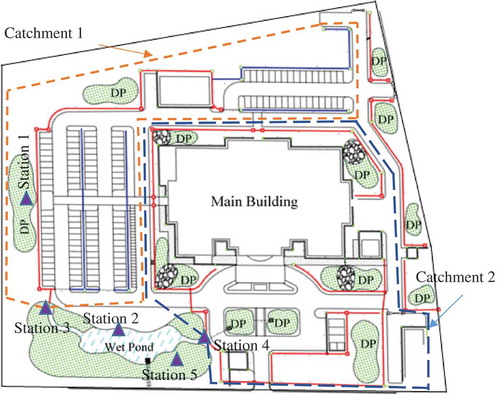
The study area () consists of a public health clinic and one state-of-the-art environmentally friendly drainage system designed to fully comply with the Stormwater Management Manual (SWMM) of Malaysia. (Lai and Mah Citation2012). The 28 300 m2 study area consists of a SUDS, namely a wet pond with maximum surface area of 500 m2, and a total of 13 dry detention ponds: nine without underground detention storage, with surface areas in the range of 62–351 m2, and four with underground detention storage, which are located around the main building, with surface areas in the range of 80–198 m2. The study area plan is shown in .
Figure 2. Study area plan showing the different types of grass swale (GS) that are applied in the BIOECODS drainage system in the study area. Source: JKR (Citation2005).
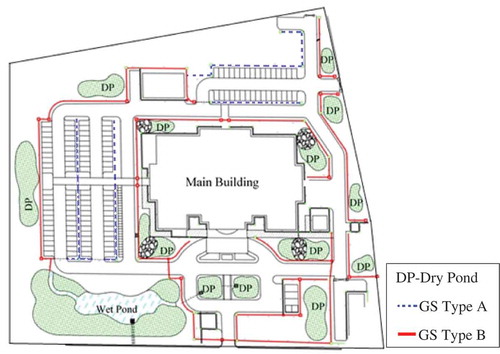
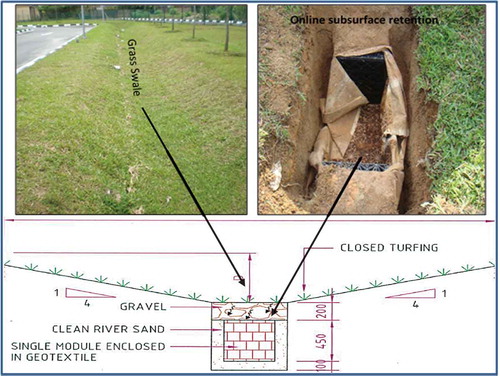
The study area contains of two kinds of grass swale: Type A that covers the catchment of the car park and paved area, with a subsurface detention module, and Type B main grass swale that covers the area surrounding the buildings ( and ). The grass swale cross-section and design criteria presented in and , respectively.
Table 1. Design parameters for grass swales Type A and Type B (JKR Citation2005).
Figure 3. Cross-sectional profile of ecological ditch/swale. Source: REDAC (Citation2005).
2.2 Data collection
A field survey is essential to digitize and identify the levelling of each point in the area under investigation. The field survey was done using a Horizon total station. The field survey data were imported to create a digitized map to be used in AutoCAD and ArcGIS software. Survey data are essential for determining cross-sections of channels, to obtain invert levels for upstream and downstream to compute slopes.
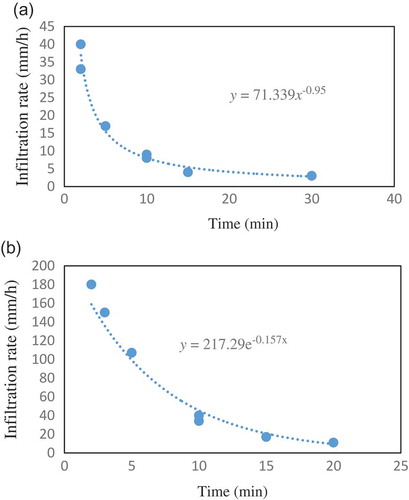
The engineering design of the grass swale concentrates on its infiltration capacity in order to be able to cope fully with smaller rainfall events. Therefore, several infiltration tests were carried out to study the infiltration rate over the whole study area. Overall, 10 datasets for infiltration testing were collected in the study area. An example of infiltration test results is shown in .
Figure 4. Sample of results from infiltration tests: (a) initial infiltration rate for dry pond without subsurface detention storage, and (b) grass swale with subsurface detention.
Field investigations were carried out by installing five gauging stations in the study area (shown in ). Two stations were installed in wet and dry detention ponds to measure the water level, two were installed in the primary outlets (Stations 3 and 4) to measure water level and velocity before storm water enters the retention pond, and one raingauge (Station 5) collected precipitation data.
Figure 5. Gauging stations installed in the study area.
The rainfall and water level data were collected for a period of 5 months (October 2013–March 2014), which included the monsoon season with frequent and heavy rainfall from November to January. Altogether, 10 complete datasets including water level, precipitation and velocity data were collected for the analysis. From these, five datasets, differing in intensity (mm/h) and duration, were selected for modelling purposes. Two events were selected for calibration and three for validation.
2.3 Analysis tools
To select an appropriate analysis tool for this case study, consideration was given to models that have the capability of simulating storm water runoff and also various BMP. According to previous studies (Nix Citation1991, Smith Citation2006), such a comprehensive model is needed for designing storm water structures, green-field infiltration and inflow, BMP structures and maintenance practices. After consideration of a range of widely used urban storm water software in terms of benchmark speed, integration of hydraulic and hydrological simulation, control of the simulation progress and stability of the calculation, InfoWorks SD was selected. The InfoWorks SD has proved itself in thousands of network analysis projects worldwide since its original development and is being continuously improved (InfoWorks SD Citation2014).
InfoWorks SD, an HR Wallingford Software model, was utilized for modelling the Taiping Health Clinic. It is based on a new runoff volume model developed by Wallingford. InfoWorks SD has been used extensively to simulate storm water. It can be used for simulation of the surface/subsurface runoff quantity and quality of single and long-term events of different catchment size in urban/suburban areas. InfoWorks SD is supported with many different sets of hydraulic modelling capabilities used to route runoff and external inflows through a drainage system network of channels, storage or treatment units, diversion structures and pipe networks (InfoWorks SD Citation2014).
In order to overcome the difficulty of integrating both the surface and the on-line subsurface conveyance systems, a new technique was applied to represent both the surface and subsurface components simultaneously with a node. This is to ensure the surface runoff (in the grass swale) can be transferred to the on-line subsurface detention reasonably through the layer of soil placed in between by adopting a suitable infiltration model. The model has three major aspects: surface modelling (overland flow), subsurface modelling and coupling, which are described below.
2.3.1 Surface model (overland flow)
The overland flow model is the SWMM overland flow comprising the nonlinear reservoir and kinematic wave routing, which uses a simplified momentum equation for each conduit. Kinematic wave models are applicable to overland flow where lateral inflow is continuously added and is a large part of the total flow (Miller Citation1983). For unit width of overland flow, the formula can be expressed as:
where q is the unit width of overland flow; x is longitudinal distance along the flow path; y is flow depth; t is time; and i is the rainfall intensity. The terms ∂q/∂x and ∂y/∂t are used to simulate non-uniform and unsteady flow paths, respectively.
According to equation (1), the kinematic wave model is described by uniform flow or the continuity equation below. In uniform flow, the momentum equation can be expressed generally as:
where ak and m are constant and depend on a water depth and discharge. In the SWMM model, the value in the runoff routing module is always Manning’s roughness, whatever runoff rate is selected (Engman Citation1986). Therefore, the maximum runoff volume from the catchment area calculated using Manning’s equation is:
where Km is a constant equal to 1.49 in US units and 1.0 in SI units, n is Manning’s roughness coefficient, A is the effective flow area, R is the hydraulic radius which depends on area and wetted perimeter, and S is the surface slope.
In total, the study area was divided into 80 different sub-catchments. Different land uses were introduced to model runoff contributions from impervious and pervious surface areas. In total five different land uses were introduced into the software; for example, “fair” where the runoff from impervious and pervious surfaces is equal (50% runoff occurs from impervious surfaces and 50% runoff from pervious surfaces). The other four land uses comprised different combinations of runoff from pervious and impervious surfaces.
The study area was covered with 128 nodes and links. The nodes are existing manholes or conjunction points, lateral inflows or cross-sectional changes in grass swales, and 177 different links represent culverts and swales in the entire watershed area.
2.3.2 Subsurface model
The SWMM surface model is associated with different infiltration models such Horton and Green-Ampt. The Horton equation is one of the well-known models in hydrology (Horton Citation1939, Citation1940, Mays Citation2010). This model was selected for this study to represent the subsurface. The Horton equation is an empirical formula derived from infiltrometer data and is suitable for small catchments. The SCS Runoff Curve Number (CN) (NRCS Citation1986) method is described in detail in NEH-4 (SCS Citation1985). The initial maximum abstraction rate (γ) is assumed to be constant in this study, γ = 0.1. Woodward et al. (Citation2003), in analysing several rainfall–runoff events, recommended a value of γ = 0.05. However, other studies suggest values between 0.05 and 0.1 may be more appropriate.
The CN values depend on various parameters, such as land cover, land management conditions and soil types, which can be selected from Technical Release 55 (TR-55) of the Natural Resources Conservation Service (NRCS). However, this technical report is calibrated for US soils, so there are likely to be differences in estimating CN values for different locations, and it is recommended that CN values are estimated using data for a nearby similar watershed. Hence, CN values for the case study have been calibrated.
2.3.3 Coupling method
To integrate surface and subsurface models, InfoWorks SD is able to model two separate subsystems within the InfoWorks network. In general, two systems are provided by InfoWorks SD: Overland and Storm systems. These two systems can be modelled independently or dependently and sub-catchments of the two system can overlap. Due to this capability, the link between two nodes with higher invert level present grass swale with overland system and the link with lower invert level present sub-surface conveyance system with storm system in developed model.
In the method, when rain falls, due to the infiltration capability in the grass swale, rainwater is directed into the soil and then into the subsurface conveyance system till the upper layer of soil reaches its maximum infiltration capability and the soil becomes saturated, then surface flow occurs.
Sensitivity analysis was used to identify the critical parameters for modelling. According to this analysis one of the critical parameters in design and modelling of grass swale is Manning’s roughness, which plays an important role in quality and quantity of storm water runoff. Manning’s roughness for this study is adapted from a previous study (Lai and Mah Citation2012) and has been calibrated according to actual conditions.
Other parameters with high sensitivity for modelling are soil class and porosity, which were calibrated using the model according to the actual situation, and are shown in .
Table 2. Design criteria of an ecological swale (Ab. Ghani et al. Citation2004).
Table 3. Calibrated model parameters.
In order to enhance the capabilities of InfoWorks SD in analysing complex hydraulic conditions in urban drainage networks, necessary data are provided for the model. Field study was carried out to collect the following data:
detailed topographic survey data for the study area especially for BMP factors, such as slope of swale, cross-section of swale, ground and invert levels of ponds and swales;
infiltration data using double-ring tests, to an accuracy of ±0.2 mm;
precipitation data from a data-logging raingauge installed in the study area with resolution of 0.2 mm and continuous time step of 30 s;
water levels in the dry and wet ponds measured by ultrasonic sensor with continuous time step of 1 min;
water levels in two primary outlets measured by ultrasonic sensor with continuous time step of 30 s.
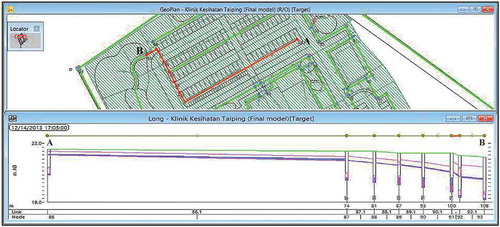
There are two major channels with grass swale, covering the left and right sides of the study area: (a) covering approx. 9843.75 m2 draining to Station 3 (); and (b) right side of wet pond covering approx. 9050 m2 draining to Station 4 (). The results of the model for the entire study area are presented in and .
Figure 6. Final model for entire study area.
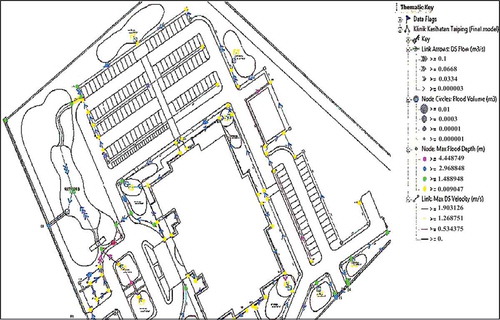
Figure 7. Longitudinal cross-section showing surface and subsurface drainage systems from upstream (A) to downstream (B).
3 Results and discussion
Data collection spanned 5 months from October 2013 to March 2014. For simulation purposes, five datasets were selected. In total, 10 rainfall events (±5–10 year ARI) with different intensities, durations and patterns were selected for the modelling. Simulation was conducted for all 10 events in the study area, but because of similar results, five datasets were selected for presentation in this paper. Water levels in primary outlets (Stations 3 and 4) of the study area presented in .
Table 4. Selected rainfall events for simulation.
The final model for the entire study area is shown in , but the main focus of this paper is on the two primary outlet stations (Stations 3 and 4, ). The results agree with the observed data in most cases in the context of timing and peak depths, with coefficients of determination R2 in the range of 0.94–0.97. It can be seen that the hydrographs match closely, in terms of both timing and maximum water level, with R2 of 0.98. Sample results for two events for the primary outlets are shown in and . Similar results were also obtained for other rainfall events used in this modelling exercise. This further suggests that the new technique used to define both the surface and the on-line subsurface components with one node is able to mimic the actual conditions of BIOECODS. Presenting both surface and on-line subsurface components as a single link with different invert levels and different catchment characterisation shows that this model has the capability to represent an integrated surface and subsurface drainage system, and can be used for further analysis.
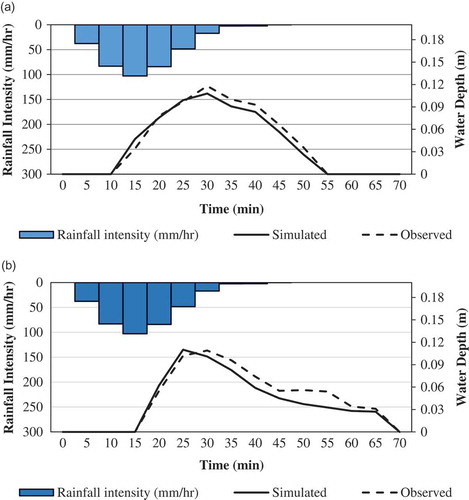
Figure 8. Simulated result for ecological swale for Event 1, observed and simulated water depth (m): (a) Station 3 and (b) Station 4.
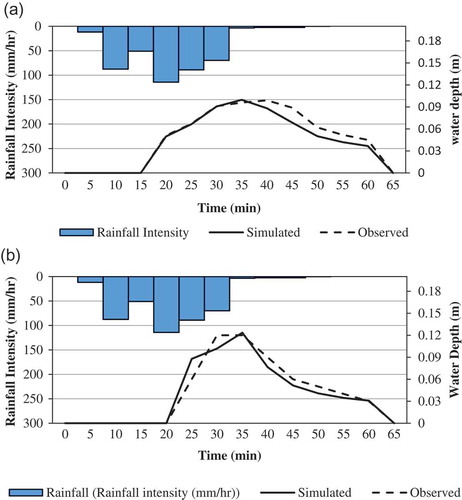
Figure 9. Simulated results for ecological swale for Event 2, observed and simulated water depth (m): (a) Station 3 and (b) Station 4.
For calibration and validation purpose, two events with minimum and maximum rainfall intensities were selected for calibration and three events for validation. Events 1 and 2 were selected for calibration and Events 3, 4 and 5 were selected for validation. Calibration and validation results for the primarily outlets at Stations 3 and 4 are reported in and , respectively.
Table 5. Calibration and validation results for Station 3.
Table 6. Calibration and validation results for Station 4.
The results for calibration and validation for each station show that the current model has a close match to the actual situation, and is able to simulate the case study area with high accuracy and indicate an overall agreement to the real conditions.
3.1 Model assessment
In order to further explore the functionality of BIOECODS in peak flow attenuation, the calibrated model is then used to consider a scenario where the BIOECODS is replaced with a traditional drainage system consisting of concrete drains (without dry detention and on-line subsurface detention, etc.) of the same size and shape as the grass swales.
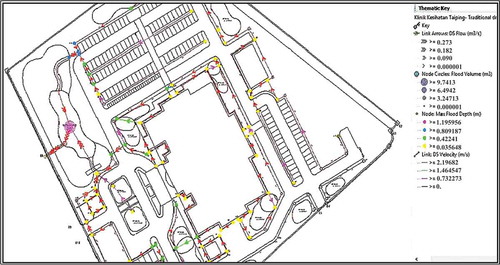
A sample of simulated results for the study area with a traditional drainage system is shown in . It can be seen that flow rate Q and flow velocity v for most of the drains are much higher (v up to 0.8 m/s, Q up to 0.1 m3/s) when compared with for BIOECODS. This means that a much bigger volume of runoff will reach the retention pond downstream. Overflow occurs, as expected, on the floodplain region around the retention pond, with a maximum flood depth of 0.846 m.
Figure 10. Flow simulation (traditional drainage system) for Event 1 using InfoWorks SD.
According to the results shown in , BIOECODS increases the lag time (time to peak in hydrograph), because of the high infiltration rate when rainfall starts. This situation continues until the soil becomes saturated and then rainfall changes to a very gradual flow. When the rain stops, because of the saturated soil profile, the infiltration rate also slows and it takes time to decrease the water level in the swale.
Figure 11. Evaluation of ecological drainage system for Event 1 for (a) Station 3 and (b) Station 4.
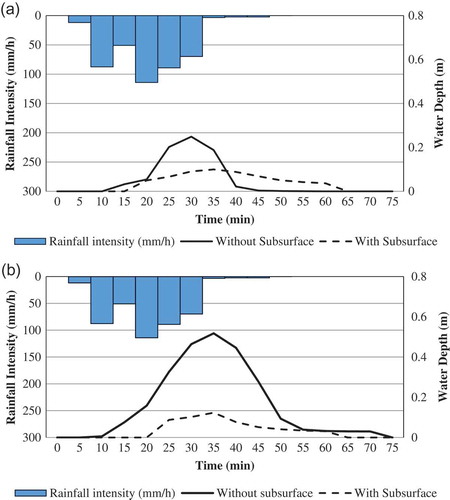
shows that at Station 3 the ecological drainage system with subsurface is able to reduce maximum water level by 60% in 20 min after the start of the rain event and at Station 4 it can reduce maximum water level by 76% in 15 min after the start of the rain event.
Table 7. Comparison of results for two different scenarios with and without ecological drainage.
4 Conclusions
InfoWorks SD was adopted to simulate a case study with an ecological drainage system. The results further strengthen the advantages of grass swales with subsurface conveyance in storm water runoff control. A total of five stations including a rain gauge were installed at the study site to collect data for model calibration and validation. The simulation results agree with the observed data and error and average error obtained from measuring the accuracy of the model indicate overall agreement with real conditions. This study serves as a platform to create two different scenarios to demonstrate the efficiency of the Bio-Ecological Drainage System (BIOECODS) (with on-line subsurface drainage system) compared with a traditional drainage system (without subsurface drainage system). The main focus of this study is determination of the effectiveness of BMP’s facilities in preventing flash floods and runoff management and at the same time providing a model with high accuracy and the capability to model both surface and subsurface drainage systems in a single system (nodes and links). The model shows that the ecological drainage system is very effective in terms of decreasing peak flow and improving the infiltration characteristics of urban land. Also, the subsurface drainage module integrated with swales is able to cater for approximately 60–76% of surface runoff volume for rainfall events.
Acknowledgements
The authors would like to thank the Ministry of Health Malaysia; Cawangan Kerja Kesihatan, Jabatan Kerja Raya (JKR); Taiping Health Clinic, KK2 for their permission to conduct the research work in these premises and for technical assistance. The author would also like to emphasize that all the data used in this research were obtained by the authors through monitoring stations and field measurements.
Disclosure statement
No potential conflict of interest was reported by the authors.
Additional information
Funding
References
- Ab. Ghani, A., et al., 2004. Bio-Ecological Drainage System (BIOECODS): concept, design and construction. In: 6th international conference on hydroscience and engineering (ICHE-2004), Brisbane.
- Abdullah, R., et al., 2004. BIOECODS modelling using SWMM. In: 6th international conference on hydroscience and engineering (ICHE-2004), Brisbane.
- Barber, M.E., et al., 2003. Ecology ditch: a best management practice for storm water runoff mitigation. Journal of Hydrologic Engineering, 8 (3), 111–122. doi:10.1061/(ASCE)1084-0699(2003)8:3(111)
- Chan, N.W., 2012. Impacts of disasters and disasters risk management in Malaysia: the case of floods. Resilience and recovery in Asian disasters. In: Y. Sawada and S. Oum, eds. Economic and Welfare Impacts of Disasters in East Asia and Policy Responses. ERIA Research Project Report 2011-8. Jakarta: ERIA, pp. 503–551.
- Chen, J. and Adams, B.J., 2006. A framework for urban storm water modeling and control analysis with analytical models. Water Resource Research, 42 (6). doi:10.1029/2005WR004540
- Chow, V.T., 1959. Open channel hydraulics. New York: McGraw-Hill Book.
- Di Baldassarre, G., et al., 2013. Socio-hydrology: conceptualising human-flood interactions. Hydrology and Earth System Sciences, 17 (8), 3295–3303. doi:10.5194/hess-17-3295-2013,
- DID, 2000. Urban stormwater management manual for Malaysia (MSMA). Kuala Lumpur: Department of Irrigation and Drainage.
- DID, 2012. Urban stormwater management manual for Malaysia (MSMA). Kuala Lumpur: Department of Irrigation and Drainage.
- Driscoll, E.D., Shelly, P.E., and Strecker, E.W., 1990. Pollutant loadings and impacts from stormwater runoff. U.S. Department of Transportation. McLean, VA: FHWA Research, Development, and Technology, Analytical Investigation and Research Report 3.
- Engman, E.T., 1986. Roughness coefficients for routing surface runoff. Journal of Irrigation and Drainage Engineering, 112 (1), 39–53. doi:10.1061/(ASCE)0733-9437(1986)112:1(39)
- Horton, R.E., 1939. Analysis of runoff-plot experiments with varying infiltration capacity. Transactions-American Geophysical Union, 20, 693–711. doi:10.1029/TR020i004p00693
- Horton, R.E., 1940. An approach toward a physical interpretation of infiltration capacity. Soil Science Society of America Journal, 5, 399–417. doi:10.2136/sssaj1941.036159950005000C0075x
- InfoWorks SD, 2014. Technical review on InfoWorks SD [online]. Available from: http://www.innovyze.com/products/infoworks_sd/InfoWorks_SD_Technical_Review.pdf [ Accessed 6 August 2014].
- JKR (Jabatan Kerja Raya), 2005. Proposed construction of health clinic (Cadangan Membina Klinik Kesihatan Jenis 2). Kuala Lumpur: JKR.
- Lai, S.H. and Mah, D.Y., 2012. Field investigation of a dry detention pond with underground detention storage. Hydrological Sciences Journal, 57 (6), 1249–1255. doi:10.1080/02626667.2012.692016
- Lee, J.H. and Bang, K.W., 2000. Characterization of urban stormwater runoff. Water Research, 34 (6), 1773–1780. doi:10.1016/S0043-1354(99)00325-5
- Mays, L.W., 2010. Water resource engineering. New York: Wiley & Sons.
- Miller, J.E., 1983. Basic concepts of kinetic-wave models. In: (U.S.), G. S., ed. Professional paper. Washington, DC: U.S. Government Printing Office.
- Newcomer, M.E., et al., 2014. Urban recharge beneath low impact development and effects of climate variability and change. Water Resources Research, 50 (2), 1716–1734. doi:10.1002/2013WR014282
- Nix, S.J., 1991. Applying runoff models. Water Environmental Technology, 3, 47–49.
- NRCS (Natural Resources Conservation Service), 1986. Urban hydrology for small watersheds. Washington, DC: USDA, Technical Report Number TR-55.
- Ouyang, T., Zhu, Z., and Kuang, Y., 2006. Assessing impact of urbanization on river water quality in the Pearl River Delta Economic Zone, China. Environmental Monitoring and Assessment, 120 (1–3), 313–325. doi:10.1007/s10661-005-9064-x
- Perrin, J.L., et al., 2001. Rainfall/runoff processes in a small peri-urban catchment in the Andes Mountains. The Rumihurcu Quebrada, Quito (Ecuador). Hydrological Processes, 15 (5), 843–854. doi:10.1002/hyp.190
- REDAC (River Engineering and Urban Drainage Research Centre), 2005. BIOECODS at Taiping, Perak. Penang: River Engineering and Urban Drainage Research Centre.
- SCS (Soil Conservation Service), 1985. National engineering handbook. Section 4, Hydrology. Washington, DC.
- Seilheimer, T.S., et al., 2007. Impact of urbanization on the water quality, fish habitat, and fish community of a Lake Ontario marsh, Frenchman’s Bay. Urban Ecosystems, 10 (3), 299–319. doi:10.1007/s11252-007-0028-5
- Smith, M.B., 2006. Comment on ‘Analysis and modeling of flooding in urban drainage systems’. Journal of Hydrology, 317 (3–4), 355–363. doi:10.1016/j.jhydrol.2005.05.027
- Urbonas, B. and Stahre, P., 1993. Storm water best management practices and detention for water quality, drainage and CSO management. Englewood Cliffs, NJ: Prentice Hall.
- Woodward, D.E., et al., 2003. Runoff curve number method: examination of the initial abstraction ratio. Reston, VA: American Society of Civil Engineers.
- Zakaria, N.A., et al., 2003. Bio-Ecological Drainage System (BIOECODS) for water quantity and quality control. International Journal of River Basin Management, IAHR & INBO, 1 (3), 237–251. doi:10.1080/15715124.2003.9635210