
ABSTRACT
A modelling study was undertaken to quantify effects that the climate likely to prevail in the 2050s might have on water quality in two contrasting UK rivers. In so doing, it pinpointed the extent to which time series of climate model output, for some variables derived following bias correction, are fit for purpose when used as a basis for projecting future water quality. Working at daily time step, the method involved linking regional climate model (HadRM3-PPE) projections, Future Flows Hydrology (rainfall–runoff modelling) and the QUESTOR river network water quality model. In the River Thames, the number of days when temperature, dissolved oxygen, biochemical oxygen demand and phytoplankton exceeded undesirable values (>25°C, <6 mg L−1, >4 mg L−1 and >0.03 mg L−1, respectively) was estimated to increase by 4.1–26.7 days per year. The changes do not reflect impacts of any possible change in land use or land management. In the River Ure, smaller increases in occurrence of undesirable water quality are likely to occur in the future (by 1.0–11.5 days per year) and some scenarios suggested no change. Results from 11 scenarios of the hydroclimatic inputs revealed considerable uncertainty around the levels of change, which prompted analysis of the sensitivity of the QUESTOR model to simulations of current climate and hydrology. Hydrological model errors were deemed of less significance than those associated with the derivation and downscaling of driving climatic variables (rainfall, air temperature and solar radiation). Errors associated with incomplete understanding of river water quality interactions with the aquatic ecosystem were found likely to be more substantial than those associated with hydrology, but less than those related to climate model inputs. These errors are largely a manifestation of uncertainty concerning the extent to which phytoplankton biomass is controlled by invertebrate grazers, particularly in mid-summer; and the degree to which this varies from year to year. The quality of data from climate models for generating flows and defining driving variables at the extremes of their distributions has been highlighted as the major source of uncertainty in water quality model outputs.
EDITOR A. Castellarin; ASSOCIATE EDITOR X. Fang
1 Introduction
A number of published reviews have made assessment of the effects of climate change on water quality in the UK from a number of different angles, all based on the 2002 UK Climate Impacts Programme (UKCIP02) climate projection scenarios (Hulme et al. Citation2002). Although these scenarios are largely qualitative and have been updated more recently (e.g. in the 2009 UK Climate Projections: UKCP09) their relevance remains of value. Johnson et al. (Citation2009) and Whitehead et al. (Citation2009) both took a holistic view of the river water quality including aspects of the ecosystems it supports. Boxall et al. (Citation2009) focused on human exposure to pathogens and chemicals from agriculture under a changed climate. Bloomfield et al. (Citation2006) looked specifically at the fate pathways of pesticides to surface and groundwaters. Essentially all studies looked at the changes in runoff, river flow and groundwater recharge brought about by changes in air temperature and the intensity, patterns and volumes of rainfall; and in the light of these physical and hydrological trends assessed likely qualitative change in water quality. Some of the more likely and important changes predicted are listed below.
Lower river flow in summer from reduced rainfall and groundwater supply. This will make for less dilution of point source effluents, notably dissolved phosphorus (P), nitrate, biochemical oxygen demand (BOD) and micro-organic contaminants. The lower river flow velocities and concomitant increase in residence times will heighten the likelihood of phytoplankton blooms, which may increase diurnal dissolved oxygen (DO) variations and cause anoxic conditions when the bloom collapses.
More intense rainfall events. This may lead to mobilization of sediments, nutrients (in particular particulate P), pesticides, E. coli and metals and increase the number of combined sewer overflow operations. For groundwaters this may increase leaching of nitrates for short periods, although generally lower rainfall volumes will lead to lower recharges rates.
Higher river temperatures. These will decrease the oxygen-holding capacity of the waters, enhance the rates of reactions that consume oxygen and encourage more toxic forms of phytoplankton to prevail. Some temperature-sensitive fish species (e.g. Salmon) might find their range of habitats reduced.
Some other indirect effects could include: (i) changes in land use that may result in different pesticide use and fertilizer application regimes, (ii) favourable conditions for invasive plant and animal species to the detriment of native species.
Climate change (CC) could impact on the water quality of all water body types and impact on regulatory and management activities to maintain good water quality. Although climate changes are projected (based on emissions scenarios) by UKCP09, the impacts on the environment are not. In this regard decision makers have a broad range of questions: (i) How and when are changes likely to have a discernible and significant impact on environmental water quality? (ii) When will the impacts require changes to existing monitoring and management options? (iii) How significant will these impacts be on the water environment compared to those predicted to result from anticipated increases in other contemporary pressures?
This paper addresses the first of these issues through a case-study assessment to quantify the specific effect of future climate impacts on water quality. To make a comprehensive projection of how water quality might actually change would require an inclusion of the effects of land-use change. River dissolved oxygen (DO), for example, is affected by nutrient loadings, and in this respect, population growth and changes in farming practice will have significant impacts and should be a key element of ongoing assessments. The present study quantifies future phytoplankton biomass (estimated using chlorophyll concentrations) and the associated effects on DO and biochemical oxygen demand (BOD) in two contrasting rivers in England. Indicators of river DO concentrations are chosen for assessment of water quality as they reflect the integrated effects of pollution and are critical to the ecological health of rivers across various trophic levels. For example, effects in fish and benthic macro-invertebrates are seen at 3–4 mg DO L−1 (Garvey et al. Citation2007). Accordingly, maintaining DO levels is a primary concern of the EU Water Framework Directive and its implementation. In contrast to the qualitative approach undertaken in existing studies cited above, daily quantifications of both the climate drivers and thereby also of water quality along a river system are made using a dynamic model. Some of the key uncertainties associated with the tools and data were also quantified. In this regard an important and novel objective of the paper was to highlight the propagation of uncertainties and errors in a climate model when predicting future change in water quality, and hence assess the suitability of the climate simulations for this purpose.
The latest climate change projections and projected UK river flows (Prudhomme et al. Citation2013) were used as input to the QUESTOR water quality model (Boorman Citation2003a, Citation2003b; Hutchins et al. Citation2010, Waylett et al. Citation2013). Water quality was predicted in the Thames (southeast England) and the Ure (northern England) ( inset map). The catchments are contrasting in terms of their relief, underlying geology, channel hydraulics, population density and geographic location, lying in regions expected to see contrasting levels of future climate-driven change on water resources. Thirty-year periods representing present climate conditions and the 2050 future climate were chosen, and a comparison made in terms of pairs of two 30-year model applications at daily time step.
Figure 1. Map of River Thames indicating locations of monitoring sites with water quality observations available each week (or more frequently) used to test the QUESTOR model: Newbridge (1), Eynsham (2), Abingdon (3), Wallingford (4). The QUESTOR upstream boundaries of the river network are on the main Thames (at Hannington), the Cherwell and the Thame. Continuous water quality monitoring data from EA were available from the Thames at Hannington and at Site 3.

The paper is organized in the following way. Firstly, the rationale behind the choice of models underpinning the approach is described (Section 2), including demonstration of the performance of QUESTOR in the Thames. Section 2 also includes for the Thames an appraisal of how model performance is affected in a chained modelling approach, namely when having to make allowance for (i) errors in rainfall–runoff modelling and (ii) the limited spatial coverage of sites for which future projected flows have been calculated. A description of the data used in the climate-model driven applications in the Thames and the Ure follows (Section 3). Results are presented (Section 4) and their implications discussed (Section 5).
2 Justification of approach
2.1 The QUESTOR water quality model
2.1.1 Method
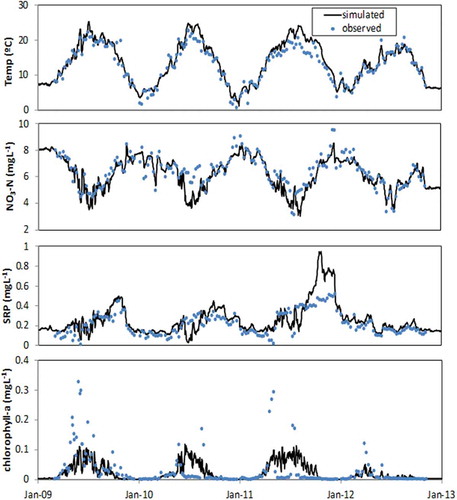
The effects of climate change on water quality were assessed using two existing published QUESTOR model applications to the River Thames (Waylett et al. Citation2013) and the River Ure sub-basin of the Yorkshire Ouse (Hutchins et al. Citation2010). It was first necessary to establish that the model was capable of simulating water quality over a longer period outside of that used for calibration to give better confidence that the same parameter sets could be used to assess the effects of changes in the driving variables (flow, water temperature and solar radiation) that would be caused by climate change. To do this, the model was applied again in the Thames for a longer period (2009–2012) and also extended downstream (). Whilst QUESTOR simulates nitrogen and phosphorus species, pH and suspended sediment, the aspects of water quality of particular interest here are those determinands indicative of the impacts on the river ecosystem, namely chlorophyll-a (Chl-a), BOD and DO. Model equations for these parameters and water temperature are given in the Appendix.
Weekly nutrient, temperature and chlorophyll-a data for sites along the River Thames and its major tributaries were provided through the CEH Thames Initiative research platform (Bowes et al. Citation2012). Continuous chlorophyll-a concentration, DO, temperature and flow data were supplied by the Environment Agency (EA) sensor network (Wade et al. Citation2012). Solar radiation inputs were modified by the effects of riparian tree shading upstream (as described by Waylett et al. Citation2013). Full details of reaches and their influences are provided (). In summary, the model represents 126.4 km of river channel network (comprising the Cherwell and Thame tributaries and the main Thames; of lengths 14.9, 19.6 and 91.9 km, respectively) split into 41 reaches. The model is fed by 23 tributaries and seven major sewage treatment works (STWs), and accounts for two abstractions and 22 weirs. Flow and water quality data to supply the model are available for all main tributaries. Other STWs (e.g. from the large town of Swindon) are represented indirectly by data from the tributaries into which their effluents flow. Monitoring data to test the model are available at 13 sites. Of these sites, four have water quality data at a temporal resolution of weekly or finer ().
Model structure differed from that of Waylett et al. (Citation2013) in the following respects. Sedimentation was represented by inferring a net settling velocity (Equation (1)), which acts as a loss from the water column for suspended solids, BOD, organic P and particulate organic nitrogen (PON). Net sedimentation of phytoplankton was not included, as simulated biomass compared well with observations without invoking settling. Loss of nitrate from the water column by denitrification (Equation (2)) was determined by hydraulic load (i.e. by including water column depth).
where vx is particle-specific net settling rate (d−1); sx is particle-specific settling velocity (m d−1), taking values of 0.25 (x: BOD, PON) or 0.5 (x: organic P, suspended solids); h is depth (m); 10k is denitrification rate (d−1); a is denitrification rate constant determined during calibration; and θ is water temperature (°C). Equations defining the model representation of phytoplankton and DO are listed in the Appendix.
Calibration of the model from Hannington to Wallingford (Site 4) was carried out for a two-year period, 2009–2010, at the sites listed in . The process was carried out successively from site to site working downstream. Rate constants of chemical processes were altered to obtain suitable values. One-by-one parameter calibration process was carried out in the following order: BOD decay (5k), Deamination (8k), Nitrification (6k), Denitrification (10k), Benthic Oxygen demand (4k), P mineralization (11k). The model was corroborated for the succeeding two years (2011–2012) by comparison with observations. The details of optimized parameters are tabulated and values of goodness-of-fit statistics (Nash-Sutcliffe efficiency for flow, percentage error in mean for temperature and water quality variables) under calibration and corroboration (2011–2012) conditions for each determinand at each site are stated (). In addition Nash-Sutcliffe efficiency values attained against daily temperature, DO and chlorophyll-a data at Abingdon for 2009 were 0.85, 0.36 and 0.47, respectively. For the biological sub-model, calibration and corroboration used global values of daily rate for phytoplankton growth (1k0 = 1.35), respiration (2k0 = 0.23) and death (3k0 = 0.23) as optimized by Waylett et al. (Citation2013), still appropriate further downstream to Site 4.
Table 1. Paired values under calibration (2009–2010) and corroboration (2011–2012) conditions (separated by comma) of Nash-Sutcliffe efficiency statistic (Nash and Sutcliffe Citation1970) for flow, and percentage error in mean for temperature, DO, nitrate (NO3), soluble reactive phosphorus (SRP) and chlorophyll-a; and calibrated parameters defining rate coefficients (k d−1) (next five columns).
2.1.2 Results
Results from the present study demonstrate a robust model over the periods of calibration and corroboration (). Model simulation of flow and temperature was good with mean Nash-Sutcliffe efficiency values across all sites between 2009 and 2012 of 0.92 and 0.90, respectively. Variation in nutrient concentrations was also captured satisfactorily with percentage error in mean values below 15% throughout for both nitrate and soluble reactive phosphorus (SRP), with the exception of the period of corroboration at Wallingford (). Here, SRP was overestimated in the summer. Low SRP concentrations are thought to be a consequence of very low flow in the Thame in 2011–2012, where it is known that such conditions especially enhance the uptake of P by bed sediments (Bowes et al. Citation2005, Jarvie et al. Citation2012).
Figure 2. Model performance at Wallingford (Site 4) for 2009–2012.
In terms of phytoplankton and DO, whilst by no means free of mismatches, the performance of the model during 2009–2012 is similar to that attained by other water quality models applied over multiple years in river networks, yet these have usually only been tested against data at fortnightly resolution at best, providing a less rigorous test than that available for a QUESTOR Thames model. Amongst these other examples, in the Moselle, the subject of considerable research effort, DO and phytoplankton (Garnier et al. Citation1999) have been simulated, and likewise in the Meuse (Everbecq et al. Citation2001). Otherwise more successful model applications have tended to be year-specific (Descy et al. Citation2003).
The model clearly identifies the unsuitability of the meterological conditions in 2012 for phytoplankton growth, whereas conditions in the other three years were more suitable as reflected in chlorophyll measurements and model simulations (). However, the model fails to fully represent the between-year variability in levels of phytoplankton biomass. This is attributed to two factors:
Light limitation due to self-shading. Data suggest phytoplankton self-shading effects are not as big a constraint to growth as the theoretical relationships used in QUESTOR would suggest.
Use of a constant grazing rate throughout the 30 year period. In some years growth of phytoplankton has appeared almost unconstrained by predators (as was probably the case in 2009; Waylett et al. Citation2013), but present data on grazing populations are insufficient to enable formulation of a better model.
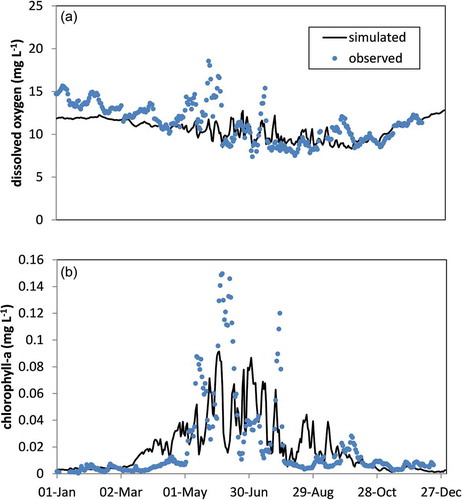
Daily data, available only in 2009, at Site 3 (Abingdon weir) further illustrate the model performance (). The model represented the timing of peaks in phytoplankton, but was less successful at estimating the magnitude and duration of peaks, especially when average values of predatory grazing were used across the years modelled (as was the case for the model set-up in this study). There was a tendency to underestimate the spring peak (thought to be dominated by the cool water centric diatom Stephanodiscus hantzschii) and to overestimate mid-summer levels when waters are warmer (–). Underestimation in spring may in part be due to rapid entrainment of benthic algae, a process not represented in QUESTOR. Benthic algae will contribute to water column chlorophyll-a determinations when mobilized. Errors in simulation of phytoplankton blooms have a detrimental impact on DO simulations, as illustrated by the overestimation of DO at Abingdon in early summer 2009. Mismatch at the start of 2009 is due to observations in tributaries being largely absent until spring. As well as improving the simulation of phytoplankton, a better understanding of grazing would lead to considerably better DO simulation, which was satisfactory outside of the bloom periods.
Figure 3. Model performance at Abingdon (Site 3) in 2009 using parameters optimized for the 2009–2010 period; results displayed for (a) dissolved oxygen (mg L−1) and (b) chlorophyll-a (mg L−1).
2.2 Data on future climate and flow
To make a comparison of the impacts in two contrasting UK situations a coherent dataset underpinned by methods that can be applied nationally was essential. For this purpose we used Future Flows Hydrology (FFH), a UK-wide consistent set of river flow predictions under future climates (for full details see Prudhomme et al. Citation2012). As has been the case in almost all recent studies projecting future water quality (e.g. El-Khoury et al. Citation2015, Fan and Shibata Citation2015) it was decided to use outputs from a single climate model to drive the simulations of hydrological and water quality impacts. Whilst it is accepted that different climate models can vary considerably in their ability to represent catchment hydrology satisfactorily (e.g. Jarsjö et al. Citation2012), use of a perturbed-physics ensemble of applications encapsulates a detailed if not comprehensive sense of uncertainties.
The climate data to derive the FFH was taken from the Hadley Centre’s ensemble projection Had3RM3-PPE which was used as part of the UKCP09 projections (Murphy et al. Citation2007). The data consist of an 11-member ensemble of flow series; one for each member of the climate data ensemble. The climate ensemble represents a range of different climate model parameterizations reflecting the uncertainty in those model parameters. All the climate model runs were made using the SRES A1BFootnote1 emissions scenario (Murphy et al. Citation2009). In addition to the data required to calculate future river flows, meteorological data directly input to QUESTOR to model water quality were also taken from the climate ensemble.
The FFH data were generated by running two hydrological models; where available FFH data generated by the Climate and Land-use Scenario in Catchments (CLASSIC) model (Crooks and Naden Citation2007) were used. CLASSIC is a semi-distributed grid-based rainfall–runoff model requiring gridded input data at daily time step, land use, soil and digital terrain data. It is calibrated against observed flows at gauging stations and therefore can implicitly take account of the influence of abstractions and discharges on the natural flow regime. Otherwise, use was made of the Continuous Estimation of River Flows (CERF) model (Griffiths et al. Citation2006) which is based on hydrological response units (HRUs: essentially defined by dividing the catchment into many sub-catchments). For each HRU the hydrologically effective rainfall is calculated and is divided into fast and slow responding soil reservoirs. These flows are then routed through the system of HRUs to the catchment outlet.
Data from the Had3RM3-PPE were available at too coarse a scale for hydrological modelling so had to be downscaled to a 1 km2 grid for the UK. Because of systematic bias in the precipitation and temperature fields from the HadRM3-PPE, monthly bias-correction procedures were applied to the data using observation-based interpolated rainfall and temperature grids. For precipitation, this was achieved using a parametric quantile mapping method based on the gamma function at the HadRM3-PPE spatial scale, followed by a spatial downscaling to produce 1 km daily precipitation. For temperature, a linear correction was applied to the data at 5 km resolution, achieving both bias correction and downscaling in a single step. Potential evapotranspiration time series at 5 km were generated using the HadRM3-PPE climate time series (including the bias-corrected temperature) based on the FAO-56 Penman Montieth method. More details of the procedure can be found in Prudhomme et al. (Citation2012).
In the CLASSIC model, CLASSIC grid cell averages of the downscaled values were used. For CERF, catchment average values were used by overlaying the catchment outline on the gridded data. In total, 281 river sites were simulated across the UK, and of these, daily flows from sites within the two catchments investigated in the case study were used. Eleven datasets of modelled flow and climate were available for the period January 1951 to December 2088. For input to QUESTOR, in accordance with agreed protocol within the climate science community, a period from 1961 to 1990 was taken to be representative of present-day conditions. Future (2050s) climate was represented by the period 2040–2069.
2.3 Uncertainty in QUESTOR predictions caused by using modelled flows
The simulation of water quality (Section 2.1.2) reveals that dissolved oxygen concentrations and phytoplankton blooms, and the interaction between the two, are very sensitive to river flow and water residence time, in particular during warm periods at low flows. Of the 22 tributaries for which inputs are required by QUESTOR only four have FFH data available (), a potential source of error in hydrological and water quality model performance within this study. Therefore an assessment was made of the particular impact under current conditions of using flows simulated from the climate model data rather than observed flows. In order to investigate this, three additional model runs were carried out based on the 2009–2010 period for which a full set of data were available. The model inputs were set up in the following ways:
A simulation based on a full set of available flow observations from 2009–2010 to test the full capability of the model. Best available input data were used (as defined in columns B and C of ). All the major tributaries had been monitored for water quality and had flow gauging stations. Daily flows in minor tributaries were not always available so they were estimated by using flows from appropriate nearby rivers and the flow magnitudes adjusted using a scaling factor based on catchment area.
A simulation based solely on observations available at FFH sites to test the influence of incomplete coverage by FFH. Flows in the tributaries not part of FFH were replaced with observations donated and scaled from sites for which FFH data were available. In terms of tributary, available sites and hydrological model used these were: Thames at Eynsham (Gauging station (GS) ID 39008 – CLASSIC, 1616 km2), Evenlode (GS 39034 – CLASSIC), Windrush (GS 39006 – CERF), Cole (GS 39090 – CERF), Thame (GS 39105 – CERF) and Ock (GS 39081 – CLASSIC).
A simulation based on modelling of flows at the FFH sites to test the influence of uncertainty in hydrological modelling.The observed flows for gauging stations 39008, 39034 and 39090, and flows at sites derived from donation of those flows, were replaced with CLASSIC simulated flows (superscripted (a) tributaries in ).
Table 2. QUESTOR Thames model tributary details and model set-ups.
For all model runs used to assess uncertainty the same chemical input data were used for each model application, i.e. observed data for 2009–2010 were used where available. Likewise the 2009–2010 observations of radiation (from Little Rissington) and water temperature described in Section 3.1.3 were used. Calibrated parameters obtained for the original 2009–10 application (number 1) were used for all three applications, which were the same as those used in the climate change assessments. Results are presented for flow DO and temperature and do not show any large impairments in model performance (). The results are described and discussed in more detail in Sections 4 and 5).
Table 3. Goodness of fit of the QUESTOR model at Eynsham and Wallingford (Nash-Sutcliffe efficiency) with tributary flows estimated by three different methods.
3 Water quality model applications
QUESTOR model applications in the Thames and Ure were made for the two 30-year periods representing present-day and future conditions. It was assumed that nutrient (N and P) drivers and BOD concentrations in the tributaries will in future remain at present-day levels. So only the effects of climate were to be considered, and not those due to changes in land use or farming practice.
Change in the quality of the rivers was assessed by comparing the number of days in the year (averaged over the two 30-year simulation periods) that exceed water quality thresholds. In this case, those thresholds were DO less than 6 mg L−1, BOD greater than 4 mg L−1, water temperature greater than 25°C and chlorophyll-a greater than 0.03 mg L−1. These criteria were chosen for illustrative purposes only but were in part guided by UK interpretation of EU Water Framework Directive targets for good status. The effect of future climate on water quality was assessed by calculating the change in daily incidence of undesirable water quality for each of the 11 pairs of 30-year simulations driven by the ensembles of flow (FFH) and climate (HADRM3-PPE) described in Section 2.
3.1 River Thames
The upper Thames basin receives mean annual rainfall of 744 mm (Marsh and Hannaford Citation2008). It is predominantly rural despite being highly populous (the dominant land classification being arable 45%, with only 6% urban/suburban) and is predominantly underlain by Oolitic Limestone, with Cretaceous Chalk in the lower catchment. At Wallingford, ample nutrient content sustains phytoplankton; nitrate-N and total phosphorus in recent years always exceeding 14 and 0.09 mgL−1, respectively (Bowes et al. Citation2012).
3.1.1 River network and flow (FFH) data
The model system comprised 41 reaches. Outputs are presented at Eynsham (44 km downstream of Hannington draining an area of 1616 km2) and Wallingford (catchment area 3445 km2). The main abstraction at Farmoor reservoir of mean flow 1.62 m3 s−1 (from Thames Water data) was assumed to be unchanged in the future. Daily FFH flow time series were used directly in the model, either for the particular tributary or to estimate the flows for tributaries where FFH had not been applied ( shows which flows were used at each site).
3.1.2 Water quality
Impacts of climate alone were considered, so the input concentrations of water quality variables were kept unchanged between the 30-year periods representing present-day and future conditions. Therefore observed quality data collated for the inflowing tributaries were replaced by average concentrations or, in the case of determinands showing clear seasonality (DO, nitrate, soluble reactive phosphorus and particulate phosphorus), monthly average concentrations. For major tributaries these were based on weekly data from 2009–2010 (Bowes et al. Citation2012) on a site-by-site basis. Mean water quality in minor tributaries was estimated where possible from long-term data from those rivers held on the Environment Agency Water Information Management System (WIMS).
3.1.3 Radiation and temperature
Previously, observed radiation and temperature had been defined as follows (Waylett et al. Citation2013): (i) a single daily radiation dataset from the Little Rissington station in the centre of the Thames catchment near the Windrush in Gloucestershire (NGR 4299 2107). It was assumed that throughout the modelled river network riparian tree cover was at 27% of bankside capacity (estimated for successive 1 km stretches using Google Earth satellite imagery), serving to reduce the incidence of direct sunlight to the river channel to 81% in mid-summer when trees are in full leaf; (ii) daily water temperatures were defined on a tributary-specific basis, being based on interpolation of measured weekly values collected in all major tributaries (Bowes et al. Citation2012).
For present-day and future climate-model driven applications, observations from 2009–2012 were replaced by: (i) radiation data from Little Rissington were replaced by downscaled radiation data from the Hadley RCM for the 25 km2 grid cell covering gauging station 39076 (Windrush at Worsham), which also covers Little Rissington; (ii) downscaled and bias-corrected air temperature data, taken for each of the 25 km2 grid cells containing each of the gauging stations used for FFH modelling. These datasets were converted to water temperatures using the well-known linear regression method of Stefan and Preud’homme (Citation1993). Linear relationships between water and air temperatures are largely robust (Mohseni and Stefan Citation1999) but are not strong in extreme conditions (Webb et al. Citation2008, Ficklin et al. Citation2012). Water temperature series were donated to tributaries not having future projections in the same way as for FFH ().
3.2 River Ure
The catchment of the River Ure draining to Boroughbridge (915 km2) is predominantly agricultural grassland (56%) with moorland headwaters, and is underlain by a mixed geology of limestone and grits. Nutrient concentrations are lower than in the Thames, with mean nitrate-N and total phosphorus concentrations being 2.82 and 0.21 mgL−1, respectively (Hutchins Citation2012), for a period encompassing that used to originally calibrate QUESTOR. Mean annual rainfall is 1138 mm.
The QUESTOR model comprised 48 reaches covering 90 km of the river and 4 km of the Snaizeholme Beck tributary (). In the Ure, a somewhat different approach was taken to that for the Thames due to a paucity of both detailed water quality data for tributaries and coverage of FFH data. FFH data were only available for one gauging station, at Kilgram Bridge (GS 27034), which is 45 km upstream of Boroughbridge (). Radiation data were provided from the Hadley RCM 25 km2 grid cell containing the gauging station. The data were modified to account for riparian tree coverage at 20% of bankside capacity (estimated from Google Earth satellite imagery), a value that equates to 93% transmission of incident sunlight to the river channel in mid-summer. As the altitude gradient across the catchment is very large (>200 m), air temperature data were taken from two grid cells covering gauging stations 27034 and also 27047 (on Snaizeholme Beck), to represent water draining from lowland and upland parts of the catchment respectively. Water temperatures were derived from air temperatures using the methodology of Stefan and Preud’homme (Citation1993).
Figure 4. Map of the River Ure catchment at Boroughbridge displaying spatial distribution of simulated nitrate leaching. Thick polygons represent the 46 groups of HRUs. The blue line represents the extent of the QUESTOR modelled network.
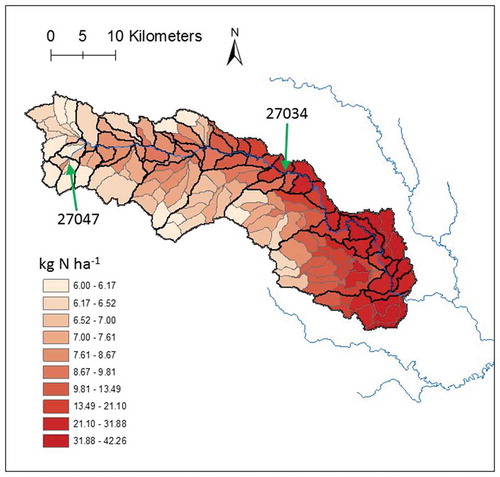
With one exception (Snaizeholme Beck) there are no gauging stations on tributaries of the Ure. Therefore estimates of tributary flows could not be based on observed data but instead were based on 46 groups of hydrological response units (HRUs, ) as defined in a hydrological transfer function used in the NALTRACES nitrate model (Hutchins Citation2012). For each of the 46 groups, flow time series were derived from the FFH for station 27034. In each case, the land area and annual hydrologically effective rainfall (as calculated from total rainfall grids in NALTRACES) were both related to values for the whole basin drained at 27034 and a scaling factor determined. These scaling factors were multiplied by the daily flow series from 27034 to derive flow series for each of the 46 groups of HRUs. It is acknowledged that such a means of estimating flows in tributaries will be imperfect. However it was chosen in the present study as any alternative resource-intensive method based on dynamic hydrological modelling which might better reflect local factors would also have been unable to overcome uncertainties typical in data poor regions. Likewise for each group of HRUs, mean annual nitrate concentrations were also derived from the NALTRACES outputs. The Environment Agency WIMS regional long-term monitoring database was used to define default values for other determinands. There are no abstractions in the network but there are 13 small point sources discharging directly into the River Ure. These point sources were represented by default values for all determinands, taken, as is the case for all default values, from long-term regional Environment Agency WIMS data. As with the Thames application, concentrations of all water quality determinands (i.e. all variables apart from flow, temperature and radiation) were assumed to remain constant between the present-day 30-year period and the future 30-year period.
The parameterization of the QUESTOR model underpinning the Ure assessment required some modifications to the original, as calibrated by Hutchins et al. (Citation2010). Specifically, a more detailed definition of river widths had permitted better simulation of water depth and water temperature. Therefore these revised hydraulic parameters were used. Whilst all other parameters remained unchanged it was decided to apply the parameters for the biological sub-model as used in the Thames rather than those originally defined by Hutchins et al. (Citation2010). This was because many more data points are available in the Thames making for greater confidence in the representation of phytoplankton dynamics. We have no reason to suspect that these dynamics are any different in the Ure.
4 Results
4.1 Changes in the driving variables
In order to interpret the results of climate change on the water quality variables modelled in QUESTOR it is important to give an idea of the changes in the driving variables (flow, air temperature and solar radiation) between the current climate and the predictions for 2050. It is interesting to note that there are differences within the Thames and particularly between the Thames and the Ure (). Of note was a large predicted reduction in the Q95 flow (the flow exceeded 95 percent of the time – a low-flow statistic) in the Thames at Eynsham under one scenario and a more than 50% increase under a different climate scenario. In the Ure, all changes in the Q95 flow were downward and much less than for the Thames. Air temperature increases were also more pronounced in the Thames catchment, although, according to the climate model, the current 90th percentile air temperature was similar in the Ure and Thames catchments (15.9 and 16.3°C respectively).
Table 4. Percentage changes in the Q95 flow, 90th percentile air temperature and 70th percentile solar radiation between present conditions and those predicted to exist in 2050.
4.2 Impacts of change
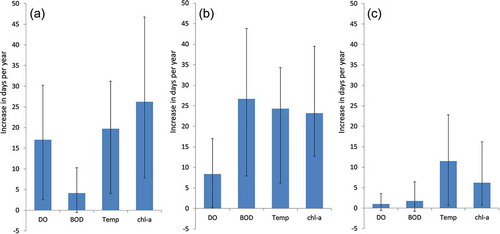
Present-day violation of water quality criteria showed differences both between rivers and within the Thames itself (). For example, for present-day conditions the frequency of violation of chlorophyll-a thresholds was much greater at Wallingford than Eynsham, which in turn was much greater still than in the Ure. For all criteria and at all three sites, future violations were predicted to be more frequent than at present (). It should be noted that the minimum and maximum values given for both present-day and future cases do not necessarily come from the same set of climate model drivers, i.e. they are the maximums and minimums from all 11 climate datasets and may give an exaggerated impression of the variability in the possible results.
Table 5. Number of days exceeding water quality criteria for dissolved oxygen (DO), biochemical oxygen demand (BOD), temperature and chlorophyll-a.
Future projected changes in water quality () also indicate a large difference between sites even on the same river network. There are also clearly large uncertainties in the magnitude of change. The presentation of results in this manner is more appropriate than a comparison of present and future conditions () as it assesses the change seen within each of the 11 model applications and then summarizes those in a bar chart. The error bars represent uncertainty in the results arising from the 11 member ensemble of driving data (air temperature, flow and solar radiation). We acknowledge that further uncertainty in these projections will exist that are attributable to the hydrological and water quality models, but to quantify these would require a substantial exercise in assessing the spatial variability of parametric uncertainty across each basin, a very substantial task outside of the scope of the present research.
Figure 5. Expected increases in the number of days per year that a water quality threshold will be exceeded in the 2050s with respect to present-day conditions at (a) Eynsham and (b) Wallingford on the River Thames and (c) Boroughbridge on the River Ure. The thresholds used were 6 mg L−1, 4 mg L−1, 25°C and 0.03 mg L−1 for DO, BOD, temperature and chlorophyll-a respectively. In each case the column represents the mean of the increases revealed by the 11 pairs of data. The error bars represent the range of values (maximum and minimum increases revealed by the 11 pairs of data) obtained for all the Future Flows Hydrology datasets used to drive the QUESTOR model.
4.3 Thames application: assessment of errors due to using modelled driving data
Results as presented in Sections 4.3.1 and 4.3.2 are general summaries of change. They mask information about hydrology and water quality under extreme conditions. An assessment of errors, in particular by pinpointing specific biases introduced through the chain of model applications, helps address issues associated with predicting the important water quality characteristics manifested under these extremes.
4.3.1 Uncertainty created by representation of input flows from tributaries
The daily dynamics of tributary flows has an impact in the Thames not only on flows directly but also on other physical parameters and water quality. As outlined in Section 2.3, Model-run 1 uses best available data, Model-run 2 assessed the impact of incomplete FFH coverage in the Thames basin, and Model-run 3 introduced the additional uncertainty inherent from errors in hydrological modelling. It can be seen that neither step greatly impaired the model performance in estimating flow (based on the Nash-Sutcliffe (NS) efficiency criterion) either at Eynsham or Wallingford (). While more substantial deteriorations in model performance occurred for DO and temperature, the performance of the QUESTOR model was considered acceptable in all cases.
4.3.2 Extended analysis for climate model drivers under summer conditions
Focusing on low-flow periods typical of the summer when conditions for photosynthesis and development of blooms are most favourable, simulations from the 2009–2010 model applications related to one another and to the observations satisfactorily (Model-run 1: ). However, when QUESTOR was configured to accept climate model-derived inputs (i.e. Model-runs 2 and 3) some systematic bias was introduced (). Furthermore, it is particularly apparent that when driven by climate model/FFH data themselves (30-year QUESTOR simulations) Q95 flow is underestimated (last column, ). The bias was especially apparent upstream (at Swinford) where Q95 flows were consistently underestimated. This bias was not, however, propagated through to overestimates of summer water temperatures. At Swinford, the 90th and 95th percentile water temperature simulations for 2009–2010 were good, even when configured to accept climate model-derived inputs (Model-runs 2 and 3). Similarly, simulation of summer chlorophyll at Swinford and summer temperature at Wallingford did not seem to be greatly affected (as illustrated by comparison of Model-run 1 with Model-runs 2 and 3). Comparison of dissolved oxygen (5th percentile) simulations (not shown in ) also showed consistent behaviour between the 30-year model runs using climate model drivers and the three 2009–2010 model runs.
Table 6. Comparison of criterion values of flow (m3 s−1), temp (°C) and chlorophyll-a (µg L−1) for various observed and simulated present-day datasets.
The inter-comparison between model applications was extended to include extreme values, beyond those thresholds that current knowledge suggests will result in environmentally harmful consequences. This showed some differences between outputs derived using the 30-year model runs based on climate model/FFH drivers and those based on the 2009–2012 QUESTOR application driven by observations (). To make the comparison, 4-year blocks of climate model-driven QUESTOR applications were assessed. For each of the 11 members of the ensemble, 27 blocks of 4-year duration were isolated and the number of days on which DO, BOD, temperature and chlorophyll criteria were exceeded were counted. This made for 297 “climate model-driven” QUESTOR assessments to be compared against the “2009–2012 observed” QUESTOR assessment.
Table 7. Comparison of threshold values exceeded (days per 4-year period) for various simulated datasets.
When considering the incidence of unfavourable BOD (at Wallingford), DO and temperature values, at the driest, sunniest and hottest times, there is some evidence to suggest the climate model drivers generally gave rise to predictions that were unfeasibly extreme (). For example at Wallingford, when driven by 2009–2012 data, DO and BOD criteria were never violated. In contrast, for “climate model-driven” applications, in 266 (89.6%) of the 297 cases daily DO fell below 6 mg L−1 over the 4-year period at some stage; and for BOD all 297 cases showed violations. Low flows (Q95) in the periods for QUESTOR applications driven by observed data were if anything slightly higher than the long-term estimates (), suggesting that summers in the 2009–2012 period in itself were not atypically dry relative to the long-term average, and therefore not likely to be especially vulnerable to poor water quality. Therefore the discrepancies in are more likely to primarily be a manifestation of the tendency of the climate model-driven applications to underestimate low flows (Q95) (). For chlorophyll, in contrast to DO, BOD and temperature, median values for days of undesirable quality for the “climate model-driven” applications at Eynsham and Wallingford are similar to the “2009–2012 observed” estimates ().
4.3.3 Uncertainties in water quality modelling
The QUESTOR water quality model does not represent perfectly the in-stream growth of chlorophyll and the subsequent effects on DO and BOD (see Section 2.1).
Wallingford summer temperatures (90th and 95th percentiles) and chlorophyll-a concentrations (90th percentile) were over- and underestimated, respectively (). The slight overestimation of temperature was not serious and may be a result of neglecting to consider the shading and cooling effect of submerged macrophytes, very prevalent in the downstream reaches of the River Thames. As for chlorophyll-a, understanding of biological interactions is incomplete and attributing reasons for mismatch is in part a matter of conjecture. However, present knowledge would suggest the failure of the model to represent extreme levels of phytoplankton growth is most likely caused by two factors discussed in Section 2.1: (i) an imperfect description of light limitation and (ii) an incomplete understanding of the effects of microzooplankton and benthic mollusc grazers.
Despite the obvious challenges associated with modelling phytoplankton biomass, the performance of the dissolved oxygen model appeared to be very satisfactory (percentage error in mean is below 5%) at Eynsham and Wallingford for the 2009–2010 (calibration) and 2011–2012 (corroboration) period.
5 Discussion
5.1 Impacts of climate change on water quality in the case study rivers
In terms of the effects in the driving variables, conditions for phytoplankton blooms will become more favourable. This is particularly with regard to the substantial increase likely in residence time due to a decrease in summer low flows. A note of caution is necessary for the upper part of the Thames where climate model drivers are suggesting the channel will become very vulnerable to drying out completely. Present-day flows in this part of the Thames are also simulated to be much lower when these are fed by tributary flows generated from FFH data. It therefore seems likely that in absolute terms, the magnitude and frequency of these blooms under climate change might be overestimated. However, when comparing present-day and future periods the indication of change in the magnitude and frequency of blooms above 0.030 mg Chl-a L−1 is more reliable.
The results reveal some unexpected features. Concerning temperature, the Ure is sensitive to solar warming due to its shallow water column at low flows. In the future, the model results suggest the Ure will in places be warmer than the Thames despite seeing a smaller projected increase in air temperature. Aside from the direct impacts on fish habitat quality, water quality is very sensitive to temperature (Hannah et al. Citation2008), highlighting the need to model water temperature accurately. It is important to note that relationships with air temperature, upon which water temperature modelling has been based, are not strong at extreme high temperatures (Webb et al. Citation2008).
Comparison of magnitudes of the water quality changes predicted in the modelling () suggests that of the two basins the Thames is more vulnerable to future climate change. The Ure would appear unlikely, even in the future, to suffer from damaging phytoplankton blooms or low DO conditions despite being susceptible to high water temperatures. This is because the residence time of river water in the Ure is much shorter than in the Thames, due mainly to higher rainfall and steeper channel gradient. There are also differences along the Thames. At Eynsham DO status is relatively more vulnerable than BOD compared to the situation at Wallingford. A large effluent discharge with high BOD load from Oxford Sewage Treatment Works (joining the Thames from a tributary downstream of Oxford, and Eynsham) is likely to make a difference to the situation at Wallingford. It is likely this is a manifestation of differences along the river in rates of BOD decay, which when calibrated for 2009–2010, invoked larger rates in reaches upstream of Eynsham than in those between Eynsham and Wallingford.
In the Thames, the future projections imply that peak phytoplankton blooms will be subject to a considerable degree of limitation in the future. Much of this is likely due to insufficient light penetrating to the bottom of the water column, but the highest blooms also result in an exhaustion of phosphorus supply. This has been observed in the middle and lower stretches of the Thames during large phytoplankton blooms in 2009 and 2011 (Bowes et al. Citation2012), but the model predicts that these incidents will become more frequent. The consequences of this are that blooms are at risk of population crashes due to nutrient limitation. If these occur in low-flow conditions there may be implications for DO levels due to the large increase of degradable organic matter (dead algal cells contribute to the BOD load) in the river channel. Sags in DO are therefore likely to occur with increasing frequency in the future. This phenomenon is represented by QUESTOR and as such could be the main reason for the predicted violation of the DO concentration criterion. The results are in accord with those arising from a model-based analysis based on UKCIP02 drivers (Cox and Whitehead Citation2009), which primarily attributed future decline in DO levels to higher water temperature.
5.2 Implications for the models underpinning the predictions
As alluded to in Section 4.3.3, modelling of phytoplankton in rivers is still in an early phase and more work needs to be done to refine the model processes, particularly related to grazing and, in the case of the Thames where biomass can be high, self-shading effects. The model predictions are therefore subject to uncertainty associated with a lack of understanding as to how to better represent these processes.
Inspection of the climate model (and Future Flows) outputs suggest that under present-day conditions values seem realistic across the majority of the cumulative frequency distributions. However, when considering for example extreme high air temperatures there are clearly values that are very unlikely despite a bias correction based on monthly statistics having been applied. Values in the climate model 1961–1990 record of 33°C for a mean daily air temperature in the Ure catchment are clearly extremely unlikely to have been attained. Several such values were found in the output data; with some daily simulated temperatures higher even than the maximum recorded air temperature in the region. Clearly, bias correction procedures have limited power at the extremes of the frequency distribution, but errors in those have a large bearing on the incidence of water quality conditions violating the criteria. This highlights the need for caution when interpreting the model outputs, as these extreme values can have a dramatic effect on the predicted water quality. These effects will be seen in the model predictions of the extreme water quality events that managers might wish to control by various interventions, so there is a need to have confidence in these predicted outputs.
Investigation into the uncertainty introduced by (i) the climate driving data and (ii) the way the hydrological models were used revealed that “hydrological” errors attributable to the definition of input flow data in the tributaries are of less significance than those associated with the derivation and downscaling of climate model rainfall, air temperature and solar radiation variables. This is not the first study worldwide to draw such a conclusion and it corroborates the findings of Raje and Krishnan (Citation2012) for example. Indeed, in formulating FFH, Prudhomme et al. (Citation2013) compared FFH with pre-2000 observations and identified the largest mismatches in dry conditions and in drier regions; these non-systematic departures were attributed in the main to climate rather than hydrological model uncertainty. The present study would appear to identify some more systematic bias in FFH output from specific basins, despite employing bias correction to precipitation and air temperature inputs. Errors associated with incomplete understanding of the water quality interactions in the river are also likely to be more substantial than those associated with hydrology, but perhaps less problematic than those related to the climate model inputs. In modelling water quality in rivers, the climate variables reinforce each other; for example low flows give rise to higher residence times and higher temperatures allied to increased solar radiation from less cloudy skies, all combining to accelerate phytoplankton growth. This multiplying effect makes it imperative that climate model outputs that drive hydrology and water quality predictions are of the best possible quality.
6 Conclusions
Given the uncertainties apparent in driving variables (flow and temperature) arising from climate model simulations, future water quality predictions should only be presented in terms of change relative to present day rather than absolute values. We also recommend that a bias correction of the simulated flow time series should be considered to remove any systematic biases, in particular regarding low-flow underestimation.
In the River Thames, the number of days when temperature, dissolved oxygen, biochemical oxygen demand and phytoplankton reach undesirable levels is likely to increase (assuming no change in nutrient loads). However, there is considerable uncertainty around the level of the increase. The driving factors are increased river residence times (from reduced flows) and air temperature. In the River Ure, much smaller changes in the occurrences of undesirable water quality are likely to occur in the future and some scenarios suggest no change.
Aside from the need for improvements to water quality models themselves, quantifying undesirable outcomes in future water quality depends on good estimates of river flow, river temperature and solar radiation. This is required across the whole distribution of these variables and in particular at low flows and high temperatures. Flow is a key driver for water quality and use of the FFH methods and datasets has been an important part of the modelling process. The quality of the data from climate models for generating the flows and defining the driving variables (air temperature and solar radiation) for the water quality modelling at the extremes of their distributions has been highlighted as the major source of uncertainty in the model outputs. While it is undoubtedly true that better water temperature models are desirable, those that are based on estimates of air temperature are limited by the reliability of the estimates of those future air temperatures. Since climate models seem to predict rather extreme (summer) temperatures (for both the present day and the future), more work is required to define the accuracy of the climate data required for more certain water quality predictions.
Acknowledgements
Flow data were accessed from the CEH National River Flow Archive (NRFA). Solar radiation data were obtained from the British Atmospheric Data Centre (MIDAS Landsat data). Thanks are due to Sue Crooks who undertook additional model runs with the CLASSIC model to enable us to extend our analysis to include the hydrological uncertainty aspects. Andrew Johnson (CEH) helped with an earlier version of part of the text. Colleagues at Defra and Environment Agency (Stuart Kirk and Glenn Watts) provided helpful comments on the manuscript.
Disclosure statement
No potential conflict of interest was reported by the authors.
Additional information
Funding
Notes
1 This is the middle of three carbon dioxide emission scenarios used in UKCP09. The scenarios reflect the emissions based on how our society develops in the future (see http://ukclimateprojections.defra.gov.uk/23198 for more details).
References
- Bloomfield, J.P., et al., 2006. Impacts of climate change on the fate and behaviour of pesticides in surface and groundwater - a UK perspective. Science of the Total Environment, 369, 163–177. doi:10.1016/j.scitotenv.2006.05.019
- Boorman, D.B., 2003a. Climate, Hydrochemistry and Economics of Surface-water Systems (CHESS): adding a European dimension to the catchment modelling experience developed under LOIS. The Science of the Total Environment, 314–316, 411–437. doi:10.1016/S0048-9697(03)00066-4
- Boorman, D.B., 2003b. LOIS in-stream water quality modelling. Part 1. Catchments and methods. The Science of the Total Environment, 314–316, 379–395. doi:10.1016/S0048-9697(03)00064-0
- Bowes, M.J., et al., 2012. Spatial and temporal changes in chlorophyll-a concentrations in the River Thames basin, UK: are phosphorus concentrations beginning to limit phytoplankton biomass? Science of the Total Environment, 426, 45–55. doi:10.1016/j.scitotenv.2012.02.056
- Bowes, M.J., Leach, D.V., and House, W.A., 2005. Seasonal nutrient dynamics in a chalk stream: the River Frome, Dorset, UK. Science of the Total Environment, 336, 225–241. doi:10.1016/j.scitotenv.2004.05.026
- Boxall, A.B.A., et al., 2009. Impacts of climate change on indirect human exposure to pathogens and chemicals from agriculture. Environmental Health Perspectives, 117, 508–514. doi:10.1289/ehp.0800084
- Cox, B.A. and Whitehead, P.G., 2009. Impacts of climate change scenarios on dissolved oxygen in the River Thames, UK. Hydrology Research, 40, 138–152. doi:10.2166/nh.2009.096
- Crooks, S.M. and Naden, P.S., 2007. CLASSIC: a semi-distributed rainfall-runoff modelling system. Hydrology and Earth System Sciences, 11, 516–531. doi:10.5194/hess-11-516-2007
- Descy, J.-P., et al., 2003. Modelling the impact of benthic filter-feeders on the composition and biomass of river plankton. Freshwater Biology, 48, 404–417. doi:10.1046/j.1365-2427.2003.01017.x
- El-Khoury, A., et al., 2015. Combined impacts of future climate and land use changes on discharge, nitrogen and phosphorus loads for a Canadian river basin. Journal of Environmental Management, 151, 76–86. doi:10.1016/j.jenvman.2014.12.012
- Everbecq, E., et al., 2001. POTAMON: a dynamic model for predicting phytoplankton composition and biomass in lowland rivers. Water Research, 35, 901–912. doi:10.1016/S0043-1354(00)00360-2
- Fan, M. and Shibata, H., 2015. Simulation of watershed hydrology and stream water quality under land use and climate change scenarios in Teshio River watershed, northern Japan. Ecological Indicators, 50, 79–89. doi:10.1016/j.ecolind.2014.11.003
- Ficklin, D.L., et al., 2012. Development and application of a hydroclimatological stream temperature model within the soil and water assessment tool. Water Resources Research, 48, W01511. doi:10.1029/2011WR011256
- Garnier, J., Billen, G., and Palfner, L., 1999. Understanding the oxygen budget and related ecological processes in the river Mosel: the RIVERSTRAHLER approach. Hydrobiologia, 410, 151–166. doi:10.1023/A:1003894200796
- Garvey, J.E., Whiles, M.R., and Streicher, D., 2007. A hierarchical model for oxygen dynamics in streams. Canadian Journal of Fisheries and Aquatic Sciences, 64, 1816–1827. doi:10.1139/f07-144
- Griffiths, J., Young, A.R., and Keller, V., 2006. Continuous Estimation of River flows (CERF) – Technical Report: task 1.3: model scheme for representing rainfall interception and soil moisture. Wallingford: CEH, 45.
- Hannah, D.M., Webb, B.W., and Nobilis, F., 2008. River and stream temperature: dynamics, processes, model and implications- Preface. Hydrological Processes, 22, 899–901. doi:10.1002/hyp.6997
- Hulme, M., Turnpenny, J., and Jenkins, G., 2002. Climate change scenarios for the United Kingdom: the UKCIP02 briefing report. Norwich, UK: Tyndall Centre for Climate Change Research, School of Environmental Sciences, University of East Anglia.
- Hutchins, M.G., 2012. What impact might mitigation of diffuse nitrate pollution have on river water quality in a rural catchment? Journal of Environmental Management, 109, 19–26. doi:10.1016/j.jenvman.2012.04.045
- Hutchins, M.G., et al., 2010. Which offers more scope to suppress river phytoplankton blooms: reducing nutrient pollution or riparian shading? Science of the Total Environment, 408, 5065–5077. doi:10.1016/j.scitotenv.2010.07.033
- Jarsjö, J., et al., 2012. Hydrological responses to climate change conditioned by historic alterations of land-use and water-use. Hydrology and Earth System Sciences, 16 (5), 1335–1347. doi:10.5194/hess-16-1335-2012
- Jarvie, H.P., et al., 2012. Within-river phosphorus retention: accounting for a missing piece in the watershed phosphorus puzzle. Environmental Science & Technology, 46, 13284–13292. doi:10.1021/es303562y
- Johnson, A.C., et al., 2009. The British river of the future: how climate change and human activity might affect two contrasting river ecosystems in England. Science of the Total Environment, 407, 4787–4798. doi:10.1016/j.scitotenv.2009.05.018
- Marsh, T.J. and Hannaford, J., 2008. UK hydrometric register. Hydrological data UK series. Wallingford: Centre for Ecology and Hydrology.
- Mohseni, O. and Stefan, H.G., 1999. Stream temperature/air temperature relationship: a physical interpretation. Journal of Hydrology, 218, 128–141. doi:10.1016/S0022-1694(99)00034-7
- Murphy, J.M., et al., 2007. A methodology for probabilistic predictions of regional climate change from perturbed physics ensembles. Philosophical Transactions of the Royal Society A: Mathematical, Physical and Engineering Sciences, 365, 1993–2028. doi:10.1098/rsta.2007.2077
- Murphy, J.M., et al., 2009. UK climate projections science report: climate change projections. Exeter, UK: Met Office Hadley Centre, 190.
- Nash, J. and Sutcliffe, J., 1970. River flow forecasting through conceptual models: part 1 - a discussion of principles. Journal of Hydrology, 10, 282–290.
- Prudhomme, C., et al., 2013. Future flows hydrology: an ensemble of daily river flow and monthly groundwater levels for use for climate change impact assessment across Great Britain. Earth System Science Data, 5, 101–107. doi:10.5194/essd-5-101-2013
- Prudhomme, C., et al., 2012. The drying up of Britain? A national estimate of changes in seasonal river flows from 11 regional climate model simulations. Hydrological Processes, 26, 1115–1118. doi:10.1002/hyp.v26.7
- Raje, D. and Krishnan, R., 2012. Bayesian parameter uncertainty modeling in a macroscale hydrologic model and its impact on Indian river basin hydrology under climate change. Water Resources Research, 48 (8), W08522. doi:10.1029/2011WR011123
- Steele, J.H. 1962. Environmental control of photosynthesis in the sea. Limnology and Oceanography, 7, 137–149.
- Stefan, H. and Preud’homme, E., 1993. Stream temperature estimation from air temperature. Journal of the American Water Resources Association, 29, 27–45. doi:10.1111/jawr.1993.29.issue-1
- Wade, A.J., et al., 2012. Hydrochemical processes in lowland rivers: insights from in-situ, high-resolution monitoring. Hydrology and Earth System Sciences, 16, 4323–4342. doi:10.5194/hess-16-4323-2012
- Waylett, A.J., et al., 2013. Physico-chemical factors alone cannot simulate phytoplankton behaviour in a lowland river. Journal of Hydrology, 497, 223–233. doi:10.1016/j.jhydrol.2013.05.027
- Webb, B.W., et al., 2008. Recent advances in stream and river temperature research. Hydrological Processes, 22, 902–918. doi:10.1002/(ISSN)1099-1085
- Whitehead, P.G., et al., 2009. A review of the potential impacts of climate change on surface water quality. Hydrological Sciences Journal, 54, 101–112. doi:10.1623/hysj.54.1.101
Appendix. Theoretical basis to QUESTOR
QUESTOR simulates chlorophyll-a (phytoplankton), biochemical oxygen demand (BOD), dissolved oxygen (DO), inorganic (P-in, equating to soluble reactive fraction) and organic phosphorus, nitrate, particulate organic nitrogen, ammonium, pH, temperature, flow and photosynthetically active radiation in the water column. Processes that the QUESTOR model represents are aeration, BOD decay, deamination, nitrification, denitrification, benthic oxygen demand, BOD sedimentation, P mineralization, in conjunction with a biological sub-model of phytoplankton (comprising growth, respiration and death), which includes nutrient uptake and release. To simulate the hydrological and chemical variables the configuration of QUESTOR as described by Boorman (Citation2003a) was used. The full sets of equations used are given elsewhere (Boorman Citation2003b), so only those equations directly impinging on phytoplankton and DO concentrations are given here.
A.1 Phytoplankton model
The growth of a mixed population of phytoplankton is modelled as described by Hutchins et al. (Citation2010) using a fixed stoichiometry model whereby the ratio chl-a:C:N:P was 1:50:10:1.
Equation (A1) Shows the photosynthetic rate with respect to biomass and temperature. For a mixed population model the calculation of maximum photosynthetic rate is based on the Arrhenius equation:
| 1 | k: photosynthetic rate (d−1) | ||||
A: concentration of phytoplankton (mg Chl-a L−1) | |||||
T: temperature (°C) | |||||
T0: 20°C | |||||
f (N) and f(L): limitation factors for nutrients and light, each holding values between 0 and 1 | |||||
θ: Arrhenius factor for temperature dependencies (θ = 1.08) | |||||
| 1 | k0: maximum phytoplankton growth rate (d−1) at T0 | ||||
Equation (A2) Calculates the limitations by nutrients, this has been taken from Michaelis Menten kinetics:
N: nitrate-N plus ammonium-N (mg L−1)
P: inorganic-P (equivalent to SRP) plus organic-P (mg L−1)
where kN = 0.1 and kP = 0.01 mg L−1.
Equation (A3) Light limitation, attenuation with depth is described by the Beer-Lambert law:
γ0: light extinction coefficient in clean water (0.01 m−1)
SS: concentration of suspended sediment (mg L−1)
LSS: light attenuation with depth due to suspended sediment (m−1 mg−1 L)
LA: light attenuation with depth due to phytoplankton (m−1 mg−1 L)
Equation (A4) Photolimitation with respect to phytoplankton-specific optimum intensities (Steele 1962):
γd: water column depth (m)
Rs: radiation at the surface not reflected (W m−2) (i.e. input solar radiation × 0.6)
L1: fraction of incoming radiation that is visible light (0.5)
L2: fraction of visible light used for phytoplankton (0.5)
L0: optimum light intensity for phytoplankton (60 W m−2)
Equation (A5) Respiration (2k):
| 2 | k0: reference respiration rate for phytoplankton (d−1) | ||||
Equation (A6) Death (3k):
| 3 | k0: reference death rate for phytoplankton (d−1) | ||||
Death is a combination of grazing and non-predatory mortality.
A.2 Dissolved oxygen model
Equation (A7) Change in dissolved oxygen:
T: a time constant representing the average retention time in the reach. This is defined by L/(bQc) in which L is length of reach (m), Q is flow out of reach (m3 s−1) and b and c are reach-specific constants. | |||||
DO: DO concentration leaving the reach (mg L−1) | |||||
DOi: input DO concentration (mg L−1) | |||||
W: aerating effect of a weir as calculated from an empirical relationship based on weir type and height | |||||
P: 1k(133.3A) = DO increase due to photosynthesis | |||||
R: 2k(133.3A) = DO decrease due to respiration | |||||
| 4 | k: benthic respiration rate (d−1) | ||||
h: mean water depth of reach (m) | |||||
| 5 | k: rate of loss of DO as BOD decays (d−1) | ||||
| 6 | k: rate coefficient for complete nitrification (d−1) | ||||
NH4: concentration of ammonium in water column (mg L−1) | |||||
| 7 | k: aeration coefficient at the water surface (d−1) (dependent on velocity, depth and temperature) | ||||
OCS: DO concentration at saturation (mg L−1) | |||||
The amount of oxygen produced in photosynthesis (P) or consumed in respiration (R) per unit mass of algae. For each 1 mg of chlorophyll-a 133.3 mg of oxygen are produced. This same ratio applies for oxygen consumption in respiration, and in additions to BOD on phytoplankton death.
A.3 Biochemical oxygen demand model
Equation (A8) Change in biochemical oxygen demand:
BOD: BOD concentration leaving the reach (mgL−1)
BODi: input DO concentration (mg L−1) (mean from all sources)
sBOD: settling velocity of BOD. A value of 0.25 m s−1 was used.
A.4 River water temperature model
Equation (A9) Change in water temperature is defined as follows:
Ti: mean temperature (°C) from all sources
T: temperature in water leaving the reach (°C)
Ro: outgoing long-wave radiation (W m−2)
H: heat flux coefficient (0.005 m−1)
The largest component for the outgoing radiation is the longwave back radiation, which is given by
Ro = 0.97σT4 (in which 0.97 is the emissivity constant of a water surface and σ is the Stefan-Boltzman constant (5.67051 × 10⁻⁸ W m−2 K−4) and T is temperature in K).
Table A1. Delineation of reaches and their influences as represented in QUESTOR.