
 ?Mathematical formulae have been encoded as MathML and are displayed in this HTML version using MathJax in order to improve their display. Uncheck the box to turn MathJax off. This feature requires Javascript. Click on a formula to zoom.
ABSTRACT
Climate change and runoff response were assessed for the Tizinafu River basin in the western Kunlun Mountains, China, based on isotope analysis. We examined climate change in the past 50 years using meteorological data from 1957 to 2010. Results of the Mann-Kendall non-parametric technique test indicated that temperature in the entire basin and precipitation in the mountains exhibited significant increasing trends. Climate change also led to significant increasing trends in autumn and winter runoff but not in spring runoff. By using 122 isotope samples, we investigated the variations of isotopes in different water sources and analysed the contributions of different water sources based on isotope hydrograph separation. The results show that meltwater, groundwater and rainfall contribute 17%, 40% and 43% of the annual streamflow, respectively. Isotope analysis was also used to explain the difference in seasonal runoff responses to climate change. As the Tizinafu is a precipitation-dependent river, future climate change in precipitation is a major concern for water resource management.
EDITOR A. Castellarin; ASSOCIATE EDITOR S. Huang
1 Introduction
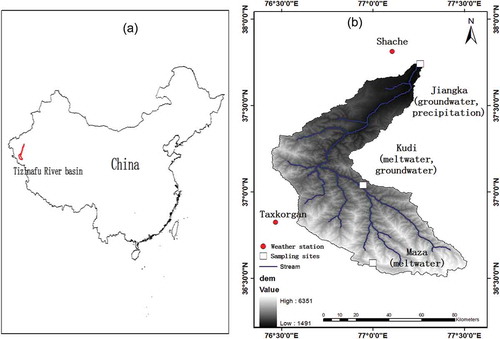
Water resources are the most restrictive factor limiting the socio-economic development in arid western China. Inland rivers in the region are characterized by scarcity of water, dependence on seasonal meltwater, and sensitivity to climate change, which have already adversely affected the sustainable development in downstream oases. The Tizinafu River basin, our study watershed, is located in the western Kunlun Mountains and is at the southern edge of the Tarim River basin, which is the largest continental river basin in the world. Within the Tizinafu River basin, the mountain-fed river is the primary water resource to meet the needs of the oases scattered along its waterway into the Taklimakan Desert for public supply, agriculture irrigation, hydropower and other uses (Shi and Zhang Citation1995, Chen and Xu Citation2010, She et al. Citation2014).
Climate change and associated hydrological responses have been studied in the mountainous regions in western China (Chen and Xu Citation2005, Chen et al. Citation2006, Piao et al. Citation2010, Xu et al. Citation2010, Chen et al. Citation2012). Hydrological processes are especially sensitive to climate change in arid mountainous watersheds (Stewart et al. Citation2004). Temperature rise in those watersheds leads to increased volume and early release of meltwater. More precipitation increases direct runoff and the accumulation of snow and ice in the watersheds. Some studies have found the high atmosphere temperature in Xinjiang to have good correlation with annual river runoff (Zhang Citation2007, Chen et al. Citation2012) and freezing layer height influences glacierized-snow meltwater processes in high mountains (Zhang et al., Citation2010). Several studies have indicated that climate change will have significant impacts on the hydrological processes in the arid mountain rivers in western China (Yeh et al. Citation1957, Chen et al. Citation2006, Chen and Xu Citation2010, Xu et al. Citation2010, Citation2011, Chen et al. Citation2012, Li et al. Citation2012, Sun et al. Citation2015a, Citation2015b, Citation2015c). However, most of the existing research focused on watersheds in the Altay and Tiansan mountains in western China. Few studies have been done in the Kunlun Mountains because of the complex terrain and climate and the lack of observations. In addition, the magnitude and variability of hydrological responses, especially streamflow, to climate change have not been fully assessed in previous studies in the region.
The Tizinafu River basin is a typical mountain watershed in the western Kunlun Mountains, a region of scarce data and few studies because of complex topography and remoteness. We chose the river basin as our study area because this is the only watershed in the region, and the newly repaved Xinjiang–Tibet highway (G219) runs through it and provides access to the watershed from its outlet (~1500 m) in the north to its southern divide at Maza Peak (5000 m) ((b)) for instrumentation and field data collection.
Figure 1. (a) Location of the Tizinafu River basin in China. (b) Terrain and sampling locations in the Tizinafu watershed
Stable isotope tracers have been widely applied in hydrological and climatological studies, though most of them were in forested and humid and temperate regions (Buttle Citation1994, Kendall and Coplen Citation2001, Burns Citation2002). Only recently, studies were done in arid mountain watersheds in western China (Zhang et al. Citation2009, Zhao et al. Citation2011, Kong and Pang Citation2012, Sun et al. Citation2016a, Citation2016b). Streamflow in the region is typically a mixture of rainfall, meltwater and groundwater. Isotope hydrograph separation using isotopic and hydrochemical tracers provides a quantitative method to differentiate the contributions to streamflow from various water sources, which can be used to study runoff response to climate change (Kong and Pang Citation2012).
In our study, we first assessed climate and runoff changes in the Tizinafu River basin, one of the few studied watersheds in the Kunlun Mountains. We then examined the runoff response to climate change based on streamflow compositions derived from isotope hydrograph separation. Our main objectives are to (1) understand how climate and runoff have changed in the past 50 years, and (2) estimate the contributions of various water sources to streamflow through isotope hydrograph separation. In addition, we discuss how runoff has responded to climate change. Our results provide insights into water resources management in the region and provide important information to help understanding of the water cycle of central Asia.
2 Study area
The Tizinafu River basin (36°31ʹ−38°54ʹN; 76°27ʹ−79°04ʹE) is located in the southwest part of the Tarim River watershed ((a)). The river basin covers an area of 5518 km2 with a mean elevation of 3605 m a.s.l. (above sea level). The primary land cover in the watershed is bare ground (51%), open shrubland (35%), grassland (9%) and wood/grassland (5%) (Li and Williams Citation2008). The main stream originates from the Kakrak Pass on the northern slopes of the Karakoram Mountains. The river has a total length of 335 km and the stream above the Jiangka gauge station has a length of 190 km. Average annual precipitation at the Jiangka station is 120 mm and average minimum and maximum temperatures are −12°C and 29°C, respectively (Li and Williams Citation2008). Mean precipitation in the lowlands and in the mountains is 53.1 mm and 186.9 mm, respectively. The average annual discharge at the watershed outlet is 28.4 m3 s−1, with an annual runoff depth of 165.2 mm for the watershed.
3 Data and methods
3.1. Data
Precipitation and temperature data from 1957 to 2010 at two meteorological stations (Taxkorgan and Shache) were downloaded from the China Meteorological Data Sharing Service System ( and ). Although Taxkorgan station is outside the Tizinafu River basin, it is the nearest weather station with an elevation above 3000 m a.s.l. Daily river discharge data were collected at the Jiangka station on the Tizinafu River during the period 1974–2010. In addition, daily observations at two sounding stations, Kashi (39.47°N, 75.98°E, 1288.7 m a.s.l.) and Hoton (37.13°N, 79.93°E, 1374.6 m a.s.l.) were downloaded from the China Meteorological Administration for calculating freezing level height in the Tizinafu River basin.
Table 1. Locations and data periods of the meteorological and hydrological stations
River water samples were collected at the Jiangka station (37°44ʹN, 77°15ʹE, 1545 m a.s.l.) every 5 days from March to November 2012 (). Precipitation event samples were also collected at the Jiangka station from January to December 2012. In total, 54 river samples and 32 precipitation samples were collected at the Jiangka station. Monthly mean river and precipitation isotope values were calculated using runoff and precipitation amount by weight ().
Table 2. Water samples and their monthly mean isotope and chemical measurements
The groundwater samples were collected from Jiangka (well depth of 20 m) and Kudi (well depth of 15 m) every month between March and November 2012. Mean monthly groundwater isotope values () were measured using a mixture of samples from the two locations. Meltwater samples were collected in the mountain area (above 4000 m a.s.l.) of the Tizinafu River basin () every month. Two meltwater samples were collected every month between March and November in the high mountains in the watershed. Mean meltwater isotope values were measured by using a mixture of the two meltwater samples for each month.
Before sampling, a 5 mL glass sample vial was washed three times using sampled water, and then filled with the water sample. Each vial was sealed immediately with Parafilm to prevent evaporation. All samples were immediately sealed in a plastic bottle and stored in a cold laboratory at −18°C. When the samples were analysed, they were stored at 4°C in a refrigerator to melt gradually and avoid evaporation.
3.2 Methods
3.2.1 Mann-Kendall trend test and abrupt change point detection
The Mann-Kendall non-parametric test (Mann Citation1945, Kendall Citation1975) was used to analyse the trends in temperature, precipitation and runoff for the past 50 years. The method has been widely applied in climate trend analysis (Yue et al. Citation2002). Besides identifying whether a significant trend exists, the method can also determine the magnitude of a trend, where positive magnitude means an “upward trend” and a negative magnitude denotes a “downward trend”.
The non-parametric method can also be used to identify when abrupt changes occur (Wei Citation2007, Chen et al. Citation2013). Assuming a time series xi of k terms (1 ≤ i ≤ k), the Mann-Kendall statistic Sk can be calculated via the following formula:
where ri is the number of precedent terms xj (j < i) that are lower than xi . For large k, under the null hypothesis of no change, Sk is normally distributed with mean and variance given by the following formulas:
The normalized variable statistic UF k , estimated as follows:
is the forward sequence. The backward sequence UB k is calculated using the same equation but with a reversed series of data. When the null hypothesis is rejected (i.e. if any of the points in the forward sequence are outside the confidence interval), the detection of an increasing (UF k > 0) or a decreasing (UF k < 0) trend is indicated. The sequential version of the test used here enables the detection of the approximate time of occurrence of the trend by locating the intersection of the forward and backward curves of the test statistic. If the intersection occurs within the confidence interval, it indicates an abrupt change point (Demaree and Nicolis Citation1990, Moraes et al. Citation1998).
3.2.2 Stable isotope and chemical analysis
Levels of δ18O and δD in surface water and groundwater samples were measured at the State Key Laboratory of Desert and Oasis Ecology, Xinjiang Institute of Ecology and Geography, Chinese Academy of Sciences. All samples were measured using cavity ring-down spectroscopy (Model DLT-100; Los Gatos Research Inc.). The precision was 0.01‰ and 0.2‰ for δ18O and δD, respectively. Results were reported relative to the standard V-SMOW (Vienna-Standard Mean Ocean Water). To avoid the memory effect associated with the continuous-flow method, measurement of each sample was repeated six times, and the first two values were discarded. Measured data were then analysed using the Liquid Water Isotope Analyser (LWIA) Post software, which determines δ18O and δD values by calculating the differences between measured values and the values in standard water samples. By applying these procedures, very accurate isotopic ratios can be achieved.
River water samples were collected in 500 mL bottles and the major ions (Ca2+, Mg2+, Na+, K+, Cl–, SO4 2 –, HCO3 – and CO3 2 –) determined. Related chemical analysis was carried out in the same laboratory. The water samples were filtered through a 0.45 μm millipore membrane, using a high-performance liquid chromatography (HPLC) method with a dual column instrument (Model Dionex CD20) which has an analytical error of less than 1 mg/L. The results of the chemical analysis are presented in Supplementary material, Table S1.
3.2.3 Hydrograph separation
Previous studies (Shen and Chen Citation2010, Sun et al. Citation2015a, Citation2015b) indicated that precipitation, groundwater and meltwater are the three main water sources in the Tarim River basin. In this research, we also assume that those water sources contribute to the streamflow of the Tizinafu River. We used the three-component method to calculate the ratios of various recharging water sources in the Tizinafu River (Hooper and Shoemaker Citation1986, Kong and Pang Citation2012). The method can be described by the following equations:
where Q is the total runoff, Qm
is the discharge of component m, and is the tracer b in component discharge m. In isotope hydrograph separation, one of the tracers should be an isotope. Several additional assumptions are required by the modelling (Sklash and Farvolden Citation1979, Turner and Macpherson Citation1990) and various environmental tracers (such as 18O, D, Si), geochemical indexes (such as total dissolved solids, TDS), electronic conductivity (EC), dissolved organic carbon (DOC) and temperature, may be used (Gibson et al. Citation2005, Kong and Pang Citation2012). In this study, we chose TDS and δ18O as the tracers for their significant difference in recharging sources.
3.2.4 Freezing level height (FLH) analysis
The high atmosphere is an important part of the climate system, and determination of the change trend of high atmosphere temperature has been an indispensable foundation for climate change research in recent years (Shi et al. Citation2007, Wang et al. Citation2010, Chen et al. Citation2012). Freezing layer height (FLH) is an important characteristic of the lower layer of the high atmosphere, whose position influences the 0°C surface and therefore affects snow/glacier melt in the mountains in the arid region of Northwest China. Some studies have found that a rise in the FLH of mountains will cause runoff to increase and a fall in FLH will result in a reduction of runoff. (Mao et al. Citation2004, Gong et al. Citation2010). When analysing stream runoff response to temperature changes, FLH in the Tizinafu River basin was calculated based on the daily observations of two sounding stations (Kashi and Hoton) maintained by the China Meteorological Administration in 1960–2012. Daily heights and temperatures at the stations are available for three standard barospheres of 850, 700 and 500 hPa at 00:00 and 12:00 h. It was observed that the spring and autumn FLH is basically between the two standard barospheres of 500 and 850 hPa. To ensure data quality, before calculating the FLH, the extreme decision method (Chen et al. Citation2012) was used to amend any gross errors caused by operational errors in sounding observations. Moreover, a two-phase regression method was applied to homogenize the sounding height and temperature sequences of the two sounding stations. The FLH was then calculated by using the following steps (Chen et al. Citation2012). First, the temperatures and heights of the upper (500 hPa) and lower (850 hPa) standard barospheres at 00:00 and 12:00 h were determined based on the location of the watershed. Then, a linear interpolation method (Chen et al. Citation2012) was used to calculate the FLH at the two times (assuming the temperature between the two standard barospheres changes linearly in a vertical direction). Finally, the mean FLH values at the two times were calculated to obtain a daily FLH. Daily FLH values between March and May and between September and November were averaged to obtain the spring and autumn FLH, respectively.
4 Analysis and results
4.1 Temperature
During the past five decades, temperature in the Tizinafu River basin has been increasing at an average rate of 0.24°C/10 years ( and ). Annual mean temperature in the plains (observed at the Shache station) rose the fastest, at a rate of 0.25°C/10 years. Temperature in the mountains (observed at the Tarkorgan station) increased just a little slower than in the plains, at 0.23°C/10 years. The Mann-Kendall test indicated that the increasing trends in annual mean temperature were statistically significant at the P < 0.01 level in both the plains and mountains and their step changes occurred in 1996 and 1987, respectively (). The step change in the plains is consistent with the step changes in the Tarim River basin and in Xinjiang (Chen and Xu Citation2010, Li et al. Citation2012). Annual temperature variation in the plains (CV of 0.04) is much weaker than that in the mountains (CV of 0.24), indicating a greater volatility of mountain temperature.
Table 3. Temperature and precipitation rates of change and step change points
Figure 2. Time series of temperature anomalies at plain (Shache) and mountain (Taxkorgan) stations in different seasons: (a) spring, (b) summer, (c) autumn, (d) winter and (e) annual

The results presented in show that winter temperature in the plains rose the fastest, at a rate of 0.46°C/10 years. The second highest temperature increase is in spring (0.33°C/10 years) in both the plains and mountains of the river basin. The slowest temperature increase (0.08°C/10 years) is in winter in the mountains. In winter, the temperature in the plains had a higher rate of increase than that in the mountains. However, in summer and autumn, the temperature in the mountains increased faster than that in the plains. For the entire basin, the spring temperature increase is the most significant, with an average rate of 0.33°C/10 years. While spring temperature in the mountains showed the strongest variability (CV of 2.29), summer temperature in the plains had the least variability (CV of 0.03) ().
It can also be seen from that most of the significant temperature step change points occurred around 1990, which is consistent with previous studies indicating that step change points generally occurred in the latter part of the 1980s in Xinjiang (Chen and Xu Citation2005, Li et al. Citation2012). The increase in annual mean temperature in the Tizinafu River basin between the periods 1957–1989 and 1990–2010 is 0.68°C in both the plains and the mountains. The rate, however, is smaller than increases between the two periods in Xinjiang (1.05°C) and Northwest China (1.03°C) (Li et al. Citation2012).
4.2 Precipitation
Although annual precipitation showed increasing trends in both the plains and the mountains, only the increase in mountain precipitation, at a rate of 4.8 mm/10 years (6.23%/10 years), is significant at the P < 0.05 level and it has a significant step change point in 1997 (). Plain precipitation showed stronger variability than mountain precipitation. The increase in annual plain precipitation between the periods 1957–1989 and 1990–2010 in the Tizinafu River basin was 15.23 mm (32.32%), which is larger than the increases in Northwest China (9.12 mm) and Xinjiang (10.44 mm) between the same periods (Li et al. Citation2012).
At the seasonal scale, the increase in summer precipitation in the mountains is the fastest, at a rate of 3.49 mm/10 years (7.08%/10 years), followed by autumn at 1.96 mm/10 years (62.62%/10 years) and spring at 1.63 mm/10 years in the plains (14.84%/10 years). Spring precipitation in the mountains had the lowest increase rate of only 0.26 mm/10 years (20.07%/10 years) ( and ).
Figure 3. Time series of precipitation anomalies at plain (Shache) and mountain (Taxkorgan) stations: (a) spring, (b) summer, (c) autumn, (d) winter and (e) annual
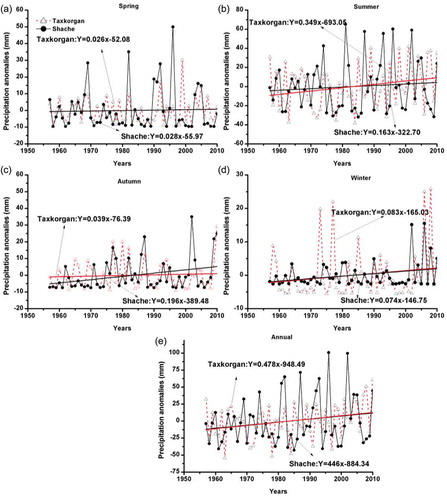
According to previous studies (Li et al. Citation2012, Sun et al. Citation2015a, Citation2015b), the precipitation for Xinjiang showed a significant increasing trend around 1990. Between the periods 1957–1989 and 1990–2010, precipitation in the mountains increased only slightly, by 12.94 mm (18.68%), which is much smaller than the increases in Xinjiang (39.8 mm) and Northwest China (30 mm) between the same two periods (Li et al. Citation2012).
4.3 Runoff
Over the past 40 years, annual runoff in Tizinafu River basin showed a significant increasing trend with a step change point in 1998 ( and ). This step change point lagged behind the step change point (1993) of other rivers in Xinjiang (Li et al. Citation2012). Runoff variation (CV of 0.18) in the basin was smaller than precipitation variation, but greater than temperature variation in the plains.
Table 4. Runoff rates of change and step change points
Figure 4. Time series of annual and seasonal runoff anomalies: (a) spring, (b) summer, (c) autumn, (d) winter and (e) annual
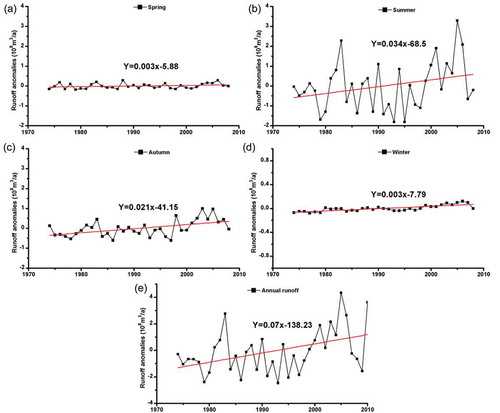
At the seasonal scale, the summer runoff increase was the fastest at a rate of 0.034 × 10⁹ m3/10 years (0.51%/10 years), followed by autumn at a rate of 0.021 × 10⁹ m3/10 years (2.15%/10 years). Spring and winter runoff increases are slowest, both at a rate of 0.003 × 10⁹ m3/10 years (0.81%/10 years and 1.46%/10 years, respectively). Runoff increases in autumn and winter are both statistically significant at the P < 0.01 level. The summer runoff increase is statistically significant at P < 0.05, but the spring runoff increase is not significant (). All the seasons except for spring had significant step change points around 1997. While the summer runoff variation is the lowest (CV of 0.17), the autumn runoff variation is the highest (CV of 0.34).
Compared with the period 1957–1989, runoff in the Tizinafu River increased by 9.13% during the period 1990–2010. This increase is slightly smaller than that in Xinjiang (12.27%) and Northwest China (11.7%) between the same periods (Li et al. Citation2012). At the seasonal scale, autumn runoff in the period 1990–2010 showed the fastest increase (34.6%) followed by winter runoff (22.7%) compared with the runoff in the period 1957–1989. Summer runoff and spring runoff increased less, by only 7.4% and 6%, respectively, between the two periods. In general, runoff in the Tizinafu River has a significant increasing trend and autumn runoff has the most obvious change.
4.4 Characteristics of water chemistry and stable isotopes
4.4.1 Water chemistry
In arid areas, since the precipitation amount of a single event is usually small, precipitation TDS was measured by using a mixture of all the samples in a month. Nine mixed samples were analysed for their hydrochemical properties. The concentrations of the major dissolved solutes in the precipitation ranged from 70 to 130 mg/L, with HCO3 − as the major anion, and Ca2+ as the major cation. The relatively higher solute concentrations in the precipitation may be due to the dust storms that frequently occur in the region. Nine mixed samples of groundwater were also analysed. The concentrations of major dissolved solutes in groundwater ranged from 715 to 740 mg/L (), with SO4 2− and Cl− as the major anions, and Ca2+ and Na+ the major cations in the groundwater. As for mixed meltwater samples, the concentrations of the major dissolved solutes in meltwater ranged from 150 to 174 mg/L, with HCO3 − and Cl− the major anions, and Ca2+ and K+ the major cations. The relatively higher solute concentrations in meltwater may be due to the fact that the precipitation has higher solute concentrations and dust accumulation when snow/ice is on the ground. River water in the Tizinafu River is generally fresh (370 < TDS < 410 mg/L), with HCO3 −, SO4 2− and Cl− the major anions, and Ca2+ and Na+ the major cations.
4.4.2 Characteristics of water stable isotopes
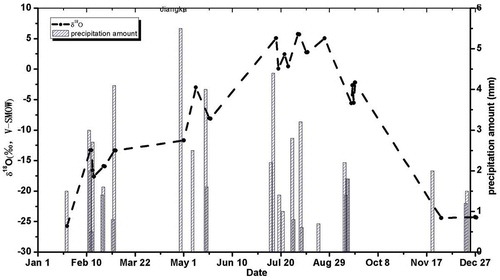
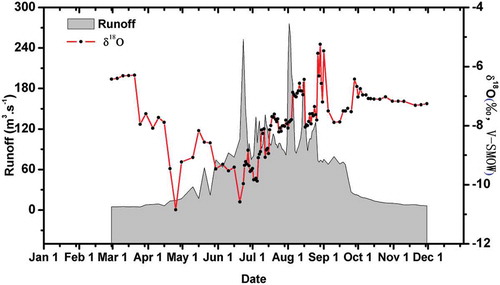
Values of δ18O in precipitation at the Jiangka station vary between −27.00‰ and 7.00‰, with a precipitation-weighted mean of −13.33‰ (). The range is smaller than that in Western China (−37.00‰–2.50‰) (Tian et al. Citation2007). Seasonal variation at the station is clear, with large and maximum δ18O occurring between July and August and low and minimum δ18O observed between December and February (). The significant variation in precipitation δ18O indicated varied water vapour sources in the basin and significant evaporation in the summer precipitation.
Figure 5. Precipitation amount and δ18O at the Jiangka station in 2012
shows the monthly variation of mean δ18O, δD and TDS in the Tizinafu River from March to November 2012. High meltwater isotope values were observed in March and October. Low meltwater values were found in July and August because of ice/glacier melting. Groundwater δ18O and δD in the Tizinafu River showed a pattern of high values in spring and low values in autumn. The higher isotopic values of groundwater in spring are mainly caused by the snow meltwater discharged into the groundwater. The lower isotopic values of groundwater in autumn are mainly caused by glacierized meltwater discharged into the groundwater. Like most rivers of Western China (Zhao et al. Citation2011, Kong and Pang Citation2012), river water in the Tizinafu River exhibits relatively large temporal variations in both δ18O and δD, with δ18O ranging from –9.15‰ to –6.88‰ and δD from –56.00‰ to –37.77‰. Seasonal variations are obvious in river water δ18O, with a minimum monthly mean value of –9.15‰ in April and a maximum monthly mean value of –6.88‰ in March (). River water δ18O shows an increasing trend in September (), while it remains almost constant in winter.
Figure 6. River water δ18O and runoff discharge measured at the Jiangka station from March to December in 2012
4.5 Isotopic partitioning of streamflow components
In order to understand runoff responses to climate change, we also calculated the contributions of different water sources based on hydrographic separation. Previous studies (Shen and Chen Citation2010, Sun et al. Citation2015a, Citation2015b) indicated that precipitation, groundwater and meltwater are the three main sources in the Tarim River basin. We also assumed that those three water sources are the main contributions to the stream discharge in the Tizinafu River. Using monthly mean TDS and δ18O values of groundwater, meltwater and precipitation from and using Equationequation (5)(5)
(5) , we obtained the monthly contribution of each component in the Tizinafu River.
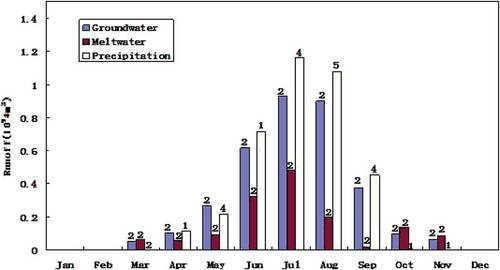
shows the contributions of groundwater, precipitation and meltwater between March and November. The contributions from precipitation and groundwater present an increasing trend from March to July and a decreasing trend from July to November. The meltwater contribution, however, presents a double-peak pattern with two maxima in July and October, although the peak in October is much smaller than that in July. We do not discuss the values for January, February and December, because the streamflow in this period was mainly derived from groundwater.
Figure 7. Monthly contributions of groundwater, precipitation and meltwater to stream discharge in the Tizinafu River. Hydrograph separation was not performed for December, January and February as groundwater is the only source in those months. The numbers on top of the vertical bars are the number of samples used
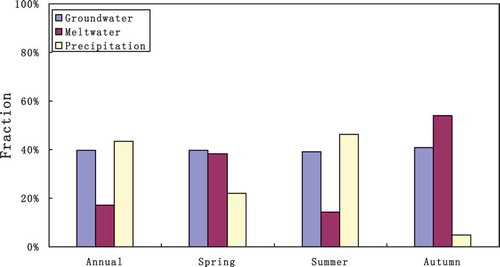
shows the contributions of the sources in different seasons. The river discharge includes a strong impulse of meltwater (38%) in spring (March to May). Another major meltwater contribution (54%) occurs in autumn (September to November). In summer, 47% of the runoff is from rainfall, and precipitation becomes the main source. Groundwater is also an important source in the Tizinafu River and it contributes more than 40% of the runoff throughout the seasons. Considering the runoff amount in the different periods, rainfall and groundwater have the largest contributions to annual streamflow, of 43% and 40%, respectively. However, the overall proportion of meltwater in the river is about 17%. Though meltwater is the primary water source for most of the inland rivers in the region (Shen and Chen Citation2010, Jin et al. Citation2012), our research indicates that the Tizinafu River is an exception in that precipitation is the dominant water source.
Figure 8. Annual and seasonal contributions of groundwater, precipitation and meltwater to stream discharge in the Tizinafu River. Hydrograph separation was not performed for winter as groundwater is the only source of stream discharge
5 Discussion
Isotope analysis indicated that meltwater (54%) is the major source of autumn runoff. Meteorological data showed that autumn temperature, especially in the mountains, has increased significantly (1.3°C) over the past 50 years ((c)). This rising autumn temperature produced more meltwater and therefore increased autumn runoff in the river. Indeed, in the past 20 years, autumn runoff in the river exhibited a significant increasing trend with an average rate of 0.021 × 10⁹ m3/10 years. Autumn runoff also showed a significant correlation with autumn temperature in the mountains (Pearson’s r of 0.47). This evidence indicates that rising autumn temperature in the mountains might be the primary cause of increasing autumn runoff in the river.
In addition to a direct contribution to autumn runoff, meltwater may also infiltrate into the ground and force groundwater out through the fill-and-spill process (Jin et al. Citation2012). This is demonstrated by the relatively higher groundwater contribution (41%) in autumn than in spring (40%) and summer (39%) ().
Isotope analysis showed that almost 47% of summer runoff is from rainfall. During the past 50 years, annual precipitation in the mountains shows a significant increasing trend at the rate of 4.8 mm/10 years. Of this, 3.5 mm comes from the summer precipitation increase (). As such, we would expect a significant increase in summer runoff in the river. Historical runoff data did show that summer runoff in the river showed a significant increasing trend, at the rate of 0.034 × 10⁹ m3/10 years, which is greater than the rate of autumn runoff.
Mann-Kendall analysis also indicated that mountain precipitation had a step change in 1997 and, in the following years, mountain precipitation started increasing rapidly. As a response, runoff also increased rapidly and had a step change in 1998. Summer temperature also showed a significant increasing trend. However, it had the lowest increase rate among all the seasons and meltwater only contributed 14% of summer runoff. The higher proportion of precipitation to runoff (47%) suggested that the summer precipitation increase is probably the main source of significant summer runoff increase.
Isotope analysis indicated that spring runoff has a similar composition to autumn runoff where meltwater is the major water source. Meteorological data showed that, over the past 50 years, spring temperature increased faster than autumn temperature both in the plains and in the mountains (). As such, we would expect a significant and larger increase of spring runoff. However, historical runoff data did not show a higher increase rate in spring runoff.
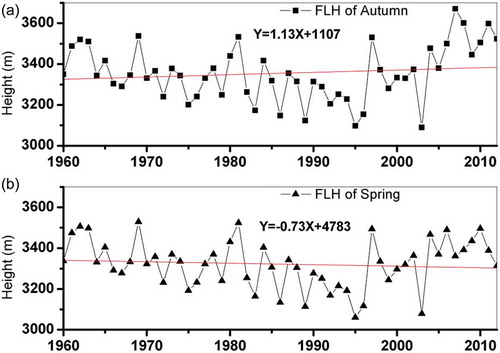
The change of FLH may explain this abnormality. Chen et al. (Citation2012) found the change of runoff on the northern slopes of the Kunlun Mountains was related to the change of regional FLH. Their study showed that the FLH of the northern slopes of the Kunlun Mountains had a decreasing trend over the past 50 years. We analysed the FLH change in the Tizinafu River basin over the past 50 years. Our results indicate that spring FLH showed a decreasing trend but autumn FLH did not show a significant change (). We think that the decreasing FLH might have cancelled out the temperature increase in spring and therefore did not contribute more meltwater to spring runoff.
Figure 9. Change in 0°C level height (freezing level height, FLH) in the Tizinafu River basin over the past 50 years: (a) autumn and (b) spring
In this study, samples were collected at different elevations across the Tizinafu watershed. These samples are representative for understanding the major hydrological processes in the watershed. However, if time and resources permit in the future, we would like to collect more precipitation samples in the high-elevation area of the watershed. In addition, it would also be useful if we can obtain more groundwater and meltwater samples from the watershed.
6 Conclusions
Climate change in the Tizinafu River basin was assessed using historical temperature, precipitation and runoff data for the past 50 years. Climate trends were examined using the Mann-Kendell non-parametric technique and runoff response to climate change was also explored based on the isotope hydrograph separation of streamflow components.
Our results show that the Tizinafu River basin has become warmer in the past few decades, with significant increasing trends at annual and seasonal scales in both the plains and the mountains, except for winter in the mountains. Annual temperature increase rates in the plains and the mountains are 0.23°C/10 years and 0.25°C/10 years, respectively. The temperature change in this region is significant. The temperature trends, however, are weaker than the trends found in Xinjiang and Northwest China. As for precipitation, although increasing trends were found at the annual and seasonal scales in both the plains and mountains, only the annual precipitation in the mountains had a significant trend, at the rate of 4.8 mm/10 years. Climate change has also resulted in runoff change in the river, with significant increasing trends at annual and seasonal scales except for spring. In the past 40 years, the annual runoff increase rate was 0.07 × 10⁹ m3/10 years. However, this trend is also smaller than the average increasing trend in runoff found for Xinjiang.
Isotope hydrograph separation indicated that, at the annual scale, precipitation is the major water source (43%) followed by groundwater (40%). In contrast to most of the inland rivers in the region, meltwater in the Tizinafu River basin contributed only 17% of streamflow annually. An increase in autumn temperature led to more meltwater and a rapid increase in autumn runoff. An increase in summer mountain precipitation also led to increased summer runoff. However, rising spring temperature did not lead to a significant increase in spring runoff. We suspect the decreasing trend in spring freezing level height (FLH) might be the reason for this.
Precipitation is an important component in the Tizinafu River basin, and meltwater contributes a relatively small portion of its annual streamflow. Future precipitation change will have significant impacts on the streamflow of the watershed. To quantify the impacts of climate change, we plan to build a hydrological model for the watershed that considers both rainfall and snow/ice melt runoff. Using the modelling and downscaled predictions from various climate change scenarios, we hope to provide quantitative projections for streamflow changes that can be used for water resource management in the watershed under future climate change.
HSJ-2015-0249_Supplementary_material.docx
Download MS Word (17.3 KB)Disclosure statement
No potential conflict of interest was reported by the authors.
Supplemental data
Supplemental data for this article can be accessed here.
Additional information
Funding
Related Research Data
References
- Burns, D.A. , 2002, Stormflow-hydrograph separation based on isotopes: the thrill is gone ? what’s next? Hydrological Processes , 16 (7), 1515–1517. doi:10.1002/(ISSN)1099-1085
- Buttle, J.M. , 1994, Isotope hydrograph separations and rapid delivery of pre-event water from drainage basins. Progress in Physical Geography , 18 (1), 16–41. doi:10.1177/030913339401800102
- Mann, H.B. , 1945. Nonparametric tests against trend. Econometrica, Journal of the Econometric Society , 13, 245–259. doi:10.2307/1907187
- Chen, Y. and Xu, Z. , 2005, Plausible impact of global climate change on water resources in the Tarim River Basin. Science in China: (Series D) , 48 (1), 65–73. doi:10.1360/04yd0539
- Chen, Y. and Xu, Z. , 2010. Physical geography of arid land in China . Beijing: Science Press, 226.
- Chen, Y.N. , et al. 2006. Regional climate change and its effects on river runoff in the Tarim Basin, China. Hydrological Processes , 20 (10), 2207–2216. doi:10.1002/hyp.6200
- Chen, Z.S. , Chen, Y.N. , and Li, W.H. , 2012, Response of runoff to change of atmospheric 0° C level height in summer in arid region of Northwest China. Science China Earth Sciences , 55 (9), 1533–1544. doi:10.1007/s11430-012-4472-6
- Chen, Z.S. , Chen, Y.N. , and Li, B.F. , 2013. Quantifying the effects of climate variability and human activities on runoff for Kaidu River Basin in arid region of northwest China. Theoretical & Applied Climatology , 111, 537–545. doi:10.1007/s00704-012-0680-4
- Demaree, G.R. and Nicolis, C. , 1990, Onset of Sahelian drought viewed as a fluctuation-induced transition. Quarterly Journal of the Royal Meteorological Society , 116 (491), 221–238. doi:10.1002/(ISSN)1477-870X
- Gibson, J.J. , Edwards, T.W.D. , and Birks, S.J. , 2005, Progress in isotope tracer hydrology in Canada. Hydrological Processes , 19 (1), 303–327. doi:10.1002/hyp.5766
- Gong, H.R. , Shi, Y. , and Feng, Z.M. , 2010. Relationship between the 0℃ layer height and the streamflow of the Urumqi River in the period of spring snowmelt (in Chinese). Arid Zone Research , 27, 69–74. doi:10.3724/SP.J.1148.2010.00069
- Hooper, R.P. and Shoemaker, C.A. , 1986, A comparison of chemical and isotopic hydrograph separation. Water Resources Research , 22 (10), 1444–1454. doi:10.1029/WR022i010p01444
- Jin, L. , Siegel, D.I. , and Lautz, L.K. , 2012. Identifying streamflow sources during spring snowmelt using water chemistry and isotopic composition in semi-arid mountain streams. Journal of Hydrology , 470–471, 289–301. doi:10.1016/j.jhydrol.2012.09.009
- Kendall, C. and Coplen, T.B. , 2001, Distribution of oxygen-18 and deuterium in river waters across the United States. Hydrological Processes , 15 (7), 1363–1393. doi:10.1002/(ISSN)1099-1085
- Kendall, M.G. , 1975. Rank correlation measures . London: Charles Griffin, P202.
- Kong, Y. and Pang, Z. , 2012. Evaluating the sensitivity of glacier rivers to climate change based on hydrograph separation of discharge. Journal of Hydrology , 434, 121–129. doi:10.1016/j.jhydrol.2012.02.029
- Li, B.F. , et al., 2012. Trends in runoff versus climate change in typical rivers in the arid region of northwest China. Quaternary International , 282, 87–95. doi:10.1016/j.quaint.2012.06.005
- Li, X. and Williams, M.W. , 2008, Snowmelt runoff modelling in an arid mountain watershed, Tarim Basin, China. Hydrological Processes , 22 (19), 3931–3940. doi:10.1002/hyp.v22:19
- Mao, W.Y. , Wu, J. , and Chen, C.Y. , 2004. Relationship of 0°C level height and summerflood of Aksu River, Xinjiang. Journal Glaciology Geocryology , 26, 697–704 in Chinese.
- Moraes, J.M. , et al. 1998. Trends in hydrological parameters of a Southern Brazilian watershed and its relation to human induced changes. Water Resources Management , 12 (4), 295–311. doi:10.1023/A:1008048212420
- Piao, S. , Ciais, P. , and Huang, Y. , 2010, The impacts of climate change on water resources and agriculture in China. Nature , 467 (7311), 43–51. doi:10.1038/nature09364
- She, J. , et al. 2014. Changes in snow and glacier cover in an arid watershed of the western Kunlun Mountains using multisource remote-sensing data. International Journal of Remote Sensing , 35 (1), 234–252. doi:10.1080/01431161.2013.866296
- Shen, Y.J. and Chen, Y.N. , 2010, Global perspective on hydrology, water balance, and water resources management in arid basins. Hydrological Processes , 24 (2), 129–135.
- Shi, Y.F. and Zhang, X.S. , 1995, Impact of climate-change on surface-water resource and tendency in the future in the arid zone of northwestern China. Science in China Series B-Chemistry Life Sciences & Earth Sciences , 38, 1395–1408.
- Shi, Y.F. , et al., 2007. Recent and future climate change in Northwest China. Climatic Change , 80, 379–393. doi:10.1007/s10584-006-9121-7
- Sklash, M.G. and Farvolden, R.N. , 1979, The role of groundwater in storm runoff. Journal of Hydrology , 43 (1), 45–65. doi:10.1016/0022-1694(79)90164-1
- Stewart, I.T. , et al. 2004. Changes in snowmelt runoff timing in western North America under abusiness as usual climate change scenario. Climatic Change , 62 (1–3), 217–232. doi:10.1023/B:CLIM.0000013702.22656.e8
- Sun, C.J. , et al., 2015a. Analysis on the streamflow components of the typical inland river, Northwest China. Hydrological Sciences Journal , 61 (5), 970–981. doi:10.1080/02626667.2014.1000914
- Sun, C.J. , et al., 2015b. Isotopic and hydrochemical composition of runoff in the Urumqi River, Tianshan Mountains, China. Environmental Earth Sciences , 74, 1521–1537. doi:10.1007/s12665-015-4144-x
- Sun, C.J. , et al., 2015c. Isotopic time-series partitioning of streamflow components under regional climate change in the Urumqi River. northwest China, Hydrological Sciences Journal , 61 (8), 1443–1459. doi:10.1080/02626667.2015.1031757
- Sun, C.J. , et al., 2016a. Spatial and temporal characteristics of stable isotopes in the Tarim River Basin. Isotopes in Environmental & Health Studies . doi:10.1080/10256016.2016.1125350
- Sun, C.J. , et al., 2016b. Comparative study of streamflow components in two inland rivers in the Tianshan Mountains, Northwest China. Environmental Earth Sciences , 75 (9). doi:10.1007/s12665-016-5314-1
- Tian, L.D. , et al., 2007. Stable isotopic variations in west China: A consideration of moisture sources. Journal of Geophysical Research: Atmosphere , (1984–2012), 112(D10). 10.1029/2006JD007718
- Turner, J.V. and Macpherson, D.K. , 1990, Mechanisms affecting streamflow and stream water quality: an approach via stable isotope, hydrogeochemical, and time series analysis. Water Resources Research , 26 (12), 3005–3019.
- Wang, J. , Li, H.Y. , and Hao, X.H. , 2010. Responses of snowmelt runoff to climatic change in an inland river basin, Northwestern China, over the past 50 years. Hydrology and Earth System Sciences , 14, 1979–198. doi:10.5194/hess-14-1979-2010
- Wei, F.Y. , 2007. Diagnose and forecast technology of modern climate statistics . Beijing: China Meteorological Press.
- Xu, C.C. , et al. 2010. Hydrology and water resources variation and its response to regional climate change in Xinjiang. Journal of Geographical Sciences , 20 (4), 599–612. doi:10.1007/s11442-010-0599-6
- Xu, J.H. , et al. 2011. The nonlinear trend of runoff and its response to climate change in the Aksu River, western China. International Journal of Climatology , 31 (5), 687–695. doi:10.1002/joc.2110
- Yeh, T.C. , Lo, S.W. , and Chu, P.C. , 1957, The wind structure and heat balance in the lower troposphere over Tibetan Plateau and its surrounding. Acta Meteorological Sinica , 28, 108–121.
- Yue, S. , Pilon, P. , and Cavadias, G. , 2002, Power of the Mann–Kendall and Spearman’s rho tests for detecting monotonic trends in hydrological series. Journal of Hydrology , 259 (1), 254–271. doi:10.1016/S0022-1694(01)00594-7
- Zhang, Y. , Song, X. , and Wu, Y. , 2009. Use of oxygen-18 isotope to quantify flows in the upriver and middle reaches of the Heihe River, Northwestern China. Environmental Geology , 58, 645–653. doi:10.1007/s00254-008-1539-y
- Zhang, G. , 2007, The response of annual runoff to the height change at the zero temperature level in summer over Xinjiang. Acta Geographica Sinica , 62 (3), 279–290.
- Zhang, G.X. , et al., 2010. The response of annual runoff to the height change of the summertime 0°C level over Xinjiang. Journal Geographic Sciences , 20, 833–847. doi:10.1007/s11442-010-0814-5
- Zhao, L.J. , Yin, L. , and Xiao, H.L. , 2011, Isotopic evidence for the moisture origin and composition of surface runoff in the headwaters of the Heihe River basin. Chinese Science Bulletin , 5656 (1), 58–67.