
 ?Mathematical formulae have been encoded as MathML and are displayed in this HTML version using MathJax in order to improve their display. Uncheck the box to turn MathJax off. This feature requires Javascript. Click on a formula to zoom.
ABSTRACT
West Africa experienced severe drought during the 1970s and 1980s, posing a threat to water resources. A wetter climate more recently suggests recovery from the drought. The Mann-Kendall trend and Theil-Sen’s slope estimator were applied to detect probable trends in weather elements in four sub-basins of the Niger River Basin between 1970 and 2010. The cross-entropy method was used to detect breakpoints in rainfall and runoff, Spearman’s rank test for correlation between the two, and cross-correlation analysis for possible lags. Results showed an overall increase in rainfall and runoff and a decrease in sunshine duration. Spearman’s coefficients suggest significant (5%) moderate to strong rainfall–runoff correlation for three sub-basins. A significant lower runoff was observed around 1979, with a rainfall break around 1992, indicating possible cessation of the drought. Temperatures increased significantly, at 0.02–0.05°C year-1, with a negative wind speed trend for most stations. Half of the stations exhibited an increase in potential evapotranspiration.
EDITOR M.C. Acreman
ASSOCIATE EDITOR Not assigned
1 Introduction
Scientists are unanimous on the fact that, during the early 1970s, a break occurred in the hydro-climate of West Africa and this was followed by the great drought and famine of the 1980s (e.g. Nicholson Citation2001, L’Hôte et al. Citation2002, Peugeot et al. Citation2003, Séguis et al. Citation2004, Mahé et al. Citation2005, Goula et al. Citation2007, Omotosho Citation2008, Lebel et al. Citation2009). The first works to highlight the great drought were conducted in the framework of the HAPEX-Sahel project (e.g. Le Barbé and Lebel Citation1997, Lebel et al. Citation1997) . The AMMA-CATCH project was set up to document the great drought and its impacts on West African populations (Lebel et al. Citation2009). It was reported that the mean annual discharge of several Sahelian rivers decreased drastically as a consequence of the rainfall decrease (Andersen et al. Citation2005, Mahé et al. Citation2005). This decrease in annual discharge was coupled with an increase in the groundwater table in certain aquifers of the Sahel, leading to the “Sahelian Paradox” (Descroix et al. Citation2009). The reduction in land cover caused an increase in the runoff coefficient, which in turn favoured the filling of ponds and therefore groundwater recharge.
While certain authors insist that the great drought still prevails, others think that it has ended. Omotosho (Citation2008) reported a shift to wetter conditions at the station of Kano (Sahelian zone of Nigeria), with the period 1996–2000 being the wettest 5-year period since 1931. L’Hôte et al. (Citation2003, Citation2002), however, claimed that the drought of the 1980s continued and Kasei et al. (Citation2010) reported that moderate to extreme droughts dominated the climate of the Volta River Basin during the period 1961–2005. In an early study in the same basin (i.e. Volta River Basin), Oguntunde et al. (Citation2006) reported that rainfall decreased at a rate of 6 mm year-1 during the 1970–2002 sub-period against an increase of 49 mm year-1 during the sub-period 1901–1969. Paturel et al. (Citation1998) pointed out the succession of wet and dry decades during both halves of the twentieth century along with a heterogeneous spatial manifestation of the drought within 16 non-Sahelian West and Central African countries. For Ali and Lebel (Citation2009), the years 1990–2006 had different characteristics in comparison with the four previous decades and the great drought of the 1970s and 1980s. Ali and Lebel (Citation2009) found that wet years were dominant in the eastern Sahel, whereas the opposite was true in the western Sahel. In another report, Lebel and Ali (Citation2009) specified that recovery from the drought was real in the eastern Sahel, almost real in the central Sahel, but not yet actual in the western Sahel. An investigation based on a total of 54 stations located between latitudes 4°N and 17°N and longitudes 3°W and 16°W revealed that the drought had ended for only six stations (Ardoin et al. Citation2003). Ozer et al. (Citation2003) noticed that for some stations located in Chad, Mali, Niger and Senegal there was an average lag of 12 years between the “beginning of the drought” and its “statistical identification”. Ozer et al. (Citation2003) thus opposed the conclusion of L’Hôte et al. (Citation2003, Citation2002) and suggested that data for approximately 10 years (2001–2010) were necessary to confirm or reject the shift of the climate to wetter conditions. Studies using recent data on the “re-greening” of the Sahel (Dardel et al. Citation2014a, Citation2014b) and on recent trends in heavy rainfall in the Central Sahel (Panthou et al. Citation2014) seem to confirm the hypothesis of Ozer et al. (Citation2003).
In this debate, certain zones get little attention, as is the case for the upper Republic of Benin, where the study area for this paper is located. The research area has been the focus of very few studies (Vissin Citation2007). Amogu et al. (Citation2010) studied 29 West African catchments including the current research area. However, the rainfall and runoff time series considered were limited to the period 1950–2000, so did not include series for the last decade (2001–2010). A recent study by Oyerinde et al. (Citation2014) showed good agreement between the hydro-climatic change for the period 1950–2010 and indigenous perceptions. Nevertheless, the study did not thoroughly analyse recent patterns in rainfall and runoff, and focused mainly on the municipality of Malanville and Lake Kainji, both located in the northern part of the study area.
The recommendation of Ozer et al. (Citation2003)––that data for 10 years (2001–2010) were necessary to verify the end of the great drought––is relevant for two reasons. The first rationale, as reported by a number of studies, is that West Africa is a region of high spatial and temporal rainfall variability (e.g. Katz and Glantz Citation1986, Adejuwon et al. Citation1990, Nicholson Citation2001, Lawin Citation2007). The second reason is that land-use change hampers the detectability of the end of the great drought. This is important as land-use change is known to act together with climate change to intensify the hydrological cycle (Giertz et al. Citation2005, Huntington Citation2006, Descroix et al. Citation2009). In fact, as a result of population growth, human pressure on land cover in West Africa has led to significant land-use change (Vissin Citation2007, Amogu et al. Citation2010). The demand for agricultural “cotton-land” in northern Benin, for example, has increased from 49 813 ha in 1990 to 205 675 ha in 2013, implying an annual demand of 6494 ha (CeRPA Borgou-Alibori Citation2014).
Inspired by the recommendations of Ozer et al. (Citation2003), the key objective of this study is to investigate the post-1970 hydro-climatic change in four non-Sahelian tributaries of the Niger River located in Benin. In order to have a comprehensive understanding of the environmental change, the analyses are not based solely on rainfall and runoff time series, but also include temperature, sunshine duration, potential evapotranspiration and near-surface wind speed.
2 Materials and methods
2.1 Study area
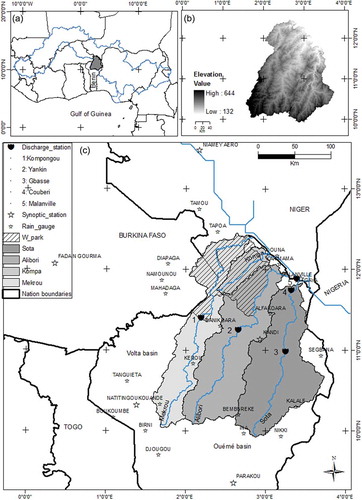
The study area is made up of four tributaries of the Niger River Basin located in the Sudanian zone of West Africa. These are Mekrou (10 552 km2), Alibori (13 684 km2), Sota (13 449 km2) and Kompa-Gorou (2041 km2). Ninety-five percent of the area of these basins is located in the Republic of Benin and situated between 1°50ʹ–3°75ʹW longitude and 10°0ʹ–12°30ʹN latitude (see ). With a unimodal rainfall regime, the mean annual rainfall of the area for the period 1970–2010 is about 936 mm. The mean minimum and maximum temperatures are 21.5 and 34.6°C, respectively. The research area is home to more than 1.5 million people (INSAE Citation2015). It is the largest zone for cotton and vegetable production, as well as cattle breeding, in Benin. In addition, it contains the W- Park, which is one of the most important West African wildlife parks.
Figure 1. (a) Location of the study area in West Africa within the Niger River Basin; (b) DEM and (c) overview over the four tributaries.
2.2 Data sources
As shown in , data were collected from various sources. Apart from potential evapotranspiration, which was computed using the Penman-Monteith formula (Monteith Citation1965), the other data are historical observed measurements.
Table 1. Summary of the data collected for the study. DMN: Direction Météorologique Nationale; DGEau: Direction Générale de l’Eau of Benin.
2.3 Data quality control
Data quality control was conducted for all variables with an emphasis on the rainfall and runoff time series. For each station, years with 5–10% of missing data within the rainy season (July–September) and those with more than 10% of records missing, regardless of the season, were excluded ().
Table 2. Quality check of rainfall and runoff data. + and * indicate that the period considered is 1976–2010 or 1981–2010, respectively; otherwise, the period is assumed to be 1970–2010.
For runoff, hydrographs were built from the observed data and periods of non-negligible flow determined. Mean runoff of a given month is arbitrarily deemed negligible if it is less than 25% of the mean monthly discharge of the entire period. Records with more than one month of missing data within the period of non-negligible flow were excluded. Thus, the range of “good” runoff data was not homogeneous across stations (see ) and the gaps were mainly noticeable during the period 1993–2002.This is due to delays between the breakdown of gauging instruments and their repair or replacement (DG-Eau Citation2008).
2.4 Data analysis
2.4.1 Post-1970 rainfall trend
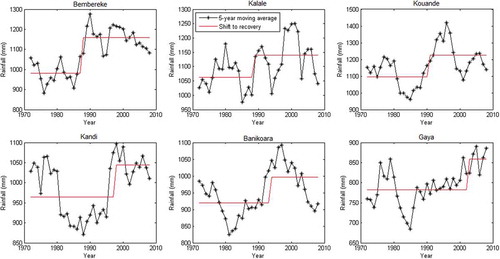
In order to capture the recent trend in rainfall, a 5-year moving average of mean annual rainfall was plotted. A 5-year moving average was preferred to a 1-year average because of the high inter-annual rainfall variability in the region.
In addition, two common non-parametric trend detection tests were applied. These are the Mann-Kendall test (Mann Citation1945, Kendall Citation1975) and the Theil-Sen slope estimator (Theil Citation1950, Sen Citation1968). The two tests have been described in detail by several authors (e.g. Kahya and Kalaycı Citation2004, Dinpashoh et al. Citation2011, Tabari et al. Citation2011) and are often used in studies investigating trends in hydro-climatic time series (e.g. Dinpashoh et al. Citation2011, Oguntunde et al. Citation2011, Citation2012, Tabari et al. Citation2011, Hounkpè et al. Citation2015). We used the R-package Kendall version 2.2 (McLeod Citation2014) to implement the Mann-Kendall test for our dataset, while a web-based application developed by Vannest et al. (Citation2011) was used in the case of the Theil-Sen slope estimator.
2.4.2 Breakpoint analysis of rainfall and runoff
The breakpoint analysis pursues two goals: to identify the number of breaks within a dataset, and then to determine the location of the detected breaks. Breakpoint detection in hydro-climatology helps identify regime shifts (i.e. a shift from a dry period to a humid one and vice versa). While there are different methods to detect breakpoints in hydro-climatic data, in this study the cross-entropy method (CE) (Priyadarshana and Sofronov Citation2015) embedded in the R-software was selected. The CE is based on a stochastic optimization technique and was originally developed to estimate the number and the position of breakpoints in continuous biological data. Priyadarshana and Sofronov (Citation2015) define it as an “exact search method” capable of identifying no breakpoint or the maximum number of breakpoints specified by the user. Details on the assumptions, the algorithm, and the strengths and weaknesses of the method are fully discussed in Priyadarshana and Sofronov (Citation2015), who reported that, except for a processing time, CE either performs similarly to or outperforms other competitive methods in determining the location of breakpoints.
In a previous study (not shown here) CE was compared to the Pettitt test (Pettitt Citation1979), the Bayesian approach of Lee and Heghinian (Citation1977) and Hubert’s segmentation (Hubert et al. Citation1989) for 17 rainfall stations located in and around the Benin part of the Niger River Basin. The Pettitt and Lee and Heghinian tests provided only one breakpoint whatever the length and variability in the data. However, Hubert’s segmentation yielded multiple breaks, though within a time series even just one extreme value could result as a break (Ardoin et al. Citation2003). The CE provides multiple breakpoints and offers the possibility to choose the number of breaks desired. Also, CE replicated 78%, 78% and 100% of the breaks detected by the Lee and Heghinian, Pettitt and Hubert approaches, respectively. In contrast, the likelihood of the Lee and Heghinian, Pettitt and Hubert tests to replicate a break detected by the CE was 52%, 16% and 28%, respectively. Thus, the CE was the most robust of the tests considered and was preferred for investigating the breakpoints in rainfall and runoff time series.
Determination of the breakpoints in rainfall data was first done for individual raingauges using the CE technique. We then deduced the breakpoint of the entire study area by applying the t-test at the 5% significance level. As a result of the gap in the runoff record for the years 1993–2002, breakpoint detection in the runoff time series was done in two stages. Firstly, the first and second breakpoints of each hydrometric station were determined. Then, the two corresponding breakpoints for the research area were computed using the t-test at 5% significance level. Note that, because of the gaps in the runoff time series, a second break was necessary in order to increase the chance of capturing the “true” year of break. Actually, limiting the analysis to only one break could be misleading given the poor quality of the runoff time series.
2.4.3 Correlation of the rainfall–runoff relationship
The mean annual catchment precipitation was computed using the Thiessen polygon method (Thiessen Citation1911). The rainfall–runoff correlation was investigated by computing Spearman’s rank coefficients (Spearman Citation1904) for Kompongou, Yankin, Gbasse and Couberi. The Spearman test measures the strength of the monotonic relationship between paired variables and was chosen because of its non-parametric character. Malanville was not included because the Niger River at this outlet covers 1 000 000 km2 and access to rainfall data for this large area was problematic.
Furthermore, we investigated the lag between the two variables in order to detect whether an increase (decrease) in runoff is preceded by an increase (decrease) in rainfall. To this end, we performed a cross-correlation analysis. For a sample of N pairs of two variables (xt, yt), the cross-correlation function (ccf) is computed in two steps. Firstly, the sample cross-covariance function (ccvf) was calculated, as described in Chatfield (Citation2004):
where N is the length of the data, and
are the means of xt and yt, and k is the lag.
Secondly, the sample ccvf was scaled by the variances of the two variables to obtain the sample ccf as given by:
where and
are the variances of xt and yt.
As recommended by Chatfield (Citation2004), the data were pre-whitened before the cross-correlation analysis because the result of a cross-correlation analysis might be biased if the individual time series are autocorrelated. To avoid such uncertainty, data should be pre-whitened before estimating their sample ccf. We used the R-package time series analysis (Chan and Ripley Citation2015) version 1.01 both for pre-whitening the data and for computing sample ccf.
2.4.4 Other climate variables
The other variables investigated were temperature (minimum, maximum and their difference), sunshine duration, potential evapotranspiration and near-surface wind speed. We also evaluated the long-term trends of these variables by applying the Mann-Kendall test and the Theil-Sen slope estimator method, as described in Section 2.4.1. The gradient of each variable was taken as equal to the slope given by the Theil-Sen test. Prior to the application of the two statistical tests, for each year, the absolute values of minimum and maximum temperatures were extracted and the average values computed. Likewise, annual totals were calculated for sunshine duration and potential evapotranspiration, whereas annual mean daily values were computed for near-surface wind speed.
3 Results and discussion
3.1 Post-1970 rainfall trend
As shown in , an increase in rainfall was observed for 26 of the 27 raingauges, with Boukoumbe the only station where a statistically non-significant decreasing trend was noted. We believe this might be due to the high percentage of missing data (i.e. 49%, see ) in the record. displays the post-1970 rainfall trend of selected stations and a mixed pattern is observed. For some gauges in the south (e.g. Bembereke and Kouande), an increasing trend is evident, whereas for certain gauges located in the centre (Kandi and Banikoara), it is less evident. The mixed pattern observed in the study area is in line with the high spatial rainfall variability of the region (e.g. Adejuwon et al. Citation1990, Omotosho Citation2008), Also from and as reported in earlier studies (Omotosho Citation2008, Lebel and Ali Citation2009, Yabi and Afouda Citation2012), the 1990s decade corresponds to the wettest period since 1970 for almost all the stations of the Benin part of the Niger River Basin.
Table 3. Mann-Kendall trend, Theil-Sen slope and year of break in rainfall data. Raingauges are ordered from the south to the north of the study area. + means increasing trend, – signifies decreasing trend.
Figure 2. Post-1970 trends in rainfall data. The year of shift corresponds to the year of break as shown in Section 3.2. Bembereke, Kalalé and Kouande are located in the south of the area, Kandi and Banikoara in the centre and Gaya in the north.
3.2 Breakpoint analysis of rainfall and runoff
The results of breakpoint analyses at individual raingauges are given in . For example, at Parakou (south), Kandi (centre) and Niamey (north), the break years are 1988, 1998 and 1989, respectively, which gives two sub-periods for each station: 1970–1987 and 1988–2010 in the case of Parakou, 1970–1997 and 1998–2010 at Kandi, and 1970–1988 and 1989–2010 at Niamey.
Application of the t-test resulted, for the entire area, in a break around 1992 ± 2.5 years. In the southern part of the region (Bembereke, Birni, Boukoumbe, Ina, Kalale, Kouande, Nikki, Parakou and Tanguieta, for which the mean annual rainfall of 1970–2010 was greater than 1050 mm), the break occurred around 1989. The shift in the central zone of the region (Kerou, Segbana, Kandi, Banikoara and Alfakoara, for which the mean annual rainfall of the period 1970–2010 is between 900 and 1050 mm) took place around 1993. For the raingauges of Diapaga, Namounou, Mahadaga, Ouna, Fada N’gourma, Tamou, Tapoa and Niamey, located in the north of the region and for which the mean annual rainfall of 1970–2010 was less than 900 mm, 1989 was detected as the breakpoint. The raingauges of Natitingou and Djougou (south of the area) and Malanville and Gaya (north of the area) showed breaks in 2002. For these four raingauges the shift occurred 10 years after 1992 (i.e. average year of the break in the study area). Similar results were found by Ozer et al. (Citation2003) in the Sahel. Ozer et al. (Citation2003) noticed a lag of 12 years between the “beginning of the drought” and its “statistical identification” for some stations of the Sahel.
displays the two breakpoints in the runoff data. For the entire area, the application of the t-test resulted in 1979 ± 6.9 and 1991 ± 5.4 years for Break 1 and Break 2, respectively. The year of Break 1 reflects the period of significant low flow observed in most of the West African rivers (Vissin Citation2007, Descroix et al. Citation2009, Mahé Citation2009, Amoussou et al. Citation2012) during the drought of the 1980s. As for the second break (1991), it almost perfectly matches the year of the break in rainfall data (1992). This finding suggests that a shift to wetter conditions undoubtedly occurred in the research area in the early 1990s.
Table 4. Year of break in runoff time series. Years marked in bold show the most important breaks, in the sense that, if one wishes to consider a break, these years should be considered.
On the basis of the year of break found for the rainfall time series (i.e. 1992), we compared the hydrograph of the sub-period 1970–1992 to that of 1993–2010 () to observe the change that occurred in the runoff time series. We chose the year of break detected in rainfall data as the “reference” because of the better quality of the rainfall time series, making the result from the rainfall series more reliable. From , it can be seen that the recovery is noticeable for all outlets except at Malanville.
Figure 3. Comparison of monthly runoff of the two sub-periods (1970–1992 and 1993–2010) based on the break in rainfall data of 1992. The range of “good” runoff data is not homogeneous from one station to the next.
Unlike the other stations, at Malanville two peaks are recorded. The first peak matches those of the other stations and is due to the contribution of the closest tributaries (i.e. Mekrou and Alibori, Fig. 1) to the flow at Malanville. As explained by Le Barbé et al. (Citation1993), the second peak is the result of the water coming from the farthest tributaries located in the western Sahel. At Malanville, the shift to wetter conditions can be observed for the June–October flows but not for the November–March flows. It is interesting to note that the June–October seasonal flow at Malanville corresponds to the period of high discharge at the other runoff stations (Gbasse, Couberi, Yankin and Kompongou). However, for the November–March seasonal flow, the limb of the hydrograph of 1970–1992 is only slightly higher than that of 1993–2010. Hence, gives us a clear but contrasting picture: the recovery is observed for the flows of June–October (i.e. for our research area) but the drought still prevails for the flows of November–March (i.e. for the western Sahel). These results signify that, until 2010, the drought was still noticeable in the western Sahel. The recovery observed in our research area is supported by the work of Amoussou et al. (Citation2012), who studied the hydro-climatology of the Mono-Couffo region (southeastern Benin) for the period 1961–2000 and found that the climate had shifted slightly to wetter conditions since 1990. Another study (Hounkpè et al. Citation2016) over a nearby catchment, the Ouémé River basin, reported that the majority of the stations displayed a statistically significant positive change over the period 1921–2012 for heavy rainfall, and we know that an increase in the number of extreme rain events implies an increase in total annual rainfall (Panthou et al. Citation2014, Hounkpè et al. Citation2016). Likewise, Lebel and Ali (Citation2009) and Omotosho (Citation2008) reported the recovery in the eastern Sahel, based on a station at Kano in northern Nigeria. Notwithstanding this, in a very recent study, Descroix et al. (Citation2015) found that the shift to normal rainfall conditions is now real in Senegambia and in the Middle Niger River Basin (both located in the western Sahel), although it should be noted that the dataset used in that study includes the period 2011–2013, unlike our case, where the time series end in 2010. In addition, Descroix et al. (Citation2015) found that the shift to normal rainfall conditions occurred around 1999, instead of the early 1990s as observed in our research area and in the eastern Sahel. Hence, the end of the drought occurred in Senegambia and in the Middle Niger River Basin nearly 7 years after its occurrence in our research area. This finding of Descroix et al. (Citation2015) supports the conclusion of Ozer et al. (Citation2003) that a 10-year period is necessary to verify the end of the great drought for certain regions of the West African subcontinent.
3.3 Correlation of the rainfall–runoff relationship
The correlation between two variables is either very weak, weak, moderate, strong or very strong for a Spearman rank coefficient, rs, in the ranges 0.00–0.19, 0.20–0.39, 0.40–0.59, 0.60–0.79 or 0.80–1.00, respectively. As can be seen in , the Spearman rank coefficient of the rainfall–runoff correlation was moderate to strong for all catchments, with the exception of Gbasse. These results suggest that large values of runoff are associated with large values of rainfall at the outlets of Kompongou, Yankin and Couberi. The poor quality of runoff time series at Gbasse (see ) probably does not allow for proper capture of the rainfall–runoff correlation.
Table 5. Spearman rank coefficients (rs) of rainfall–runoff correlation and the corresponding p-values.
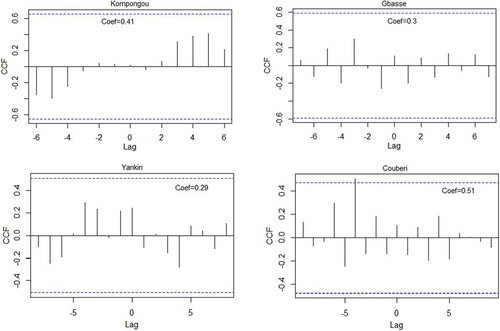
The results of the cross-correlation analyses are presented in . Only the Couberi station showed a statistically significant (5%) positive sample ccf for a lag of –4. Gbasse, Yankin and Kompongou stations exhibited insignificant positive sample ccf at lags of –3, –4 and +5, respectively. The positive sample ccf obtained for all the stations signifies that rainfall and runoff are positively correlated, and this confirms the results of Spearman’s rank test. The lags of –3 at Gbasse station and –4 at Couberi and Yankin stations imply that an increase in runoff time series occurs after a 3–4-year period of rainfall increase. From a statistical viewpoint, the lag of +5 at Kompongou station means that runoff leads rainfall, which is physically untrue. As mentioned for the Spearman rank test, the quality of the data might justify the result obtained at Kompongou station. The results for Couberi, Gbasse and Yankin, however, denote that 3–4 years are needed to fill natural reservoirs before an increase in runoff can be observed.
Figure 4. Graphs of the cross-correlation function between rainfall and runoff for Kompongou, Yankin, Gbasse and Couberi stations. Coef. denotes the cross-correlation function coefficient. The horizontal (blue) lines represent the lower and upper 95% confidence level for the significance of the ccf.
The quasi-concomitant increase of rainfall and runoff observed here has also been noticed in a nearby region, the Mono-Couffo River (Amoussou et al. Citation2012). Now the question to consider is whether the observed increase in runoff is due to climatic or land-use change. However, this question is beyond the scope of the present study. The conclusions from previous studies on the question (e.g. Descroix et al. Citation2012, Mahé et al. Citation2013, Panthou et al. Citation2013, Citation2014) can be summarized as follows: in the context of reduction of soil retention capacity (due to land degradation), an increase in runoff is due to an increase in total annual rainfall, which is itself due to an increase in the number of heavy rain events. We also refer the reader to Aich et al. (Citation2015), who reported that rainfall and land use contribute equally to floods in the Sirba catchment, and Casse and Gosset (Citation2015), who showed that rainfall is the dominant driver of the recent floods recorded in Niamey.
3.4 Other climate variables
3.4.1 Temperature
Statistically significant increases of absolute maximum temperature (Tmax), mean minimum temperature (Tmin*) and mean maximum temperature (Tmax*) were recorded for all the investigated stations. Likewise, a significant increase of absolute minimum temperature (Tmin) was observed for all the stations with the exception of Natitingou, where a non-significant decreasing trend was noted (see ). The increase in Tmin and Tmax, for instance, reached 0.04–0.08 and 0.02–0.04°C year-1, respectively. Columns 4 and 7 of also depict a decreasing trend in the difference between maximum and minimum temperatures (ΔT) for five of the six stations for both absolute and mean temperatures. This indicates that the minimum temperatures are increasing faster than the maximum temperatures (see also column 5 of ). Hence, not only have the maximum temperatures increased, but higher minimum temperatures were recorded during the last four decades. Our results are in agreement with previous studies, which investigated trends in temperature time series. New et al. (Citation2006) evaluated the trends in daily climate extremes of 14 southern and western African countries, including Nigeria, for the period 1961–2000. They found that minimum and maximum temperatures exhibited statistically significant warming patterns. Furthermore, in a study focusing on the climate of the tropical rainforest regions encompassing some zones of the Republic of Benin, Malhi and Wright (Citation2004) noted that since the mid-1970s mean temperature has increased at the rate of 0.26 ± 0.05°C per decade. In addition, Sultan et al. (2015), cited by Descroix et al. (Citation2015), documented the warming climate observed in several West African countries (e.g. Burkina Faso, Niger, Senegal, etc.) since the 1950s. Tao et al. (Citation2014) drew similar conclusion to ours for the climate of the Poyang Lake Basin in China. Our results are also supported by the conclusions of Working Group I of the Intergovernmental Panel on Climate Change (IPCC Citation2013) that, since 1850, the last three decades have been successively warmer.
Table 6. Mann-Kendall trend and Theil-Sen slope for absolute minimum (Tmin) and absolute maximum (Tmax) temperatures, their difference (ΔT = Tmax – Tmin), mean minimum (Tmin*) and mean maximum (Tmax*) temperatures, and their difference (ΔṪ* = Tmax* – Tmin*) during the period 1970–2010. + and – signify increasing trend and decreasing trend, respectively.
3.4.2 Sunshine duration, wind speed and potential evapotranspiration
As depicted in (columns 2 and 5), a significant decreasing trend of annual sunshine hours (SD) was observed. It was only at Parakou station (south of the study area) that a non-significant decreasing trend was recorded. Furthermore, we notice that the rate of decrease of SD was not latitude dependent. Actually, the highest gradient was recorded at Kandi station located in the centre of the research area. Also, SD decreased faster at Niamey station than at Natitingou, although the latter is 3.2° (nearly 350 km) north of the former (, ). In comparison with earlier studies, Liao et al. (Citation2007) and Stanhill and Cohen (Citation2005) noted a similar decrease of sunshine duration in Tibet (China) for the period 1971–2005 and in the USA for 1950–1987, respectively. More interestingly, the decrease in sunshine duration in the research area is concomitant with the increase in rainfall mentioned in Sections 3.1 and 3.2. Such a negative correlation (decrease in sunshine duration in a context of increased rainfall) was also observed by Stanhill and Cohen (Citation2005) in the USA during the 1910s, 1950s and 1970s.
Table 7. Mann-Kendall trend and Theil-Sen slope for annual sunshine duration (SD), annual potential evapotranspiration (PET), and daily wind speed (WS) for 1970–2010. + and – denote increasing trend and decreasing trend, respectively. Stations are ordered from the south to the north of the research area.
The results of trend detection in near-surface wind speed are displayed in (columns 3 and 6). Wind speed exhibited a negative trend for the majority of the stations (two-thirds of the stations depicted a negative trend, while one-third indicated a positive trend). The negative trend of wind speed during the last decades seems to be a global phenomenon (McVicar et al. Citation2012) and is even termed “stilling” (Roderick et al. Citation2007). Numerous works have documented a decreasing wind speed trend across the five continents (e.g. Xu et al. Citation2006, Roderick et al. Citation2007, McVicar et al. Citation2008, Brazdil et al. Citation2009, Vautard et al. Citation2010, Wan et al. Citation2010, Wever Citation2012, Knorr Citation2013). In a recent review of 148 studies, including 21 related to Africa, McVicar et al. (Citation2012) noted that, for West Africa as a whole, the decreasing wind speed trend is predominant. Likewise, Michels et al. (1999) cited by McVicar et al. Citation2012), O’Higgins (Citation2007) and Oguntunde et al. (Citation2011) reported negative trends for the stations of Sadoré (Niger), Manga (Ghana) and Ibadan (Nigeria), respectively. The work of Ogolo (Citation2011), however, contradicts our results and the studies cited here; finding an overall positive trend of wind speed for a sample of 21 sites located in Nigeria.
The results concerning potential evapotranspiration (PET) are shown in columns 4 and 7 of . Although, on average, PET decreased at a rate of 0.9 mm year-1, we did not observe a common trend. While half of the stations displayed an increasing trend, the other half showed a decreasing trend. The decrease of PET on average recorded in the research is in agreement with the results of Oguntunde et al. (Citation2012) for the station of Ibadan (Nigeria) and McVicar et al. (Citation2012) at the global scale. Nevertheless, Oguntunde et al. (Citation2006) noticed that potential evaporation was still increasing from 1901 to 2002 over the Volta Basin.
In addition, it appears that stations displaying an increasing trend were unevenly distributed across the study area and that this applies also for stations with a decreasing trend. For example, an increasing trend was seen at Natitingou (south) and Gaya (north) stations, while Parakou (upper south) and Niamey (upper north) showed a decreasing trend. Wang et al. (Citation2012) also reported the absence of spatial coherence in the trends in reference evapotranspiration for 80 stations located in the Loess Plateau (China).
Previous studies investigating the causes of change in PET with respect to climatic factors reported that wind speed is the main driving factor for certain stations, whereas different variables (radiation, relative humidity, etc.) are predominant for other stations in the same research area. At Ibadan (southwestern Nigeria), Oguntunde et al. (Citation2012) reported that the variability in pan evaporation is partly due to radiation, wind speed and vapour pressure deficit. Within the Yellow River Basin (China), Wang et al. (Citation2012) showed that wind speed is the principal cause of change in reference ET in the west and north, whereas sunshine duration and temperature are the dominant factors in the middle–lower Yellow River Plain and the source area of the Yellow River Basin, respectively. In the Qinghai–Tibetan Plateau, Zhang et al. (Citation2009) found that the predominant cause of change in reference evapotranspiration in the north is wind speed, but it is radiation in the southeast. At the global scale, wind speed has been found to be the dominant climatic factor influencing PET (McVicar et al. Citation2012).
4 Conclusions
In this study, we have documented the recent hydro-climatic change of four non-Sahelian tributaries of the Niger River Basin. We found that runoff and rainfall showed a post-1970 increase, but sunshine duration exhibited a significant negative trend. Despite the poor quality of runoff time series, the rainfall–runoff correlation was statistically significant and moderate to strong (0.57–0.66) for three of the four investigated catchments, and the breaks in rainfall and runoff data were nearly consistent. Significant lower runoff was observed around 1979 followed by a regime shift around 1991. The shift to wetter conditions, based on rainfall time series, occurred around 1992. Thus, we conclude that, in the study area, the great drought of the 1970s and 1980s ended in 1992. A yearly increase in temperature of 0.02–0.05°C was recorded over the last four decades, and the minimum temperature increased by nearly twice as much as the maximum temperature. As indicated by the negative trend shown by most of the stations, near-surface wind speed is “stilling”. Half of the stations exhibited an increasing trend for potential evapotranspiration, while the remainder showed a decreasing trend. Apart from rainfall, we did not detect particular spatial patterns for the other climate variables investigated.
Knowledge of the shift in the climate to wetter conditions is useful for stakeholders involved in agriculture and other water-related sectors. Indeed, more water storage will be required to meet the current growing water demand resulting from population growth and global warming. Beyond the framework of statistical hydrology, the update of the climatic information presented here could also be useful in hydrological modelling by assisting the choice of calibration and validation periods.
Acknowledgements
The authors are grateful to the German Ministry of Education and Research (BMBF), the West African Science Service Centre on Climate Change and Adapted Land Use (WASCAL), the Graduate Research Programme “Climate Change and Water Resources” of the University of Abomey-Calavi and the Council for Scientific and Industrial Research (CSIR). The institutes that provided climate and runoff data are also acknowledged: the Agence pour la Sécurité de la Navigation Aérienne en Afrique et à Madagascar (ASECNA) of Benin, Burkina Faso and Niger, the Centre Régional pour la Promotion Agricole (CeRPA) and the Direction Générale de l’Eau (DGEau). Finally, the authors are very thankful to the two reviewers and the Associate Editor (Dr Julian Thompson), whose comments helped to improve the original manuscript.
Disclosure statement
No potential conflict of interest was reported by the authors.
References
- Adejuwon, J.O., Balogun, E.E., and Adejuwon, S.A., 1990. On the annual and seasonal patterns of rainfall fluctuations in sub-Saharan West Africa. International Journal of Climatology, 10, 839–848. doi:10.1002/(ISSN)1097-0088
- Aich, V., et al., 2015. Climate or land use?—attribution of changes in river flooding in the Sahel Zone. Water, 7, 2796–2820. doi:10.3390/w7062796
- Ali, A. and Lebel, T., 2009. The Sahelian standardized rainfall index revisited. International Journal of Climatology, 29, 1705–1714. doi:10.1002/joc.v29:12
- Amogu, O., et al., 2010. Increasing river flows in the Sahel? Water, 2, 170–199. doi:10.3390/w2020170
- Amoussou, E., Camberlin, P., and Mahé, G., 2012. Impact de la variabilité climatique et du barrage Nangbéto sur l ’hydrologie du système Mono-Couffo (Afrique de l’Ouest). Hydrological Sciences Journal, 57, 805–817. doi:10.1080/02626667.2011.643799
- Andersen, I., et al., 2005. The Niger Basin: a vision for sustainable management. Washington, DC: The World Bank – Directions in development.
- Ardoin, S., et al., 2003. Analyse de la persistance de la sécheresse en Afrique de l’ouest: caractérisation de la situation de la décennie 1990. In: Hydrology of the Mediterranean and Semiarid Regions (Proceedings of an international symposium held at Montpellier. April 2003). IAHS Publ. no. 278. 223–228.
- Brázdil, R., et al., 2009. Climate fluctuations in the Czech Republic during the period 1961 – 2005. International Journal of Climatology, 29, 223–242. doi:10.1002/joc.v29:2
- Casse, C. and Gosset, M., 2015. Analysis of hydrological changes and flood increase in Niamey based on the PERSIANN-CDR satellite rainfall estimate and hydrological simulations over the 1983–2013 period. Changes in Flood Risk and Perception in Catchments and Cities. Proc. IAHS, 370, 117–123.
- CeRPA Borgou-Alibori, 2014. Centre Régional pour la Promotion Agricole de Parakou. Evolution des statistiques de production cotonnière sur les 24 dernières campagnes agricoles (1989-1990 à 2012-2013). Parakou, Bénin.
- Chan, K.S. and Ripley, B., 2015. Chan K-S, Ripley B. Package ‘TSA’: Time series analysis. CRAN. https://cran.r-project.org/web/packages/TSA/TSA.pdf
- Chatfield, C., 2004. The Analysis of Time series, an introduction. 6th ed. New York: Chapman & Hall/CRC.
- Dardel, C., et al., 2014a. Rain-use-efficiency: what it tells us about the conflicting Sahel greening and Sahelian paradox. Remote Sensing, 6, 3446–3474. doi:10.3390/rs6043446
- Dardel, C., et al., 2014b. Re-greening Sahel: 30 years of remote sensing data and field observations (Mali, Niger). Remote Sensing of Environment, 140, 350–364. doi:10.1016/j.rse.2013.09.011
- Descroix, L., et al., 2012. Change in Sahelian Rivers hydrograph: the case of recent red floods of the Niger River in the Niamey Region. Global Planetary Change, 98-99, 18–30. doi:10.1016/j.gloplacha.2012.07.009
- Descroix, L., et al., 2009. Spatio-temporal variability of hydrological regimes around the boundaries between Sahelian and Sudanian areas of West Africa: a synthesis. Journal of Hydrology, 375, 90–102. doi:10.1016/j.jhydrol.2008.12.012
- Descroix, L., et al., 2015. Evolution récente de la pluviométrie en Afrique de l’Ouest à travers deux régions: la Sénégambie et le Bassin du Niger Moyen. Climatologie, 12, 25–43.
- DG-Eau, 2008. Direction Générale de l’Eau. Annales Hydrologiques des Années 2003 à 2007. Available from: http://www.eaubenin.bj/docs/Presentation_SH/ANNALES.pdf [Accessed 12 June 2013].
- Dinpashoh, Y., et al., 2011. Trends in reference crop evapotranspiration over Iran. Journal of Hydrology, 399, 422–433. doi:10.1016/j.jhydrol.2011.01.021
- Giertz, S., Junge, B., and Diekkrüger, B., 2005. Assessing the effects of land use change on soil physical properties and hydrological processes in the sub-humid tropical environment of West Africa. Physics and Chemistry of the Earth, Parts A/B/C, 30, 485–496. doi:10.1016/j.pce.2005.07.003
- Goula, B., et al., 2007. Estimation des pluies exceptionnelles journalières en zone tropicale: cas de la Côte d’Ivoire par comparaison des lois lognormale et de Gumbel. Hydrological Sciences Journal, 52 (1), 49–67. doi:10.1623/hysj.52.1.49
- Hounkpè, J., et al., 2015. Non-stationary flood frequency analysis in the Ouémé River Basin, Benin Republic. Hydrology, 2, 210–229. doi:10.3390/hydrology2040210
- Hounkpè, J., et al., 2016. Change in heavy rainfall characteristics over the Ouémé River Basin, Benin Republic, West Africa. Climate, 4 (1), 1–23. doi:10.3390/cli4010015
- Hubert, P., Carbonnel, J.P., and Chaouche, A., 1989. Segmentation des séries hydrométéorologiques. Application à des séries de précipitations et de débits de Afrique de l’Ouest. Journal of Hydrology, 110, 349–367. doi:10.1016/0022-1694(89)90197-2
- Huntington, T.G., 2006. Evidence for intensification of the global water cycle: review and synthesis. Journal of Hydrology, 319, 83–95. doi:10.1016/j.jhydrol.2005.07.003
- INSAE, 2015. Institut National de Statistiques et de l’Analyse Economique. RGPH4: Que retenir des effectifs de population en 2013? Available from: http://www.insae-bj.org/population.html [Accessed 30 September 2015].
- IPCC, 2013. Summary for Policymakers. In: T.F. Stocker, et al., eds. Climate change 2013: the physical science basis. Contribution of Working Group I to the Fifth Assessment Report of the Intergovernmental Panel on Climate Change. Cambridge: Cambridge University Press, 1–28.
- Kahya, E. and Kalaycı, S., 2004. Trend analysis of streamflow in Turkey. Journal of Hydrology, 289, 128–144. doi:10.1016/j.jhydrol.2003.11.006
- Kasei, R., Diekkrüger, B., and Leemhuis, C., 2010. Drought frequency in the Volta basin of West Africa. Sustainability Science, 5, 89–97. doi:10.1007/s11625-009-0101-5
- Katz, R.W. and Glantz, M.H., 1986. Anatomy of a rainfall index. Monthly Weather Review, 114, 764–771. doi:10.1175/1520-0493(1986)114<0764:AOARI>2.0.CO;2
- Kendall, M.G., 1975. Rank correlation methods. 4th ed. London: Charles Griffin.
- Knorr, K.I., 2013. Distribution, variability, and trends in wind characteristics in New England coastal areas. Thesis (Master). University of Rhode Island. http://digitalcommons.uri.edu/cgi/viewcontent.cgi?article=1027&context=theses
- L’Hôte, Y., Mahé, G., and Some, B., 2003. The 1990s rainfall in the Sahel: the third driest decade since the beginning of the century. Hydrological Sciences Journal, 48, 493–496. doi:10.1623/hysj.48.3.493.45283
- L’Hôte, Y., et al., 2002. Analysis of a Sahelian annual rainfall index from 1896 to 2000; the drought continues. Hydrological Sciences Journal, 47, 563–572. doi:10.1080/02626660209492960
- Lawin, A.E., 2007. Analyse climatologique et statistique du régime pluviométrique de la haute vallée de l’Ouémé à partir des données pluviographiques AMMA-CATCH Bénin. Thesis (PhD). Institut National Polytechnique de Grenoble & Université d’Abomey-Calavi.
- Le Barbé, L., et al., 1993. Les ressources en eaux superficielles de la République du Bénin. Paris: Orstom.
- Le Barbé, L. and Lebel, T., 1997. Rainfall climatology of the HAPEX-Sahel region during the years 1950–1990. Journal of Hydrology, 188-189, 43–73. doi:10.1016/S0022-1694(96)03154-X
- Lebel, T. and Ali, A., 2009. Recent trends in the Central and Western Sahel rainfall regime (1990-2007). Journal of Hydrology, 375, 52–64. doi:10.1016/j.jhydrol.2008.11.030
- Lebel, T., et al., 2009. AMMA-CATCH studies in the Sahelian region of West-Africa: an overview. Journal of Hydrology, 375, 1–34. doi:10.1016/j.jhydrol.2009.03.020
- Lebel, T., Taupin, J.D., and D’Amato, N., 1997. Rainfall monitoring during HAPEX-Sahel. 1. General rainfall conditions and climatology. Journal of Hydrology, 188-189, 74–96. doi:10.1016/S0022-1694(96)03155-1
- Lee, A.F.S. and Heghinian, S.M., 1977. A shift of the mean level in a sequence of independent normal random variables: a Bayesian approach. Technometrics, 19 (4), 503–506.
- Liao, J., et al., 2007. Climatic change of sunshine duration and its influencing factors over Tibet during the last 35 years. Acta Geographica Sinica, 62, 5.
- Mahé, G., 2009. Surface /groundwater interactions in the Bani and Nakambe rivers, tributaries of the Niger and Volta basins, West Africa. Hydrological Sciences Journal, 54 (4), 704–712. doi:10.1623/hysj.54.4.704
- Mahe, G., et al., 2013. The rivers of Africa: witness of climate change and human impact on the environment. Hydrological Processes, 27, 2105–2114. doi:10.1002/hyp.9813
- Mahé, G., et al., 2005. The impact of land use change on soil water holding capacity and river flow modelling in the Nakambe River, Burkina-Faso. Journal of Hydrology, 300, 33–43. doi:10.1016/j.jhydrol.2004.04.028
- Malhi, Y. and Wright, J., 2004. Spatial patterns and recent trends in the climate of tropical rainforest regions. Philosophical Transactions of the Royal Society of London B, 359, 311–329. doi:10.1098/rstb.2003.1433
- Mann, H.B., 1945. Non-parametric tests against trend. Econometrica, 13, 245–259. doi:10.2307/1907187
- McLeod, A.I., 2014. Package ‘Kendall’. Kendall rank correlation and Mann-Kendall trend test. https://cran.r-project.org/web/packages/Kendall/Kendall.pdf
- McVicar, T.R., et al., 2008. Wind speed climatology and trends for Australia, 1975 – 2006 : Capturing the stilling phenomenon and comparison with near-surface reanalysis output. Geophysical Research Letters, 35, L20403. doi:10.1029/2008GL035627
- McVicar, T.R., et al., 2012. Global review and synthesis of trends in observed terrestrial near-surface wind speeds : Implications for evaporation. Journal of Hydrology, 416-417, 182–205. doi:10.1016/j.jhydrol.2011.10.024
- Monteith, J.L., 1965. Evaporation and environment. In: The state and movement of water in living organisms. In: XIXth Symposium of the Society for Experimental Biology. Swansea: Cambridge University Press, 205–234.
- New, M., et al., 2006. Evidence of trends in daily climate extremes over southern and west Africa. Journal of Geophysical Research, 111, D14102. doi:10.1029/2005JD006289
- Nicholson, S.E., 2001. Climatic and environmental change in Africa during the last two centuries. Climate Research, 17, 123–144. doi:10.3354/cr017123
- O’Higgins, R.C., 2007. Savannah woodland degradation assessments in Ghana: integrating ecological indicators with local perceptions. Earth & Environment, 3, 246–281.
- Ogolo, E.O., 2011. Regional trend analysis of pan evaporation in Nigeria (1970 to 2000). Journal of Geography and Regional Planning, 4 (10), 566–577.
- Oguntunde, P.G., Abiodun, B.J., and Lischeid, G., 2011. Rainfall trends in Nigeria, 1901 – 2000. Journal of Hydrology, 411, 207–218. doi:10.1016/j.jhydrol.2011.09.037
- Oguntunde, P.G., et al., 2012. Trends and variability in pan evaporation and other climatic variables at Ibadan, Nigeria, 1973 – 2008. Meteorological Applications, 19, 464–472. doi:10.1002/met.281
- Oguntunde, P.G., et al., 2006. Hydroclimatology of the Volta River Basin in West Africa: trends and variability from 1901 to 2002. Physics and Chemistry of the Earth, 31, 1180–1188. doi:10.1016/j.pce.2006.02.062
- Omotosho, J.B., 2008. Pre-rainy season moisture build-up and storm precipitation delivery in the West African Sahel. International Journal of Climatology, 28, 937–946. doi:10.1002/(ISSN)1097-0088
- Oyerinde, G.T., et al., 2014. Hydro-climatic changes in the Niger basin and consistency of local perceptions. Regional Environmental Change, 15 (8), 1627–1637. doi:10.1007/s10113-014-0716-7
- Ozer, P., et al., 2003. The Sahelian drought may have ended during the 1990s. Hydrological Sciences Journal, 48 (3), 489–492. doi:10.1623/hysj.48.3.489.45285
- Panthou, G., Vischel, T., and Lebel, T., 2014. Recent trends in the regime of extreme rainfall in the Central Sahel. International Journal of Climatology, 34, 3998–4006. doi:10.1002/joc.2014.34.issue-15
- Panthou, G., et al., 2013. From pointwise testing to a regional vision: an integrated statistical approach to detect non stationarity in extreme daily rainfall. Application to the Sahelian region. Journal of Geophysical Research, 118 (15), 8222–8237.
- Paturel, J.E., et al., 1998. Analyse de séries pluviométriques de longue durée en Afrique de l’Ouest et Centrale non sahélienne dans un contexte de variabilité climatique. Hydrological Sciences Journal, 43, 937–946. doi:10.1080/02626669809492188
- Pettitt, A.N., 1979. A non-parametric approach to the change-point problem. Journal of Applied Statistics, 28 (2), 126–135. doi:10.2307/2346729
- Peugeot, C., et al., 2003. Hydrologic process simulation of a semiarid, endoreic catchment in Sahelian West Niger. 1. Model-aided data analysis and screening. Journal of Hydrology, 279, 224–243. doi:10.1016/S0022-1694(03)00181-1
- Priyadarshana, W.J.R.M. and Sofronov, G., 2015. Multiple breakpoints detection in array CGH data via the cross-entropy method. IEEE/ACM Transactions on Computational Biology and Bioinformatics, 12 (2), 487–498. doi:10.1109/TCBB.2014.2361639
- Roderick, M.L., et al., 2007. On the attribution of changing pan evaporation. Geophysical Research Letters, 34 (17), L17403. doi:10.1029/2007GL031166
- Séguis, L., et al., 2004. Simulated impacts of climate change and land-clearing on runoff from a small Sahelian catchment. Hydrological Processes, 18, 3401–3413. doi:10.1002/hyp.v18:17
- Sen, P.K., 1968. Estimates of the regression coefficient based on Kendall’s Tau. Journal of the American Statistical Association, 63, 1379–1389. doi:10.1080/01621459.1968.10480934
- Spearman, C., 1904. The proof and measurement of association between two things. The American Journal of Psychology, 15, 72–101. doi:10.2307/1412159
- Stanhill, G. and Cohen, S., 2005. Solar radiation changes in the United States during the twentieth century: evidence from sunshine duration measurements. American Meteorological Society, 18, 1503–1512.
- Tabari, H., et al., 2011. Trend analysis of reference evapotranspiration in the western half of Iran. Agricultural and Forest Meteorology, 151, 128–136. doi:10.1016/j.agrformet.2010.09.009
- Tao, H., et al., 2014. Trends in extreme temperature indices in the Poyang Lake Basin, China. Stochastic Environmental Research and Risk Assessment, 28 (6), 1543–1553. doi:10.1007/s00477-014-0863-x
- Theil, H., 1950. A rank invariant method of linear and polynomial regression analysis, part 3. In: Netherlands Akademie van Wettenschappen proceedings. 1397–1412.
- Thiessen, A.H., 1911. Precipitation averages for large areas. Monthly Weather Review, 39 (7), 1082–1084.
- Vannest, K.J., Parker, R.I., and Gonen, O., 2011. Single Case Research: web based calculators for SCR analysis [Web-based application]. Available from: http://www.singlecaseresearch.org [Accessed 7 April 2016].
- Vautard, R., et al., 2010. Northern Hemisphere atmospheric stilling partly attributed to an increase in surface roughness. Nature Geoscience, 3, 756–761. doi:10.1038/ngeo979
- Vissin, W.E., 2007. Impact de la variabilité climatique et de la dynamique des états de surface sur les écoulements du bassin béninois du fleuve Niger et de la dynamique des états de surface. Thesis (PhD). Universite de Bourgogne.
- Wan, H., Wang, X.L., and Swail, V.R., 2010. Homogenization and trend analysis of Canadian near-surface wind speeds. Journal of Climate, 23, 1209–1225. doi:10.1175/2009JCLI3200.1
- Wang, W., et al., 2012. Reference evapotranspiration change and the causes across the Yellow River basin during 1957–2008 and their spatial and seasonal differences. Water Resources Research, 48, 5. doi:10.1029/2011WR010724
- Wever, N., 2012. Quantifying trends in surface roughness and the effect on surface wind speed observations. Journal of Geophysical Research: Atmospheres, 117 (D11), D11104. doi:10.1029/2011JD017118
- Xu, M., et al., 2006. Steady decline of east Asian monsoon winds, 1969 – 2000 : evidence from direct ground measurements of wind speed. Journal of Geophysical Research, 111, D24111. doi:10.1029/2006JD007337
- Yabi, I. and Afouda, F., 2012. Extreme rainfall years in Benin (West Africa). Quaternary International, 262, 39–43. doi:10.1016/j.quaint.2010.12.010
- Zhang, X., et al., 2009. Spatial and temporal variation patterns of reference evapotranspiration across the Qinghai-Tibetan Plateau during 1971–2004. Journal of Geophysical Research: Atmospheres, 114, D15. doi:10.1029/2009JD011753