
 ?Mathematical formulae have been encoded as MathML and are displayed in this HTML version using MathJax in order to improve their display. Uncheck the box to turn MathJax off. This feature requires Javascript. Click on a formula to zoom.
ABSTRACT
Urbanization is a primary driver of nutrient export in coastal catchments; however, estimating the rate of export from urbanizing, remote and ungauged communities with episodic rainfall characteristics has rarely been reported in tropical and subtropical areas. In this study, the coastal catchment of Roebuck Bay near Broome, northwestern Australia, was instrumented to elucidate the effect of seasonal flushing on nutrient export. A cost-effective framework involving temporary gauging and community participation led to a quantitative estimate of surface hydrology and nutrient dynamics from this urbanizing, remote and ungauged catchment. The contribution of nutrient export was larger from the older Broome town site sub-catchments compared to sub-catchments that have been progressively urbanized since 2000. A distinctive seasonal first flush phenomenon, with an initial 30% of runoff volume containing 40–70% of the nutrient load was a key feature. This indicates there are opportunities for storm-water management to minimize impacts through adopting water-sensitive urban design principles.
Editor M.C. Acreman Associate editor M.D. Fidelibus
Introduction
Storm-water runoff from urbanizing catchments is the principal transport mechanism carrying natural and anthropogenically derived pollutants from non-point sources into receiving waters such as wetlands (Hall and Ellis Citation1985). Typically nutrient export from urbanizing catchments increases, leading to deterioration of water quality, blooms of nuisance algae and eutrophication of coastal wetland systems (Bowen and Valiela Citation2001, Bricker et al. Citation2008, Estrella Citation2013). Blooms of the marine cyanobacterium Lyngbya majuscula are increasingly being reported in tropical warmer waters in response to anthropogenically derived nutrients delivered to coastal wetlands in recent years (Ahern et al. Citation2007, Paerl et al. Citation2008). These blooms have been reported within Roebuck Bay, Broome, in northwestern Australia (Pearson et al. Citation2008), which is the receiving water body of the catchment under investigation in this study. A significant concern is the effect that nutrient enrichment and L. majuscula blooms may be having in the Roebuck Bay ecosystem, particularly given a large portion of the wetland was designated as a “wetland of international importance” under the Ramsar convention in 1990. For sound management of the Bay, a detailed understanding of the hydrological processes controlling water flow and nutrient export through the drains is required.
To date, a large body of research has been carried out to characterize surface runoff and nutrient export from catchments of differing urban characteristics in Australia (Deletic Citation1997, Goonetilleke et al. Citation2005), Asia (Ebise Citation1991, Lee and Bang Citation2000, Huang et al. Citation2007, Luo et al. Citation2009), Europe (Bertrand-Krajewski et al. Citation1998, Gnecco et al. Citation2005) and North America (Lee et al. Citation2004, Schiff and Tiefenthaler Citation2011). However, there is a paucity of information for tropical regions of the world, and no published accounts for northwestern Australia, which has a unique geomorphological and hydro-climatological context.
Despite the rapid rate of urbanization in Broome, water quality issues have not been a priority for management organizations and consequently the catchment remains ungauged. An ungauged catchment is one with poor records (in terms of both data quantity and quality) of hydrological observations to enable computation of hydrological variables of interest at the appropriate spatial and temporal scales, to the accuracy acceptable for practical applications (Sivapalan et al. Citation2003).
The problem of undertaking hydrological assessments in ungauged catchments is not new. Accurate and reliable hydrological predictions are important to local and regional communities who are increasingly being asked to make independent judgments about actions required to manage natural disasters, the natural environment and water resources in a sustainable manner (Lee and Bang Citation2000, Sivapalan et al. Citation2003). Whilst there is a growing body of literature on approaches for estimating hydrological dynamics in poorly and ungauged catchments (e.g. Sivapalan et al. Citation2003, McIntyre et al. Citation2005, Blöschl Citation2006, Blöschl et al. Citation2013), the problem of prediction of nutrient export from ungauged catchments remains as an area of limited work to date. Several open research questions remain, for example, understanding how rates of nutrient export vary seasonally and depend upon antecedent conditions, identifying how export is linked to the history of land-use development and the degree to which “water sensitive urban design” (WSUD) principles have been considered. Donofrio et al. (Citation2009) defined WSUD as an integrated water management system that encompasses low-impact design, water conservation and recycling, water quality management, and urban ecology.
The seasonal first flush occurs when a long dry period has allowed contaminants to build up and the initial rainfall events after the long dry period, at the onset of the wet season for example, may create runoff events with higher pollutant concentrations (and loads) relative to later events (Lee et al. Citation2004). In the Broome catchment, nutrient export is highly episodic; however, without monitoring data it has remained unclear how various sub-catchments with varying amounts of water-sensitive development are behaving, until now.
The objectives of this study were therefore to: (1) quantify the storm-water discharge and nutrient export from the Broome sub-catchments to Roebuck Bay; (2) understand the relationship between nutrient sources, nutrient loads, runoff volume and the seasonal first flush phenomenon; and (3) assess the results in terms of the effectiveness of varying degrees of WSUD that have been implemented in different sub-catchments. In order to quantify the surface hydrological and nutrient export characteristics, we approached the study by adopting a temporary gauging strategy. The relatively remote nature of the study site and the episodic rainfall–runoff events associated with monsoonal conditions presented logistical challenges in terms of gauging the catchment. The objectives of the study were therefore achieved through engagement of local indigenous community rangers and volunteers from community groups in a field campaign that included intensive storm-water sampling and water level gauging. The analysis framework provided herein demonstrates how priority areas for targeting nutrient management efforts can be identified in ungauged catchments, with a low-cost temporary monitoring programme.
Materials and methods
Study site description
Roebuck Bay is located south of the town of Broome, in northwestern Australia (18.1167°S, 122.2667°E). The area is one of the main wintering and “refuelling” stop-over areas for migratory shorebirds of the East Asia–Australasia fly way and one of the most important wetlands for migratory shorebirds on the Australian continent (Pearson et al. Citation2008, Estrella Citation2013). Roebuck Bay is characterized by a high tidal range (10 m on spring tides) (BOM Citation2012), and extensive mudflats. The importance of Roebuck Bay as a shorebird site appears to relate to the incredibly high diversity and biomass of benthic invertebrates in the intertidal flats, which places this tropical intertidal area among the richest mudflats in the world (Piersma et al. Citation1998). Apart from its ecological value, the site has great cultural importance for indigenous people and provides a range of essential ecosystem services for them (Curran and MacKenzie Citation2007). The Broome area’s soils are typically silty, clayey sand red-soil, locally known as Pindan (Emery et al. Citation2009), with typically gently sloping topography and occasional rocky cliffs or dune ridges at the coast. The area also experiences a distinct monsoonal climate; more than 90% of the region’s rainfall occurs during the wet season, heavily influenced by tropical cyclone activity (BOM Citation2012). These factors suggest that hydrological and nutrient export characteristics are also likely to be somewhat unique. Northwestern Australia is generally remote; however, Broome is a hotspot of urbanization supporting mining, tourism and oil and gas industries within the region.
Catchment and climate data
The urbanizing Broome catchment comprises 11 sub-catchments on the north shore of Roebuck Bay (). A 1-second (~30 m) digital elevation model (DEM) data from GeoScience, Australia, and ArcHydro hydrology modelling tools (Maidment Citation2002) were used to delineate the 11 topographic sub-catchments. The sub-catchments were divided into two main categories: Old Broome sub-catchments and Broome North. Demco (DMC), Town Beach (TB), Seaview shopping centre (SVS), Hamersley and Guy streets (HGS), Matsos (MTS), Magabala books (MBB) and Airport (APT) are the Old Broome sub-catchments, whilst Gubinge Road (GB), Roebuck Estate (RBE), V-notch weir (VN) and New town exit (NTE) are the Broome North sub-catchments ().
All Broome sub-catchments have a mixture of residential, public open space and commercial land uses. Parts of DMC, RBE and GB are relatively new residential areas progressively being developed since 2000. The VN and NTE sub-catchments are still under development for commercial and residential land uses. There are a number of wastewater disposal sites across the Old Broome sub-catchments, where public open space is irrigated with secondary treated wastewater. The four sub-catchments in Broome North have adapted WSUD principles within their storm-water drain network (SKM Citation2009). Land-use features for the catchment were mapped using existing aerial photos and ArcGIS 10 (ESRI Citation2011), refined with ground surveys. Total impervious area percentage of the catchment was measured directly from aerial photos by digitizing the boundaries of impervious surface areas (Brabec Citation2002).
Rainfall data with 1-min temporal resolution were obtained from the Bureau of Meteorology weather station 003003 located at Broome Airport (BOM Citation2013). These were used to calculate event rainfall depths, the antecedent dry period and rainfall intensity. Antecedent dry period was estimated as the number of dry days following a measurable rainfall event (>0.2 mm).
Water quantity measurement
The storm-water depths in drains for each sub-catchment were recorded at 15-min intervals for all rain events from December 2011 to March 2012. Capacitance probe data loggers (Scott Parsons Electronics, Australia) along with three conductivity, temperature and depth (CTD) pressure transducers or Divers (Schlumberger Water Services, Germany) were used to gauge runoff water levels at the 11 temporary gauging stations. All drainage channels were surveyed for their cross-sections and slope geometry using an AX-2S Auto level (Nikon, USA). With the available runoff depths and channel geometry information, average flow rates of drains at each gauging site were estimated using Manning’s equation for open channel flows (refer to Appendix A for specific details on runoff calculation). Estimated flow rates from Manning’s equation were validated against measured flow rates (“stick and stopwatch” travel time estimates).
By integrating the runoff hydrograph, runoff volumes for each event were calculated. Sequences of rapid rainfall events, resulting in continuous flow events with multiple peaks, were considered as a single rainfall event for the purposes of this investigation. The runoff coefficients, φ, for individual rainfall events were calculated using:
where Qs is the surface runoff volume caused by a single rain event (measured in megalitres, ML), Rs is rainfall depth (mm), and A is the area of the sub-catchment (ha). The seasonal runoff coefficient was calculated similarly using the total runoff (Qt) divided by the total rainfall (Rt) for the entire wet season, replaced respectively in Equation (1). Further, event median runoff coefficients were calculated for each rainfall event using event runoff coefficients in individual sub-catchments.
Water quality measurements
Water samples were taken at the 11 temporary gauging stations over 15 rainfall events during the study period. During each event, sampling teams of volunteers were coordinated to undertake manual grab sampling at 15-min intervals during the first 60 min, and thereafter at 30-min intervals for the receding flow stage. Samples were split into filtered (0.45 µm) and unfiltered samples, then frozen. Frozen samples were sent to the University of Western Australia analysis laboratory, where total nitrogen (TN), total phosphorus (TP), nitrate/nitrite-nitrogen (N-NOx), ammonia-nitrogen (N-NH4+) and orthophosphate (P-PO43−) contents were measured on a Lachat flow-injection analyser (Lachat Instruments, Milwaukee, USA). The analytical methods were as follows: unfiltered samples were digested using the persulphate method for TN and TP; P-PO43− and TP were determined by the molybdate-ascorbic acid method; N-NOx and TN were determined using the cadmium reduction method, and N-NH4+ was determined using the phenolate method (APHA Citation1998).
Data analysis approach
Seasonal mass first flush (SMFF)
The SMFF defines the relative mass of nutrients and/or contaminants in early season runoff events. It was adapted from the previously defined mass first flush (MFF) ratio, which describes the fractional mass of pollutants emitted as a function of storm duration (Lee et al. Citation2003, Han et al. Citation2006). The dimensionless SMFF ratio is expressed as:
where n is the index of the rainfall–runoff event within the wet season, SMFFn corresponds to the percentage of nutrient exported relative to the cumulative runoff volume, and EMC (event mean concentration) represents a flow-weighted composite sample, effectively the total pollutant load divided by the total runoff volume. On average, three to five samples per event per sub-catchment were collected and total nutrient mass and total runoff volume were then estimated to determine EMC (see Appendix A). The terms M and V are total nutrient loading and total runoff volume for the wet season, respectively.
Statistical analysis of catchment behaviour
The relationships among runoff coefficient, catchment impervious percentage, and rainfall intensity were modelled using linear regression. Variables were checked for normality using the “Q-Q plot” and the “Shapiro-Wilk” test in R software with the “Rcmdr” package (R Core Team Citation2014) and non-normal data were log transformed to approximate a normal distribution, before the regression analysis.
In order to recognize the patterns in nutrient, catchment and hydrological data and their correlations with sub-catchments, XLSTAT software (XLSTAT Citation2013, Addinsoft, New York) was used to perform a principal component analysis (PCA). PCA has been used previously for linking hydrology and water quality within urban environments (Goonetilleke et al. Citation2005, Sodré et al. Citation2005, Shrestha and Kazama Citation2007). To apply this method, data were arranged into a data matrix with the selected nutrient, catchment and hydrological variables defining the columns, and the rows referring to the sub-catchments. The SMFF at 30% of the cumulative runoff percentage for nutrient variables TN, N-NH4+, N-NOx−, TP and P-PO43− were indicated as TNS, NH4S, NOxS, TPS and PO4S, respectively, in the PCA. Along with these, other variables included were topographical slope (SLP), area (A), total impervious percentage (IMP), seasonal runoff coefficient (ROC), number of treated wastewater disposal sites (TWWD), and the nutrient export coefficients for TN (TNEC) and TP (TPEC). The resulting 12 × 11 matrix was treated to remove “noise” (Kokot et al. Citation1998), and was column standardized.
Results and discussion
Characteristics of rainfall and runoff
The number of events that occurred was largely a function of seasonal rainfall distribution with the majority of rainfall in December, January, February and March, as is typical of subtropical monsoonal climates in the Southern Hemisphere ((a)). Of the 15 rainfall events that were captured during the 2011/12 wet season, a range of antecedent dry periods, rainfall intensities and runoff volumes from the 11 sub-catchments were recorded ((b) and (c)). The first rainfall was on 2 January 2012, a delayed onset of the wet season relative to typical years (mid-December). There was a seasonal (first outflow) lag time of more than 8 days in the Broome North sub-catchments GB and VN. The reasons for the seasonal lag are probably the greater storage in these sub-catchments, which have more heavily engineered storm-water systems (e.g. weirs and culverts), and larger contributing areas. Rainfall events with similar depths have different runoff volumes largely due to different rainfall intensities and antecedent dry periods. For example, for two rainfall events of 9.4 mm (22/01/2012) and 10.6 mm (25/01/2012) in the APT sub-catchment, the runoff volumes were 15.5 ML and 5.8 ML respectively. The 9.4 mm event was relatively intense (31 mm/h) compared to the 10.6 mm (17 mm/h) event. As the antecedent dry periods had only a slight difference (1.3 and 0.8 days), the main reason for increased runoff is the higher rainfall intensity of the 9.4 mm event ().
Figure 1. Broome coastal sub-catchments and Roebuck Bay.
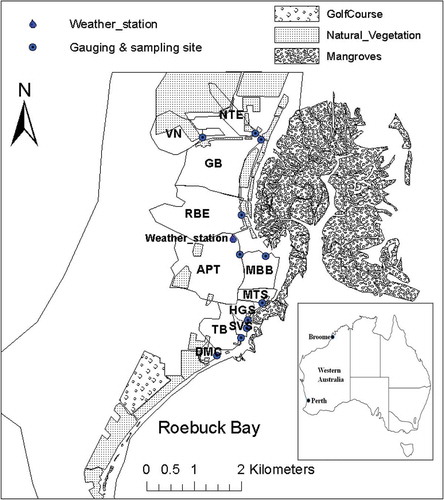
Figure 2. (a) Mean monthly rainfall and mean number of days of rain ≥10 mm in Broome for the periods 1939–2012 and December 2011–March 2012 (BOM Citation2013). Grey areas show the 2011/12 wet season (study period), which spans from January to March. (b) Rainfall, rainfall intensity and antecedent dry period. (c) Calculated runoff volume from sub-catchments for the 2011/12 wet season.
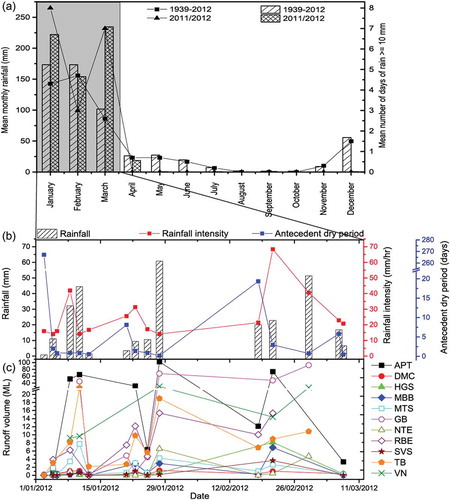
The antecedent dry period for the first rain event of the season was 267.2 days but for the rest of the wet season it varied from 0.4 to 19.3 days. Longer antecedent dry periods (>19 days) reduced the amount of runoff generation. For example, within the DMC sub-catchment on 02/01/2012 (first rainfall event) and 05/01/2012 (third rainfall event), the rainfall amount and intensities were similar (0.8 mm and 16 mm/h). The runoff volumes were different, with the third rainfall event producing 4.6 times higher runoff volume, no doubt influenced by the wetter antecedent soil moisture conditions.
Rainfall events on 08/01/2012, 27/01/2012 and 21/02/2012, with magnitudes of 32.2, 60.8 and 22.8 mm, respectively, have 1–2-year, 1-h average recurrence intervals (ARI). The 51.4 mm rainfall event on 29/02/2012, with an intensity of 41 mm/h, showed a 2.5-year, 1-h ARI and the rest of the events in the wet season were in the category of 1-year or <1-year, 1-h ARI. The wettest month of the 2011/12 wet season was March, largely due to the cyclonic-derived rainfall events, which occurred from 15 to 17 March 2012.
On average, Broome experiences extreme rainfall events from a cyclone about one in every four years and they typically occur between late November and April (BOM Citation2012). For the 2010/11 wet season, the highest rainfall since 2001 was recorded, with cyclonic events at the beginning of the wet season (BOM Citation2013). During the same wet season, Lyngbya occurred, but with less severity and distribution than in all the other years from its conception in Roebuck Bay (Sora Estrella, Personal Communication, 10 January 2013). As the Lyngbya bloom formation was the motivation for this study, high-flow conditions may not be favourable for bloom formation due to nutrient dilution. However, it is worthwhile to see the effect of tropical cyclones on quality of urban runoff and Roebuck Bay water quality as future research work, bearing in mind the logistical difficulties of sampling during such events.
Relationships between catchment and hydrological parameters
Variation in land use occurs within most sub-catchments, categorized as low-density residential (LDR), medium-density residential (MDR), high-density residential (HDR), industrial (IND), undeveloped vegetated area (UDA) and cleared lands (CLL). Each sub-catchment presented different hydrological and catchment characteristics ().
Table 1. Characteristics of urbanizing sub-catchments in Broome town.
Total impervious area percentages for each sub-catchment show significant differences in the degree of correlation with the seasonal runoff coefficient (R2 = 0.48, p < 0.05) ((a)), indicating that relatively higher impervious percentages have higher seasonal runoff coefficients. For most events, relatively higher rainfall intensities were able to generate higher event median runoff coefficients and showed statistical significance between the two variables (R2 = 0.34, p < 0.05) ((b)).
Figure 3. Relationships between runoff, impervious percentage and rainfall intensity.
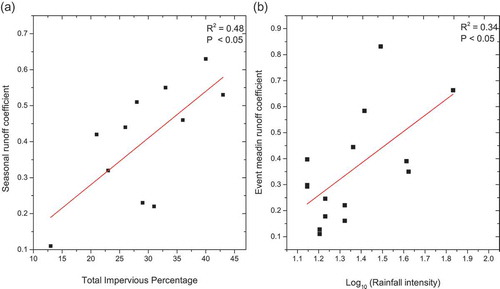
Pilgrim et al. (Citation1982) suggested that hydrological responses of small catchments are likely to be different from and more variable than those of large catchments. All the sub-catchments considered in this study were relatively small, in the range of 8–184 ha, and 8 of 11 sub-catchments (over 72%) are less than 70 ha. That could be one of the reasons for the variability visible in the scatter plots, reflecting relatively lower correlation coefficients. For example, DMC and HGS have similar catchment areas (approximately 12 ha) and, despite receiving the same amount of rainfall, they showed different seasonal runoff coefficients (0.46 and 0.37), most likely due to the impervious percentage difference (36% and 27%). This highlights the importance of understanding the subtle differences of catchment characteristics, such as road network condition (e.g. with or without curbs) and land-use density (HDL to MDL), that could affect the relationship. Shuster et al. (Citation2005) suggested that the impact of weathering on the texture and roughness properties of roadways has some impact on the impermeable surface continuity and therefore conveyance efficiency. This could be the case for HGS, as the road networks are relatively old compared to those within DMC, which were built after 2000. In addition, the relatively recently constructed DMC catchment has curb and guttered roadways with drainage ditches. These act as additional conveyances, with proportionate impacts on flooding through sewer surcharges and drain flows that have exceeded bank elevations, as previously studied by Jones and Grant (Citation1996) and Sample et al. (Citation2003).
Seasonal runoff water quality
The EMC varied by several orders of magnitude throughout the wet season and showed higher values during early runoff events over all sub-catchments. The temporal variation of EMC over the 2011/12 wet season showed that the highest values occur in the first or second event of the season and then drop dramatically for the remainder of the season ((a)). The first two rainfall events were small (0.8 and 11 mm, respectively; only 4% of the total wet season rainfall) but by the end of the second event there was sufficient runoff generation for sampling from all sub-catchments except GB and VN. GB and VN had an 8-day lag before outflow commenced. During these first two outflow events the highest EMC of the wet season was recorded in all sub-catchments where flow occurred.
Figure 4. (a) Temporal variation of EMCs of TN, N-NH4+, N-NOx−, TP and P-PO43− for the 2011/12 wet season from the 11 sub-catchments. (b) SMFF ratios for TN, NH4+, N-NOx−, TP and P-PO43− against cumulative runoff volume for the study period for all sub-catchments. In (b), the dashed line at 1.0 represents the SMFF where the nutrient loadings are uniform throughout the wet season (i.e. no seasonal first flush). Values >1 indicate the seasonal first flush during the early part of the wet season.
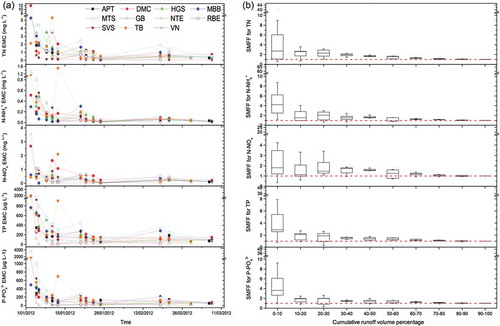
EMCs of the Old Broome sub-catchment outflows are all larger than those of the Broome North sub-catchments. DMC had the largest values for TN, while MTS had the largest for N-NOx−, TP and P-PO43−, all measured during the very first outflow event on 2 January 2012. Sub-catchment TB and other large (>50 ha) sub-catchments in Broome North, such as GB and VN, showed a lag time until peak occurred for most nutrients. In these sub-catchments, the peak occurred after the fourth rainfall event (15% of the total wet season rain) as multiple flow events were required to transport solutes to outflow, given the small, low intensity rainfall events that occurred. A small peak in EMCs in most catchments can be observed in relation to the rainfall event on 18 February 2012, emphasising the influence of the antecedent dry period, 19.3 days in this case.
Seasonal first flush effect
Nutrient export showed a strong seasonal first flush effect in the first 30% of the cumulative runoff volume for most sub-catchments (seasonal first flush is discussed in detail in Appendix B). Analysis of nutrient discharge from 11 sub-catchments over 15 rainfall events of the 2011/12 wet season showed higher SMFF values for all nutrients during the first 30% of the seasonal runoff volume ((b)). The median SMFF for TN at 0–10% of runoff volume was approximately 2.7, which means that treatment of the initial 0–10% of runoff volume could reduce the TN load 2.7 times as much as treating an equal volume later in the season. The ratio between cumulative rainfall categories (i.e. 0–10%) and annual average SMFF were the highest in the 0–10% of runoff volume for all parameters. There was a slight increase in the ratios at 50–60% of runoff volume for TN, N-NH4+ and N-NOx−, potentially due to the nutrient build-up and wash-off after the 19.3 antecedent dry days. Regardless of the antecedent dry period, TP and P-PO43− showed decreasing patterns from the beginning to the end of the wet season.
Weather forecasting played a major role in determining whether the grab sampling captured the variability over an event. It was vital to get the most reliable forecast in order to avoid unproductive mobilizations for rainfall events that did not occur. The number of samples collected and sampling times across each sub-catchment were different in each rainfall event. Some sampling teams missed early parts of some rain events due to travel distances. This can affect EMC calculations because samples collected early in the runoff event typically have higher concentrations than those collected later in the storm event. Receiving water bodies respond relatively slowly to storm inflows compared to the rate at which constituent concentrations change during a storm event. Thus, EMC is an important analytical parameter for evaluating the effects of storm-water runoff on receiving waters (Lee et al. Citation2002).
Our findings expand on those of Lee et al. (Citation2004), who documented the seasonal first flush in a Mediterranean climate in California, USA, where the seasonal first flush was also observed for organics, minerals and heavy metals. Seasonal first flush is a significant nutrient transfer mechanism in this subtropical urbanizing coastal catchment. Yet prediction of nitrogen and phosphorus based nutrient export associated with seasonal first flush from ungauged catchments has never been attempted previously. Dilution effects varied significantly across the sub-catchments, due to the higher runoff volumes caused by larger catchments such as GB and APT. Sub-catchment GB has the strongest dilution effect, probably due to the engineered nature of flow controls and drainage channels, which generate relatively high runoff volumes. The reason for delayed seasonal first flush in DMC is likely due to the high total impervious area percentage which makes relatively low concentrations in the wash-off at high amounts of runoff generation (see more details in PCA).
Sampling had to be called off one week prior to the scheduled finish of the programme due to safety concerns associated with field work during cyclonic rainfall events. Consequently, the contribution of large cyclonic events to nutrient loading was not measured in this study. The effect of tropical cyclones on water quality in coastal embayments is variable due to the differing characteristics of individual storms, catchments and embayments (Furnas Citation1989, Paerl et al. Citation2001, Mallin and Corbett Citation2006). The direction and speed of approach, as well as the point of landfall, intensity, and amount of rainfall all influence a tropical cyclone’s environmental impact on a coastal ecosystem (Weisberg and Zheng Citation2006, Wetz and Paerl Citation2008). In high flow conditions such as cyclonic events, previous research attributes the readily removable nature of TN to its association with the “free solid loads” (Vaze and Chiew Citation2002).
The quantification of storm water discharge and nutrient export was challenging, mainly due to logistic issues, in this relatively remote area with very rapid rainfall–runoff responses and no permanent gauging sites. In measuring storm-water discharge, Manning’s roughness values were taken from the literature for open channels with different bed conditions. Uncertainty in measured flow estimates occurs due to the method used to measure water velocity (“stick and stopwatch” travel time estimates). There was also uncertainty in water quality sampling, with the use of grab sampling, particularly in early runoff due to some sampling teams’ travel distances and rapid rise of drain flows. However, the grab sampling also provided greater flexibility, allowing collection of larger sample volumes as well as special samples using different bottles. Thus, despite the uncertainty in data quality, the SMFF provided sufficient information to understand the relative comparison of seasonal first flush in these subtropical ungauged sub-catchments.
Unravelling the effect of sub-catchment properties on seasonal first flush
The PCA establishes whether relationships occur between the various sub-catchment properties and the hydrological responses, including nutrient export characteristics. The bi-plot shows both the “loadings” (variables) and the “scores” (sub-catchments) for two principal components (PC1 and PC2) which are able to explain more than 72% of the data variance (). Along with the bi-plot, a correlation matrix was used to examine the dependence between multiple variables at the same time (Appendix C)
Figure 5. Bi-plot for the first two principal components with nutrient, catchment and hydrological variables and their correlations with sub-catchments.
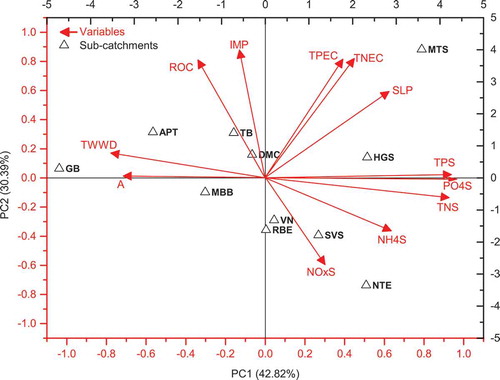
The MTS sub-catchment, a small catchment area with a relatively high topographic slope, produced the largest total nutrient export rate among all sub-catchments. As indicated by PCA and the correlation matrix, topographic slope contributed to increased TN and TP export rates (coefficients are 0.707 and 0.598 respectively) for MTS. In HGS, the neighbouring sub-catchment of MTS, the topographic slopes are relatively high and strong linkages exist with TPS, TP4S and TNS, thus higher TP, P-PO43− and TN seasonal mass first flush, according to the PCA. Apart from fine sediments, wastewater irrigation wash-off and fertilizers, traffic-borne nutrients may also be contributing to the nutrient mass first flush with high intensity rain events at HGS. HGS is believed to have the highest traffic volume in Old Broome and road runoff is known to be a main source for urban non-point source pollution, particularly with respect to nitrogen, phosphorus and heavy metals (Yousef et al. Citation1985, Wu et al. Citation1998).
The SVS and NTE sub-catchments show strong relationships with seasonal runoff for N-NH4+ and N-NOx−. These sub-catchments both had urban developments under construction during the monitoring programme. As previous studies (Harbor Citation1999, Dietz and Clausen Citation2008) have suggested, areas disturbed for construction activity have higher soil erosion rates and storm water runoff, and pollutant export has been reported to increase more than two orders of magnitude throughout the development process (Greenstein et al. Citation2004); our findings reinforce this.
Sub-catchments APT, MBB and GB have larger catchment areas and a greater number (>2) of public open spaces irrigated by treated wastewater disposal (TWWD). Although nutrient loads in these catchments were high, the effect of TWWDs on nutrient concentrations is somewhat obscured in these sub-catchments. This may be because of dilution due to the relatively large areas of these sub catchments and the adaptation of WSUD principles in storm water drainage designs. Irrigating public open spaces with treated wastewater is encouraged by WSUD as a significant water conservation approach (Donofrio et al. Citation2009); however, over-use could result in significant nutrient wash-off potential. Furthermore, the relatively high nutrient loads discharging from Old Broome sub-catchments such as MTS and HGS, may be due to the effect of TWWDs located closer to drain sites or higher amounts of treated wastewater being used that can readily infiltrate.
The seasonal runoff coefficient (ROC) and total impervious area percentage (IMP) have a significant correlation (0.694). Sub-catchments TB and DMC in Old Broome showed a strong relationship with ROC and IMP, as compared to VN, RBE and NTE sub-catchments in Broome North. Along with relatively low IMP, the effect of WSUD adaptations in Broome North is likely contributing to reduced runoff volumes.
How critical are nutrient export characteristics on shock loading?
Despite the limitations and uncertainty, the dataset provided by this community-based sampling campaign and analysis has provided useful insights that could be helpful in sustainable management of the coastal ecosystem. In particular, quantifying the nutrient export coefficients showed the sub-catchments with the largest nutrient inflows to the bay (). Export of TN was in the ranges 0.2–3.8 kg ha−1 year−1 for Old Broome and 0.3–0.5 kg ha−1 year−1 for Broome North. The export coefficient values for TP were in the ranges 0.04–0.5 and 0.04–0.1 kg ha−1 year−1 for Old Broome and Broome North, respectively. More than 80% of the total nutrient exports for both TN and TP were from the Old Broome sub-catchments; MTS contributed approximately one-third of the total nutrient export for both TN and TP.
Figure 6. Nutrient export coefficients from Broome coastal sub-catchments.
The increased nutrient flows from Old Broome are related to the presence of abundant potential sources of non-point source contamination and poor water-sensitive urban drainage design structures. Residential lawns, parks and golf courses are fertilized heavily. There are also areas irrigated with treated wastewater, both of which have been identified as significant sources of nitrates and phosphorus in urban runoff (Pescod Citation1992).
Comparing the nutrient export coefficient values from Broome with those reported from urban areas in other parts of Australia and the USA () suggests that Broome’s annual nutrient export is relatively low. However, nutrient export from the Broome sub-catchments only occurs for three to four months during the wet season, with 82% of the total seasonal TN exports and approximately 78% of the total seasonal TP exports occurring during the first month of the wet season as a shock loading. Therefore, it is not appropriate to compare the nutrient export coefficients on an annual basis as many other areas studied discharge nutrients for longer periods.
Table 2. Typical/median nutrient export coefficients for different catchments in different climate conditions (Beaulac and Reckhow Citation1982, Young et al. Citation1996, Taylor et al. Citation2005).
The impact of shock loading or immediate loading of water bodies with nutrients brings dramatic changes in water quality over a short period of time. The findings of Tsihrintzis and Hamid (Citation1997) suggested that changes in water quality may become more permanent if frequent shock loadings take place and nutrients accumulate in the system. As these nutrients circulate in the bay, they may be sequestered in sediments (or biomass) at various distances from the point of origin. Consequentially, it is not only the short-term impact of shock loading that causes algal blooms but the longer-term accumulation of nutrients in the wider ecosystem. The timing of the intense nutrient export/shock loading may be critical in generation of L. majuscula blooms. If conditions for rapid L. majuscula growth were to occur during the flush of nutrients, there would be a period of approximately one month where marine water nutrient concentrations are greatly elevated. The effect of this needs to be assessed using marine circulation models in future research work.
Are old and new sub-catchments exporting nutrients similarly?
It remains difficult to answer this question as datasets are irregularly sampled; however, hydrographs and pollutographs were produced for two representative sub-catchments for two typical rainfall events with a relatively high density of water quality sampling (). Data collected at MTS ((a) and (b)) represent an Old Broome sub-catchment with conventional drainage system and GB ((c) and (d)) a typical Broome North sub-catchment with WSUD adapted drainage system. The rainfall event in GB (22.8 mm) was twice as large as that in MTS (11 mm), but the higher runoff peak occurred in MTS (0.065 mm), and was approximately double that for GB (0.029 mm). The period of sub-catchment outflow was almost double in GB when compared to MTS. Reduced peak flows and runoff volumes from urban development to increase infiltration and groundwater recharge and are one of the key principles of WSUD (Donofrio et al. Citation2009). The reduced flow peaks, runoff volumes and elongated recession limb of the hydrograph for GB suggest effectiveness of the WSUD implemented there when compared to MTS.
Figure 7. Hydrographs and pollutographs for representative sub-catchments from Old Broome Town (MTS) and Broome North (GB). Runoff volumes were converted to runoff depths in mm and nutrient concentrations were normalized by dividing a particular nutrient concentration at a time by the initial nutrient concentration at the start of the wet season. Time was normalized as 1 represents 180 min.
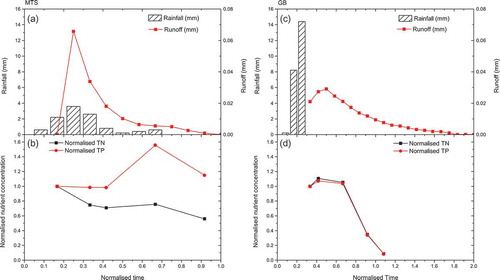
Pollutographs for the GB and MTS sub-catchments provided information about wash-off characteristics of TN and TP. TN concentration peaked at the start of runoff but then dropped to half of the initial concentration. In contrast, TP reached a peak during the recession limb of the hydrograph, with a 50% increase on the initial concentration. This indicates that TN wash-off may depend on the available freely mobile nutrients at the start of runoff, but for TP it may be the capacity of transport that increases with high-intensity rainfall. Similar findings have been recorded elsewhere for TN and TP wash-off characteristics in urban catchments (Miguntanna et al. Citation2013). Apart from these differences, neither nutrient type reached the background level by the end of the runoff phase, indicating that nutrient wash-off was not complete, particularly in Old Broome. The Broome North pollutograph shows that nutrient concentrations reached their peak early in the runoff phase, but Old Broome had a late peak in TP, with continued elevated concentrations, while TN concentrations were fairly constant with only gradual declines.
In Broome North, both TN and TP concentration changes over time showed similar trends, showing high-intensity, short-duration rainfall events indicating increased transport capacity. Pollutographs suggest the first half of a runoff event is critical in managing nutrients in Broome North, while in Old Broome nutrient loads in runoff were much higher in magnitude and had a more consistent concentration through a runoff event.
Implications for nutrient surface runoff management
Improved understanding of nutrient export from different sub-catchments suggests that treating the seasonal early runoff is likely to be several times more effective than treating the later runoff. The many drains in Old Broome were not designed to retain anything; their focus is to discharge to Roebuck Bay even for 1-year, 1-h ARI rainfall events. Management through storm water retention, nutrient attenuation and disposal or artificial groundwater recharge of flows resulting from early rain events could drastically reduce nutrient loading (and shock loading) to Roebuck Bay. Reduced nutrient loading from Broome North sub-catchments (when compared to Old Broome sub-catchments) is likely, due to the adaptation of WSUD principles in the more recently built storm-water system. However, Broome North subdivisions were not complete during the study period so urban-based nutrients (garden fertilizers etc.) would not yet have been in widespread use. There are also currently no wastewater disposal sites in these areas. These results should therefore be confirmed once Broome North is further established.
Small sub-catchments respond more rapidly to rainfall events. With the exception of APT and TB, all the sub-catchments are relatively small in Old Broome. Dietz and Clausen (Citation2008) showed that the impact of increased storm-water runoff on local streams due to changes in a smaller watershed can be dramatic. Therefore, integrating WSUD principles to a small sub-catchment will potentially produce greater benefits than if similar changes were made in a large catchment. Our findings confirm those of Lee et al. (Citation2004) who identified that storm-water management to treat early runoff is more beneficial. Broome’s storm-water managers can optimize outcomes by implementing management, particularly in the Old Broome sub-catchments, for the early runoff events. Further, prioritizing management practices according nutrient export hotspots related to specific sub-catchments, as shown by the PCA, can lead to a more targeted storm-water management approach. Thus, using basic catchment, climate, water quality and water quantity data, together with community-based participatory research, the present study demonstrated a novel cost-effective framework to tackle nutrient storm-water issues in remote, ungauged catchments ().
Figure 8. Framework for managing storm-water nutrients from an ungauged, remote, subtropical catchment.
On small watershed monitoring projects, sampling and funding considerations often make it difficult to achieve project objectives (Dahlgren et al. Citation1999); however, the cost-effective approach made this study possible, as insufficient resources were available to complete it using a traditional approach. The approach used in this project would be particularly beneficial in ungauged catchments in developing areas not resourced sufficiently to monitor storm water using more traditional approaches. Grab sampling, temporary gauging, surveying and levelling of drains was achieved through engagement of local indigenous rangers and local community volunteers, which promotes stakeholder participation while also being cost effective. Mechanical automatic samplers are expensive and, as we collected samples at 11 sampling locations, manual grab sampling saved a substantial cost. Further, risk of device failure is possible in automated sampling (i.e. power failure, programming error, flood damage etc.).
We suggest that the participatory approach in catchment monitoring also has long-term advantages, including the opportunity for the relevant stakeholders, particularly the local community, to gain insight into the hydrological regime of their locality (Kongo et al. Citation2010). This gives a better basis for the community to make decisions regarding catchment-based activities, including understanding the impact of anthropogenic activities on important biodiversity and cultural assets such as Roebuck Bay. The whole process, from data collection, identifying available resources and tools, the decision making and involvement of community participation throughout the process makes this a novel framework in characterizing storm-water quality and quantity data.
Conclusions
This study reports the effect of seasonal catchment hydrology on the nutrient export characteristics of an urbanizing remote, ungauged and poorly studied coastal catchment of northwestern Australia. Shock loading of nutrients from this catchment is impacting water quality, biodiversity and cultural values of the receiving waters. Seasonal first flush was identified as a significant pollutant transfer mechanism in the subtropical climate with a distinct wet weather period and a prolonged dry season, with over three-quarters of the mass of TN and TP discharged during the first month of the wet season.
We propose the dimensionless seasonal mass first flush ratio, which can be used to quantitatively express the seasonal mass first flush and is sufficiently broad to apply to any similar tropical to subtropical climate area with a distinct wet–dry season climatic pattern. The existence of seasonal first flush creates opportunities for storm-water managers and engineers to minimize impacts by integrating WSUD principles with existing storm-water management systems. Based on our findings we suggest that managing the early season runoff (first 30%), with its higher nutrient concentrations, will reduce nutrient export by as much as 70%. The emerging use of WSUDs appears to be effective when compared to traditional urban storm-water management. There is also a link between increased number of wastewater disposal sites and increased nutrient output of catchments; coincidentally the catchments with WSUD applied had no disposal sites.
The community-based participatory research approach was a key aspect of this project, which would not have been possible without it. This approach can make an important contribution through its relatively low cost, allowing available resources to better fill knowledge gaps in hydrology and nutrient delivery. It also enhances the adaptive capacity of local communities to manage the ecosystem, which facilitates community engagement and better long-term catchment management. It also improves the level of understanding of these complex issues in the community.
The methods and tools described here complement each other, allowing the development of the general framework adopted here to monitor the nutrient and surface hydrology. This novel cost-effective framework is relevant for other catchments that may similarly be unable to develop a long-term monitoring programme despite challenges associated with rapid urbanization, particularly in developing countries in tropical regions.
Acknowledgements
We greatly appreciate the volunteer work from Department of Parks and Wildlife (DPaW), Yawuru and Roebuck Bay Working Group (RBWG). We are indebted to Darren Stevens at DPaW for his immense support in organizing and coordinating the whole monitoring programme. The authors wish to thank the staff of UWA Analytical Laboratory for performing the nutrient analyses of the collected samples.
Disclosure statement
No potential conflict of interest was reported by the authors.
Additional information
Funding
References
- Ahern, K.S., Ahern, C.R., and Udy, J.W., 2007. Nutrient additions generate prolific growth of Lyngbya majuscula (cyanobacteria) in field and bioassay experiments. Harmful Algae, 6 (1), 134–151. doi:10.1016/j.hal.2006.08.004
- American Public Health Association (APHA), American Water Work Association (AWWA) and Water Environment federation (WEF), 1998. Standard methods for the examination of water and wastewater. 20th ed. Washington, DC: American Public Health Association, American Water Work Association and Water Environment federation.
- Arcement, G.J. and Schneider, V.R., 1989. Guide for selecting Manning’s roughness coefficients for natural channels and flood plains. United States Geological Survey water-supply paper 2339. Denver, CO: USGS.
- Beaulac, M.N. and Reckhow, K.H., 1982. An examination of land-use nutrient export relationships 1. Journal of the American Water Resources Association, 18 (6), 1013–1024. doi:10.1111/jawr.1982.18.issue-6
- Bertrand-Krajewski, J., Chebbo, G., and Saget, A., 1998. Distribution of pollutant mass vs volume in stormwater discharges and the first flush phenomenon. Water Research, 32 (8), 2341–2356. doi:10.1016/S0043-1354(97)00420-X
- Blöschl, G., 2006. Rainfall–runoff modeling of ungauged catchments. In: M.G. Anderson, ed. Encyclopedia of hydrological sciences. Hoboken, NJ: John Wiley & Sons, Vol. 11, 133.
- Blöschl, G., et al., 2013. Runoff prediction in ungauged basins: synthesis across processes, places and scales. New York, NY: Cambridge University Press.
- Bowen, J.L. and Valiela, I., 2001. The ecological effects of urbanization of coastal watersheds: historical increases in nitrogen loads and eutrophication of Waquoit Bay estuaries. Canadian Journal of Fisheries and Aquatic Sciences, 58 (8), 1489–1500. doi:10.1139/f01-094
- Brabec, E., 2002. Impervious surfaces and water quality: a review of current literature and its implications for watershed planning. Journal of Planning Literature, 16 (4), 499–514. doi:10.1177/088541202400903563
- Bricker, S.B., et al., 2008. Effects of nutrient enrichment in the nation’s estuaries: a decade of change. Harmful Algae, 8 (1), 21–32. doi:10.1016/j.hal.2008.08.028
- Bureau of Meteorology (BOM), 2012. Tropical cyclones affecting Broome. Australian Government, Bureau of Meteorology. Available from: http://www.bom.gov.au/cyclone/history/wa/broome.shtml [ Accessed 12 August 2012].
- Bureau of Meteorology (BOM), 2013. Climate of Broome. Australian Government, Bureau of Meteorology. Available from: http://www.bom.gov.au/climate/averages/tables/cw_003003.shtml [ Accessed 12 November 2013].
- Curran, K. and MacKenzie, N., 2007. It’s a values thing. In: Connecting land shores and oceans - 4th WA state coastal conference, 30 October 2007–2 November 2007 Denmark, Australia.
- Dahlgren, R., et al., 1999. Timing, frequency of sampling affect accuracy of water-quality monitoring. California Agriculture, 53 (6), 44–48. doi:10.3733/ca.v053n06p44
- Deletic, A., 1997. The first flush load of urban surface runoff. Water Research, 32 (8), 2462–2470. doi:10.1016/S0043-1354(97)00470-3
- Dietz, M.E. and Clausen, J.C., 2008. Stormwater runoff and export changes with development in a traditional and low impact subdivision. Journal of Environmental Management, 87 (4), 560–566. doi:10.1016/j.jenvman.2007.03.026
- Donofrio, J., et al., 2009. Water-sensitive urban design: an emerging model in sustainable design and comprehensive water-cycle management. Environmental Practice, 11 (03), 179–189. doi:10.1017/S1466046609990263
- Ebise, S., 1991. Storm runoff loading of nutrients and pollutants in upper rivers. Japanese Journal of Limnology, 52 (4), 241–253. doi:10.3739/rikusui.52.241
- Emery, S., Masterson, S., and Caplehorn, M., 2009. Sand-clay Pindan material in pavements as a structural layer. Regional and local hydrology in the vicinity of the proposed LNG precinct. Perth: BG&E.
- Environmental Systems Research Institute (ESRI), 2011. ArcGIS desktop: release 10. Redlands, CA: Environmental Systems Research Institute.
- Estrella, S., 2013. Effects of nutrient enrichment and toxic Lyngbya blooms on benthic invertebrates and migratory shorebird communities of Roebuck Bay Ramsar site. Final Report. Perth, Australia: The University of Western Australia.
- Federal Highway Administration (FHWA), 2011. Introduction to Highway Hydraulics; Drainage design charts and tables United States Department of Transportation. Available from: <http://www.fhwa.dot.gov/engineering/hydraulics/pubs/08090/appb.cfm> [Accessed 05 August 2013].
- French, R.H., 1986. Open-channel hydraulics (International Edition). Singapore: McGraw-Hill Book.
- Furnas, M.M., 1989. Cyclonic disturbance and a phytoplankton bloom in a tropical shelf ecosystem. Red tides: biology, environmental science and toxicology. In: Proceedings of the first international symposium on red tides, Takamatsu, Kagawa Prefecture, Japan, 273–276.
- Gnecco, I., et al., 2005. Storm water pollution in the urban environment of Genoa, Italy. Atmospheric Research, 77 (1–4), 60–73. doi:10.1016/j.atmosres.2004.10.017
- Goonetilleke, A., et al., 2005. Understanding the role of land use in urban stormwater quality management. Journal of Environmental Management, 74 (1), 31–42. doi:10.1016/j.jenvman.2004.08.006
- Greenstein, D., Tiefenthaler, L., and Bay, S., 2004. Toxicity of parking lot runoff after application of simulated rainfall. Archives of Environmental Contamination and Toxicology, 47 (2), 199–206. doi:10.1007/s00244-004-3018-0
- Hall, M. and Ellis, J.B., 1985. Water quality problems of urban areas. GeoJournal, 11, 265–275. doi:10.1007/BF00186340
- Han, Y., et al., 2006. Correlation analysis among highway stormwater pollutants and characteristics. Water Science & Technology, 53 (2), 235–243. doi:10.2166/wst.2006.057
- Harbor, J., 1999. Engineering geomorphology at the cutting edge of land disturbance: erosion and sediment control on construction sites. Geomorphology, 31 (1–4), 247–263. doi:10.1016/S0169-555X(99)00107-5
- Huang, J., et al., 2007. Characterization of surface runoff from a subtropics urban catchment. Journal of Environmental Sciences, 19 (2), 148–152. doi:10.1016/S1001-0742(07)60024-2
- Huber, W., 1993. Contaminant transport in surface water. In: D.R. Maidment, ed. Handbook of hydrology. New York, NY: McGraw-Hill Book.
- Jones, J. and Grant, G.E., 1996. Peak flow responses to clear‐cutting and roads in small and large basins, western Cascades, Oregon. Water Resources Research, 32 (4), 959–974. doi:10.1029/95WR03493
- Kokot, S., et al., 1998. Data interpretation by some common chemometrics methods. Electroanalysis, 10 (16), 1081–1088
- Kongo, V., et al., 2010. Establishment of a catchment monitoring network through a participatory approach in a rural community in South Africa. Hydrology and Earth System Sciences, 14 (12), 2507–2525. doi:10.5194/hess-14-2507-2010
- Lee, H., et al., 2004. Seasonal first flush phenomenon of urban stormwater discharges. Water Research, 38 (19), 4153–4163. doi:10.1016/j.watres.2004.07.012
- Lee, J., et al., 2002. First flush analysis of urban storm runoff. Science of the Total Environment, 293 (1–3), 163–175. doi:10.1016/S0048-9697(02)00006-2
- Lee, J., et al., 2003. Evaluation of the methods for first flush analysis in urban watersheds. Water Science & Technology, 48 (10), 167–176.
- Lee, J.H. and Bang, K.W., 2000. Characterization of urban stormwater runoff. Water Research, 34 (6), 1773–1780. doi:10.1016/S0043-1354(99)00325-5
- Luo, H., et al., 2009. Total pollution effect of urban surface runoff. Journal of Environmental Sciences, 21 (9), 1186–1193. doi:10.1016/S1001-0742(08)62402-X
- Maidment, D.R., 2002. ArcHydro: GIS for water resources. Redlands, CA: Environmental Systems Research Institute (ESRI).
- Mallin, M.A. and Corbett, C.A., 2006. How hurricane attributes determine the extent of environmental effects: multiple hurricanes and different coastal systems. Estuaries and Coasts, 29 (6), 1046–1061. doi:10.1007/BF02798667
- McIntyre, N., et al., 2005. Ensemble predictions of runoff in ungauged catchments. Water Resources Research, 41 (12), W12434. doi:10.11029/12005WR004289
- Miguntanna, N.P., et al., 2013. Characterising nutrients wash-off for effective urban stormwater treatment design. Journal of Environmental Management, 120, 61–67. doi:10.1016/j.jenvman.2013.02.027
- Paerl, H.W., et al., 2001. Ecosystem impacts of three sequential hurricanes (Dennis, Floyd, and Irene) on the United States’ largest lagoonal estuary, Pamlico Sound, NC. Proceedings of the National Academy of Sciences, 98 (10), 5655–5660. doi:10.1073/pnas.101097398
- Paerl, H.W., et al., 2008. Co-occurrence of dinoflagellate and cyanobacterial harmful algal blooms in southwest Florida coastal waters: dual nutrient (N and P) input controls. Marine Ecology Progress Series, 371, 143–153. doi:10.3354/meps07681
- Pearson, G., et al., 2008. Ecological character description for Roebuck Bay. Perth, Australia: Department of Environment and Conservation.
- Pescod, M.B., 1992. Wastewater treatment and use in agriculture - FAO irrigation and drainage paper 47. Rome, Italy: Food and Agriculture Organization of the United Nations.
- Piersma, T., Pearson, G., and Lavaleye, M., 1998. The teeming mud of Roebuck Bay. Landscope, 13 (4), 1–14.
- Pilgrim, D.H., Cordery, I., and Baron, B.C., 1982. Effects of catchment size on runoff relationships. Journal of Hydrology, 58 (3), 205–221. doi:10.1016/0022-1694(82)90035-X
- R Core Team, 2014. R: a language and environment for statistical computing. Vienna, Austria: R Foundation for Statistical Computing. Available from: http://www.R-project.org/
- Sample, D.J., et al., 2003. Costs of best management practices and associated land for urban stormwater control. Journal of Water Resources Planning and Management, 129 (1), 59–68. doi:10.1061/(ASCE)0733-9496(2003)129:1(59)
- Schiff, K.C. and Tiefenthaler, L.L., 2011. Seasonal flushing of pollutant concentrations and loads in urban stormwater. JAWRA Journal of the American Water Resources Association, 47 (1), 136–142. doi:10.1111/jawr.2011.47.issue-1
- Shrestha, S. and Kazama, F., 2007. Assessment of surface water quality using multivariate statistical techniques: a case study of the Fuji river basin, Japan. Environmental Modelling & Software, 22 (4), 464–475. doi:10.1016/j.envsoft.2006.02.001
- Shuster, W., et al., 2005. Impacts of impervious surface on watershed hydrology: a review. Urban Water Journal, 2 (4), 263–275. doi:10.1080/15730620500386529
- Sinclair Knight Merz (SKM), 2009. Broome north engineering report - final. Perth, Australia: Landcorp.
- Sivapalan, M., et al., 2003. IAHS decade on Predictions in Ungauged Basins (PUB), 2003–2012: shaping an exciting future for the hydrological sciences. Hydrological Sciences Journal, 48 (6), 857–880. doi:10.1623/hysj.48.6.857.51421
- Sodré, F.F., et al., 2005. Identification of copper sources in urban surface waters using the principal component analysis based on aquatic parameters. Journal of Environmental Monitoring, 7 (6), 581–585. doi:10.1039/b416064a
- Standards Australia, 1991. Australian Standard. Measurement of water flow in open channels. Part 4: measurement using flow gauging structures. Canberra, Australia: Council of Standards Australia.
- Streeter, V.L., Wylie, E.B., and Wylie, Z., 1987. Fluid mechanics. New York, NY: WCB/McGraw-Hill.
- Taylor, G.D., et al., 2005. Nitrogen composition in urban runoff—implications for stormwater management. Water Research, 39 (10), 1982–1989. doi:10.1016/j.watres.2005.03.022
- Tsihrintzis, V.A. and Hamid, R., 1997. Modeling and management of urban stormwater runoff quality: a review. Water Resources Management, 11 (2), 136–164. doi:10.1023/A:1007903817943
- Vaze, J. and Chiew, F.H., 2002. Experimental study of pollutant accumulation on an urban road surface. Urban Water, 4 (4), 379–389. doi:10.1016/S1462-0758(02)00027-4
- Weisberg, R.H. and Zheng, L., 2006. Hurricane storm surge simulations for Tampa Bay. Estuaries and Coasts, 29 (6), 899–913. doi:10.1007/BF02798649
- Wetz, M.S. and Paerl, H.W., 2008. Estuarine phytoplankton responses to hurricanes and tropical storms with different characteristics (trajectory, rainfall, winds). Estuaries and Coasts, 31 (2), 419–429. doi:10.1007/s12237-008-9034-y
- Wu, J.S., et al., 1998. Characterization and pollutant loading estimation for highway runoff. Journal of Environmental Engineering, 124 (7), 584–592. doi:10.1061/(ASCE)0733-9372(1998)124:7(584)
- XLSTAT, 2013. Running a principal componenent analysis (PCA). New York: Addinsoft. Available from: https://help.xlstat.com/customer/en/portal/articles/2062222-principal-component-analysis-pca-in-excel?b_id=9283 [Accessed 12 July 2013].
- Young, W.J., Marston, F.M., and Davis, J.R., 1996. Nutrient exports and land use in Australian catchments. Journal of Environmental Management, 47, 165–183. doi:10.1006/jema.1996.0043
- Yousef, Y., Wanielista, M., and Harper, H., 1985. Removal of highway contaminants by roadside swales. Washington, DC: Transportation Research Board, National Research Council, 62–68.
Appendices
Appendix A
Flow rate calculation through Manning’s equation
Velocity of flow in open drainage channels is computed through Manning’s equation, which is an empirical equation that applies to uniform flow in open channels and is a function of the channel velocity, flow area and channel slope (Arcement and Schneider Citation1989). Uniform flow was assumed (Streeter et al. Citation1987) for all Broome drainage channels. Manning’s equation can be expressed as:
where V is the mean velocity of flow (m−1 s); k is a conversion factor (m1/3 s−1) that is 1 for SI units; n is the Manning coefficient (dimensionless), which is a function of the culvert material; values for n used for the drainage channels in each Broome sub-catchment were compiled from previous studies (); R is the hydraulic radius (m), defined as the ratio of flow cross-sectional area and wetted perimeter; and S is the slope of the energy grade line (dimensionless), which for uniform flows equals the channel bottom or water surface and can be computed through the vertical distance divided by horizontal distance.
If velocity is known, the discharge Q (m3 s−1) can then be computed as:
The results of Manning’s formula, an indirect computation of streamflow, have applications in flood-plain management and flood insurance (Arcement and Schneider Citation1989). Greater error can be expected in estimating the average velocity by assuming a Manning’s n than by direct sampling (i.e. with a current flow meter), or measuring it across weirs. Therefore we used measured flow rates using a “stick and clock” method to calibrate Manning’s formula, even though the method had its own uncertainty.
Sub-catchment VN had a V-notch weir at the gauging station. Flow rate at the V-notch weir was calculated using the V_Notch weir equation (Standards Australia Citation1991). The notch angle of the weir was 53.02° and the coefficient of discharge used was 0.578 (C = 0.58 typically for a 90° V-notch weir).
Event mean concentration (EMC)
Nutrient concentrations fluctuate considerably during a rain event and a single index known as event mean concentration (EMC) is often used to characterize runoff water quality. The EMC represents a flow-weighted composite sample, effectively the total pollutant load divided by the total runoff volume:
where C(t) is the time-variable concentration (mg L−1) and Q(t) is the runoff flow rate (m3 s−1) discharged at time t (Huber Citation1993, Lee and Bang Citation2000). Total nutrient mass and total runoff volume were then estimated to determine EMC.
Appendix B
Seasonal first flush effect
Nutrient export showed a strong seasonal first flush effect in the first 30% of the cumulative runoff volume for most sub-catchments ((a)–(e)).
Figure B1. Cumulative nutrient loading percentage curves for (a) TN, (b) NH4+, (c) N-NOx−, (d) TP and (e) P-PO43− against cumulative runoff volume percentages in the 11 sub-catchments. A seasonal first flush occurs if the data ascend above the dashed line, which represents uniform nutrient loading throughout the wet season.
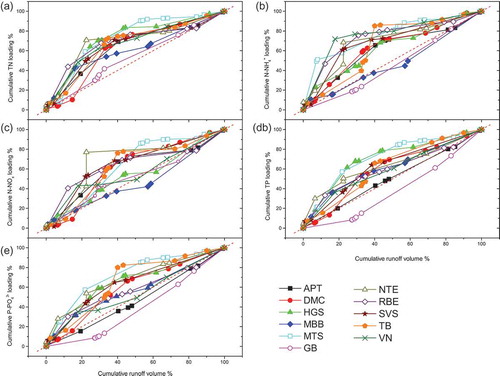
Sub-catchment DMC showed a delayed seasonal first flush for TN and N-NOx−, while TP, P-PO43− and NH4+ exports were uniform in sub-catchment APT. A slight dilution effect in the first 30% of the cumulative runoff volume was visible in sub-catchment GB for TP and P-PO43−. A late dilution was visible in the MBB catchment after a uniform first flush for NH4+ and N-NOx−.
Appendix C
Correlation matrix
A correlation matrix was derived between the nutrient, catchment, climate and hydrological parameters presented in the PCA bi-plot in .
Table A1. Manning’s n values for Broome drains in each sub-catchment. Values were compiled from the literature (French Citation1986, Streeter et al. Citation1987, FHWA Citation2011) and selected following the guide by Arcement and Schneider (Citation1989).
Table C1. Correlation matrix for the parameters presented in the PCA bi-plot. Bold indicates significant values (except diagonal) at the level of significance α = 0.050 (two-tailed test).