
ABSTRACT
This work aims to provide a dynamic assessment of flood risk and community resilience by explicitly accounting for variable human behaviour, e.g. risk-taking and awareness-raising attitudes. We consider two different types of socio-hydrological systems: green systems, whereby societies deal with risk only via non-structural measures, and technological systems, whereby risk is dealt with also by structural measures, such as levees. A stylized model of human–flood interactions is first compared to real-world data collected at two test sites (People’s Republic of Bangladesh and the city of Rome, Italy) and then used to explore plausible trajectories of flood risk. The results show that flood risk in technological systems tends to be significantly lower than in green systems. However, technological systems may undergo catastrophic events, which lead to much higher losses. Furthermore, green systems prove to be more resilient than technological ones, which makes them more capable of withstanding environmental and social changes.
EDITOR D. Koutsoyiannis
ASSOCIATE EDITOR not assigned
1. Introduction
Nine of the 10 largest urban agglomerates in the world are located in flood-prone areas and, as a result, flooding now affects more than 100 million people per year (Di Baldassarre et al. Citation2013a). Flooding adversely impacts humans and their economies by eroding land, damaging infrastructure, agricultural activities and industrial assets, and causing death.
From a natural science perspective, floods result from the interplay of three factors: atmosphere, catchments and rivers (Blöschl et al. Citation2015). Although the natural system is subject to change, many studies are more inclined to attribute increases in flood damage to changes in the vulnerability of society (Di Baldassarre et al. Citation2013a, Domeneghetti et al. Citation2015). In addition, human interventions (e.g. flood control measures, land-use change and urbanization) are considered to have a significant impact on the frequency and magnitude of flooding (Di Baldassarre et al. Citation2009) and therefore they are thought to play an active role in changing the hydrological regime (Bormann et al. Citation2011, Villarini et al. Citation2011, Viglione et al. Citation2016).
In fact, on many floodplains around the world, human settlements, flood control measures and the hydrology of floods have gradually co-evolved (see e.g. Castellarin et al. Citation2011). Society makes scientific, economic and technical efforts to mitigate the phenomenon by developing protection measures, and this leads to a reduction of flood frequency in priority areas (Di Baldassarre et al. Citation2009), which often triggers additional urbanization or industrialization of flood-prone areas. This in turn can increase flood risk by making more people exposed and societies vulnerable to rare, but highly impacting, events.
To explore such dynamics, Di Baldassarre et al. (Citation2013a) argue that a socio-hydrological approach is needed for the study of floodplain systems because of the unavoidable presence of humans in floodplains and their key role in assessing flood risk. In an attempt to do so, Di Baldassarre et al. (Citation2013b), Viglione et al. (Citation2014) and Di Baldassarre et al. (Citation2015) modelled the co-evolution of population dynamics and flood events on a floodplain by assuming social memory of floods as a key player in shaping human response. They conceptualized a stylized model that considers two different types of socio-hydrological systems: green systems, whereby societies deal with risk only via non-structural measures, and technological systems, whereby societies deal with risk also by structural measures that decrease the frequency of flooding, such as levees. In particular, green systems schematize societies that deal with flood risk via non-structural measures only, which are more common in low-income countries. The model conceptualizes these non-structural measures as reduction of floodplain population density. This can capture not only the (formal or informal) processes that lead to resettlement outside of flood-prone areas, but also (planned or spontaneous) implementation of other measures that make people and buildings more capable of coping with floods. Technical systems schematize societies that deal with flood risk by combining both structural and non-structural measures, which are more common in high-income countries. Structural measures are conceptualized in the model by using a flood protection level, which is updated after the occurrence of flooding. This flood protection level is used to capture the prevention of events that have a magnitude below a certain threshold (i.e. flood protection level), which results from the introduction or reinforcement of levees, flood-relief channels or reservoirs.
The aim of the current work is to investigate the dynamics of flood risk in green and technological systems by explicitly accounting for human–flood interactions and feedback mechanisms. To this end, we first test the consistency of the socio-hydrological model proposed by Di Baldassarre et al. (Citation2015) and data related to two contrasting case studies (People’s Republic of Bangladesh, as a green system, and the city of Rome, as a technological system), and then we use the model to explore flood resilience and potential losses across different human attitudes. The capability of the model to realistically simulate flood-risk dynamics observed in the real world (first step) legitimizes a synthetic exploration of flood resilience scenarios (second step).
Assessing resilience is of paramount importance in current flood-risk management practices, which do not limit their scope at reducing flood hazard but aim to reduce the overall flood impact. Nevertheless, a clear and general definition of resilience is not easy to find. Numerous definitions of resilience are presented by different disciplines, such as engineering, ecology, psychology and economics. In order to face such ambiguity, Keating et al. (Citation2014) carried out a comprehensive analysis on how the concept of resilience has evolved over time in the context of natural disasters, and provided a summary of definitions used by academia, multilateral organizations, development agencies and NGOs, and the private sector. Although different, these definitions show many similarities. They make reference to resilience as a “capacity” or “ability” to “withstand”, “absorb” or “recover” from the effect of a hazardous event. The current work relies upon such similarities and proposes a quantitative approach to model resilience in flood-risk management through socio-hydrological modelling. We investigate the dynamics of flood risk by addressing the following research questions:
Does the socio-hydrological model proposed by Di Baldassarre et al. (Citation2015) capture the essential dynamics of flood risk observed in two real-world case studies?
How do flood risk and losses evolve over time in different socio-hydrological systems?
Are green systems more resilient than technological systems?
Concerning the two real-world case studies, can we infer policy recommendations based on the model results, and to what extent?
2. Description of the socio-hydrological model
The interaction between flood occurrence and the development of human settlements is highly dependent upon the adopted flood-risk management strategy. Communities may adopt various combinations of structural and non-structural flood-risk reduction measures. The former include building hydraulic infrastructures such as levees, retention ponds, diversion canals and drainage systems aimed at controlling the overflow and protecting people from high waters, while the latter involve any non-structural activity devoted to reducing people’s exposure and vulnerability including flood forecasting, land-use planning and implementation of public-awareness programmes.
Di Baldassarre et al. (Citation2015) referred to technological and green systems in describing societies oriented to follow mainly structural and solely non-structural measures, respectively. Their proposed modelling framework, although simple, proved to be capable of capturing some important two-way feedback mechanisms between physical and social processes that have been observed in various floodplains around the world, namely the adaptation and levee effects.
The levee effect relates to the increased feeling of safety developed as a consequence of levee heightening, which induces people to move closer and closer to the river. This has a twofold consequence: on the one hand, it fosters economic growth due to the reduced frequency of occurrence of economic losses, and on the other hand, it leads to an increase in flood exposure in flood-poor periods, making potential future flood events catastrophic.
The adaptation effect refers to the increase of people’s flood awareness after the occurrence of a damaging flood event, which results in a reduction of flood losses associated with events of similar magnitude.
The modelling exercise carried out by Di Baldassarre et al. (Citation2015) suggested a levee effect in the dynamics of technological systems and an adaptation effect in the dynamics of green ones.
Here we briefly recall the model and invite the reader to refer to the original paper for a more detailed description. and illustrate the meaning, units and values of the variables and parameters of the model. The adopted conceptualization makes use of a single equation (F, Hydrology) to describe the impact, in terms of relative losses, of a given flood magnitude. Losses span from zero (no damage) to one (total destruction):
Table 1. Time-varying variables of the dynamic model, data type and initial conditions used in the experiment for the two case studies: the People’s Republic of Bangladesh (BGD) and Rome, Italy.
However, the social system is modelled by means of three differential equations that describe floodplain density (D, Demography), flood-risk protection level, e.g. levee height (H, Technology) and social memory of floods (M, Society):
In the case of flooding, the reduction of floodplain density due to displacement of people or economic losses, as well as the increase in risk awareness and the eventual heightening of levees, are modelled as instantaneous. This is done via a non-periodic Dirac comb Δ(Ψ(t)) that is always 0 except when Ψ(t) = 0, in which case it is infinite with integral equal to 1. Variables with subscript “−” refer to the time immediately before the event.
Finally, the amount of levee heightening (R) in technological systems is assumed to be proportional to the difference between the actual high-water level, which has led to flooding, and the flood protection level:
3. Methodology
3.1. Green vs technological systems: setting the real case studies
We apply the model to two real case studies, namely the People’s Republic of Bangladesh (also referred to as Bangladesh in the following) and the city of Rome, Italy, as examples of a green and a technological system, respectively.
For Bangladesh, we refer to the data provided by Mechler and Bouwer (Citation2015), which span the period 1974–2007 and are available in terms of country gross domestic product (GDP), economic losses and flooded area. Di Baldassarre et al. (Citation2014) estimated that 65% of the total population in Bangladesh lives on floodplains, and therefore the country’s GDP is adjusted accordingly. Furthermore, the density variable (D) is assumed to be bounded between zero and one, therefore the floodplain GDP is normalized considering theoretical maximum floodplain GDP values, which are estimated by referring to current GDP per capita of India and China. Thus, a range of floodplain GDP density is provided. Finally, the flooded area is used as a proxy for the high-water level, W. See Mechler and Bouwer (Citation2015) for more details about this case study.
For the city of Rome, the time series span the period 1800–2015 and refer to population density, high-water levels and flood protection levels, i.e. levee height. Information on Rome’s inhabitants living close to the Tiber River was derived from censuses and population register data sources (e.g. Casacchia and Crisci Citation2013). Demographic data disaggregated by districts (the so-called “zone toponomastiche”) were collected to define a buffer zone along the river corresponding to the Tiber’s floodplain; this allows identification of the floodplain population and calculation of its density. Population values within the Tiber’s floodplain are then normalized by the theoretical maximum Tiber floodplain population, which is estimated based on expert judgement and assumed to range between 106 and 2 × 10⁶. Thus, a range of floodplain population density is provided.
3.2. Green vs technological systems: setting the numerical experiments
After testing the consistency between the model outcomes and real-world data, we further expand the analysis by simulating the behaviour of various green and technological systems including the hydrological stochasticity of floods. In particular, the time series of high-water levels above bankfull water depth is simulated as a marked point stochastic process defined by two random variables, as in Viglione et al. (Citation2014): the arrival time between events and the magnitude of peak events. The number of occurrences per unit time is assumed to be Poisson distributed, while the probability density function of flood peak magnitudes is modelled as a generalized Pareto distribution. In addition, subsequent peaks are considered independently.
3.2.1. Modelling the dynamics of flood risk
Notwithstanding the enormous amount of flood-risk analysis studies where risk is assumed to be defined by the interplay between exposure, vulnerability and hazard, there is no clear acceptance on how these components relate to one another, and their definitions are sometimes overlapping or even misleading, making the current definition of flood risk somewhat ambiguous. Here we define flood risk as:
where the term Losses is modelled as the product between relative losses (F, Hydrology) and floodplain density (D, Demography), whereas Hazard represents the probability of the event to occur and follows a GEV distribution. More precisely, risk is calculated here as:
where:
is the GEV probability density function of the variable W, i.e. the maximum water level per unit time, and L(w,D,H) is Losses. Finally, because of the upper bound on W, one can write:
which represents the expected losses per unit of time.
3.2.2. Exploring the possibility space: measuring community resilience and losses
As pointed out by Sivapalan and Blöschl (Citation2015), one of the main strengths of socio-hydrological modelling is the capability to explore the possibility space, namely each possible dynamic that could emerge from the mutual interaction of the variables at hand. In fact, given the model capability of capturing empirically observed complex human–flood dynamics, the question now is how do different model components respond according to different possible societal attitudes. For this reason, the aim is to understand how losses and community resilience evolve, in both green and technological systems, for different risk-taking and awareness-raising attitudes. This is done by assuming the parameters αD of Equation (2) (Demography equation) and μS of Equation (4) (Society equation) as risk-taking and awareness-raising attitude measures, respectively.
3.2.2.1. Resilience
As discussed above, we refer to resilience as the capacity to recover from the effects of a hazardous event. In the modelling context, analysis of resilience is carried out by analysing the system’s evolution as a consequence of stochastic hydrological perturbations, focusing on the system’s ability to recover and the celerity of such recovery. We assume a full recovery when the system returns to the pre-event population density (D) level and the associated recovery time (rt) is evaluated as follows:
where is the time at which the flood occurs and
is the time at which society reaches a population density level (D) that is equal to the pre-event one (Dshock).
3.2.2.2. Losses
The factor Losses is defined as the product of relative damage (F) and the pre-event population growth level (D). A clear distinction between Risk and Losses applies: Risk is the average loss per unit time, and is therefore an estimation of expected damage; Losses is the average loss per event, which quantifies, on average, what has actually happened.
4. Results
4.1. Case studies
shows model results and observations with respect to Bangladesh (left) and the city of Rome (right). The results are expressed in terms of flood protection level (e.g. levee height), social memory of past flood events, flood losses and floodplain density dynamics. One should note that stylized models are not meant to fit the data as they aim to capture the essential dynamics and provide insights into possible behaviours of the overall system. Still, our aim is to diagnose the credibility of this modelling framework by evaluating the underlying conceptualization using real-world dynamics.
Figure 1. Testing consistency between the outcomes of the socio-hydrological model and real-world data: People’s Republic of Bangladesh (example of green systems, left column) and Rome (example of technological systems, right column). Data are depicted in black.
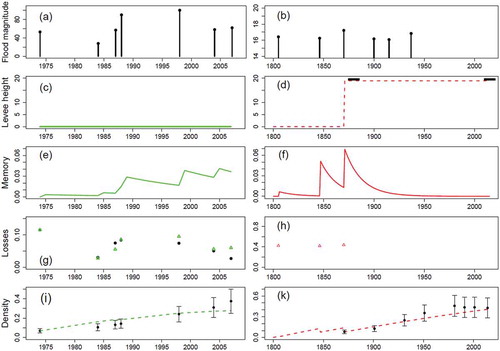
Flood losses in Bangladesh () decrease with time, although subjected to events of non-decreasing magnitude, suggesting an adaptive behaviour, and the model is able to capture this dynamic. In particular, the 2007 event causes half the damage of the 1973 one, although their magnitudes are similar. This may be due to the high level of community risk-awareness (), which the model describes as increasing with time. Moreover, if one looks at , the results reproduce the growing trend of floodplain GDP.
The city of Rome experienced severe flooding events throughout the 19th century, until levees were built up to a level higher than the most severe flood experienced over the past two centuries (17.22 m a.s.l. on 28 December 1870). After the construction of levees, all the high-water events were below the protection level and no major flood losses were recorded. This allowed steady and undisturbed growth () but, at the same time, led to a dramatic decrease in people’s awareness of flood risk (), giving rise to the aforementioned levee effect, which the model reproduces.
4.2. Understanding risk dynamics
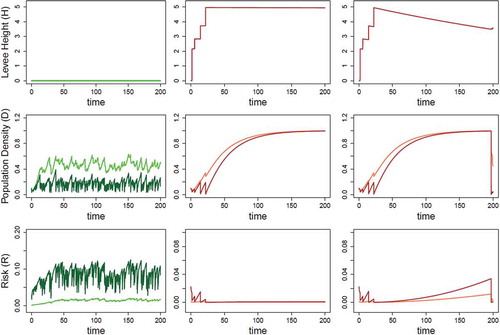
shows the dynamic evolution of flood risk by using two different values of parameter αH, which is related to the relationship between flood water levels and relative damage (see ), and to which we refer as a measure of society vulnerability, i.e. the higher αH the lower the vulnerability and vice versa. In general, risk is higher the higher the vulnerability and it tends to fluctuate following population density (D) fluctuations. In addition, in technological systems, although risk still fluctuates as population density (D) does, it is almost null after the community builds sufficiently high levees. This leads to another interesting consideration, namely the important role played by the maintenance of protection level, e.g. levee height. For higher values of κT, levees decay faster and, as soon as their level becomes lower than the maximum possible water level, risk increases significantly. Overall, the average risk level is much higher in green systems than in technological ones.
Table 2. Time-invariant parameters of the dynamic model and values used in the experiment and reference for the two case studies: the People’s Republic of Bangladesh (BGD) and Rome.
Figure 2. Levee height (H), population density (D) and risk (R) dynamics of green (left) and technological (centre, right) systems according to high (αH = 0.25) and low (αH = 10) vulnerability conditions. The lighter the line colour, the lower the vulnerability. The centre and right pictures show risk dynamics in technological systems for two different values of levee decay rate kT, equal to 2 × 10⁻⁵ (centre) and 2 × 10⁻³ (right).
4.3. Losses and resilience
In the following, we refer to risk-taking and awareness-raising attitudes as RTa and ARa, respectively. In addition, the whole analysis is based on the evaluation of 50 different flooding scenarios for each parameter combination.
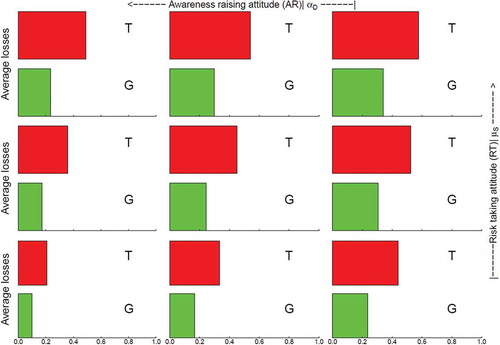
The upper graph in shows losses of both green and technological systems, and their interpretation is quite straightforward. Losses are always far higher in technological systems and they increase for decreasing ARa and increasing RTa. Extreme situations, high RTa and low ARa, and low RTa and high ARa, exhibit the highest and lowest damages, respectively.
Figure 3. Each box contains two bars relating to average losses per event in green (G) and technological (T) systems. The risk-taking attitude increases for decreasing values of αD (i.e. 50, 10, 3), while the awareness-raising attitude increases for decreasing values of µS (i.e. 0.9, 0.22, 0.05).
Resilience results are shown in through a multi-plot configuration, in which the boxes contain two bar-chart groups corresponding to green and technological systems, each having bars of different colours representing frequencies of different recovery time values: the green bars represent frequencies of low recovery time values, namely less than 1 year; the orange bars represent frequencies of medium recovery time values, namely between 1 and 15 years (i.e. less than one generation time, which is normally estimated as 20–30 years for humans); the red bars represent frequencies of high recovery time values, namely all the recoveries that took more than 15 years; and the grey bars represent frequencies of non-recoveries.
Figure 4. Recovery time frequencies for green (G) and technological (T) systems. Each group of bars refers to high (H, green), medium (M, orange) and low (L, red) resilience. The fourth bar (NR, grey) indicates frequency of non-resilient responses, namely cases of no recovery. The risk-taking attitude increases for decreasing values of αD (i.e. 50, 10, 3), while the awareness-raising attitude increases for decreasing values of µS (i.e. 0.9, 0.22, 0.05).
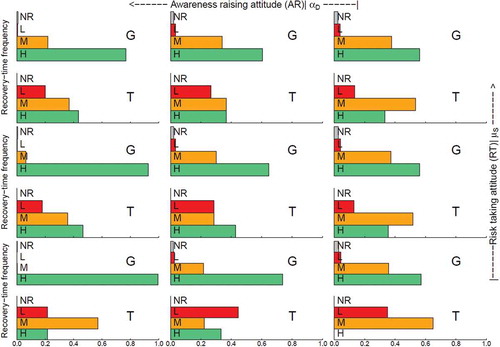
By looking at , it is evident that green systems are always more resilient. In addition, the two systems seem to respond differently to varying RTa and ARa. Green systems enhance their resilience (frequencies of short recovery times increase) for increasing ARa. The results are less sensitive to RTa, yet they show a slightly increasing resilience for decreasing risk-taking attitudes. In general, green systems are always very resilient no matter what the community attitudes are. However, technological systems show a different sensitivity with respect to ARa and RTa: their resilience increases for increasing ARa and when moving towards high RTa levels. In general, the model results encourage both systems to have high levels of ARa and at the same time discourage technological systems and encourage green systems to have low RTa levels.
5. Discussion and conclusions
This analysis was carried out by using a socio-hydrological model with the purpose of exploring social and flood-risk dynamics in an inhabited floodplain that is subject to riverine inundation events. In the adopted conceptualization, people have two ways of responding to flood events: they can implement non-structural measures only (green system), or rely also on structural measures (technological system). We introduced our analysis by posing four fundamental research questions.
The first research question was: Does the socio-hydrological model proposed by Di Baldassarre et al. (Citation2015) capture the essential dynamics of flood risk observed in two real-world case studies? The comparison of model results and observations shows the capability of the socio-hydrological model to capture the essential features of flood-risk changes and explains the dynamics emerging from the interplay of social and hydrological processes, such as adaptation and levee effects.
The second research question was: How do flood risk and losses evolve over time in different socio-hydrological systems? By looking at , it is clear that risk in technological systems is always lower. This explains why one of the most common approaches humans have used to protect themselves against frequent flooding over history has been, and still is, to increase protection. Nevertheless, notwithstanding the high level of protection and, as a consequence, the low (estimated) risk, shows that technological systems experience higher losses. It seems that risk and loss estimations do not match, when in fact they do. We define risk as (expected) losses per unit time, therefore using a probabilistic point of view, and as losses per event, i.e. average losses conditional on the fact that an event has happened, which is based on a possibilistic view. This relates with what was discussed by Blöschl et al. (Citation2013), who claimed the emergence of new approaches in hydrological risk management in order to face the challenge of being prepared for events occurring in a rapidly and unpredictably changing world. They proposed two possible approaches to hydrological (floods and droughts) risk management: top-down and bottom-up. The top-down approach is motivated by an economic paradigm, it starts at the global scale by analysing probable climatic scenarios and by cascading information to the local scale, through hydrological/hydrodynamic and economic models. Here risk is defined as the product of hazard (occurrence probability of a flood event) and consequences (damage cost in monetary terms), and therefore it is an economic measure. By following this definition, one would adopt the most economically convenient management strategies. Such an approach is very elegant, as it starts from climatic predictions and transfers information until the very end of the risk chain. Nevertheless, it is based on a probabilistic approach and deals with uncertainties at each and every level of its chain. Therefore, a question may arise: does the approach allow people to prepare for unexpected large-impact events? Predictions are usually based on a large dataset of what happened in the past, and therefore they cannot really predict what has not been observed, e.g. black swan events, for which any risk calculation is in error (Taleb Citation2007). In the present analysis, risk is estimated by following this economic-oriented definition; therefore it is not surprising that although the estimated risk is low, the average losses per event are not.
However, the bottom-up approach is socially oriented, it defines risk in qualitative terms and is not based on a probabilistic approach. It does seek solutions for people’s well-being by enhancing resilience and reducing vulnerability. The bottom-up approach is therefore based on possibilities rather than probabilities and it enables communities to be better prepared for unexpected events, such as surprises or black swans (Merz et al. Citation2015, Di Baldassarre et al. Citation2016). The solutions might not be economically efficient, but they are robust and act by following a disaster-preparedness principle, of which resilience is a key aspect.
This leads us to the third research question: Are green systems more resilient than technological systems?
Green systems prove to be much more resilient than technological ones, which suggests once again that technological systems do seek to reduce flood risk by selecting the most economically convenient strategies, rather than minimizing losses, which would be limited in highly resilient systems. There are examples around the world where a shift has been occurring from a fully structure-oriented flood-risk management approach to situations of partial floodplain reconnection. In other words, the impact of structural measures (which are predominant in technological systems) is slightly decreasing in favour of non-structural oriented approaches. Opperman et al. (Citation2009) argued for the necessity to shift the current approach in land use and policy in order to achieve economically and environmentally sustainable floodplain management. This would allow flood-risk reduction in two ways. First, flood-tolerant land uses (which would take place in reconnected floodplains) are much less vulnerable to flood damage. Second, reconnection increases the area available to store and convey flood waters. Furthermore, reconnection provides an increase in floodplain goods and services and an increase in resilience to potential climate change impacts. Opperman et al. (Citation2009) illustrated the example of California’s Yolo bypass, which was built in the 1930s when it became apparent that resorting exclusively to a “levee heightening and strengthening” approach would not have reduced flood damages sufficiently. The Yolo bypass conveys 80% of the Sacramento River flood waters during large events and, by doing so, it increases the flexibility of California’s water management infrastructure. During inundations, the bypass provides a habitat for animal species living on the floodplain as well as additional ecosystem services, such as recreation and groundwater recharge.
Dutch flood policy is another valuable example, because of its long history of providing water management solutions. Quoting Van den Brink and Meijerink (Citation2011), “The period of the 1950s and 1960s was the era of the hegemony of the technocratic discourse, the era of modernity. There was a strong belief in the possibilities for solving water management issues by taking technical engineering measures, such as the construction of dams and dikes.” Subsequently, after river floods of 1993 and 1995, it became evident that society was still vulnerable to water, and therefore people’s awareness began to increase and a shift in policy started to take place. In fact, building on the principle of integrated water management, the Room for the River policy (2000) was introduced with the aim of enlarging the discharge capacity of the Dutch main rivers by increasing the amount of space for the rivers (Van den Brink and Meijerink Citation2011).
Finally, the model provides useful insights into the performance of green and technological systems, which, as we have seen above, may actually be related to consolidated concepts in the scientific literature and to emerging approaches in flood-risk management. We now come to the fourth research question: Concerning the two real-world case studies, can we infer policy recommendations based on the model results, and to what extent? Before deriving any policy recommendation from the modelling exercise, one should note that there are no risk-free human constructions, and that, especially in highly complex, heterogeneous and unique systems (e.g. socio-hydrological systems), uncertainty elimination is infeasible (Koutsoyiannis Citation2014). Moreover, policy makers have to warn against ideological beliefs, which are biased, not science-based, and not supported by data or facts, and may prevent the development of appropriate engineering solutions, especially in countries that need them the most (e.g. low-income countries, see Koutsoyiannis Citation2011).
With this in mind, policy makers in charge of developing flood-risk management strategies in Rome and Bangladesh can use this socio-hydrological model as a tool to gain insights about future possibilities conditioned on alternative risk-reduction strategies or climate change scenarios. The model can also be used for communication purposes and to show that none of the systems can perform well over the whole spectrum of variables under consideration. In the case of Rome, the model can explain the low levels of flood-risk awareness in individuals, communities and institutions due to the prolonged absence of flooding events, and highlight the high exposure and vulnerability of the city to potentially catastrophic flooding events. In the case of Bangladesh, with increasing affordability of structural flood protection measures and the country’s increasing GDP, the model could suggest that policy and decision makers carefully consider the implementation of structural measures that can lead to path dependency, which is explained by this model as a self-reinforcing feedback: higher flood protection levels lead to fewer flooding events, which often triggers more urbanization of flood-prone areas, which then require even higher protection levels.
Finally, notwithstanding the paramount role of modelling in providing insights for policy makers about a possible system’s development, whether a given policy can actually be implemented is subject to a much more complicated institutional and decision-making process.
In general, factors such as culture and social values play a fundamental role in shaping institutional change and the implementation of new policies, and this is particularly true when it comes to interactions between humans and the environment (e.g. flood-risk management policies). Roland (Citation2004) distinguished between slow-moving institutions (e.g. values and social norms), which change slowly and continuously, and fast-moving institutions (e.g. political institutions), which change discontinuously and abruptly. Slow-moving institutions are very likely to shape change in fast-moving institutions. In the case of Bangladesh, one has to be particularly careful in relating economic development and high GDP growth rates and, as a consequence, the affordability of innovative technological solutions, to a shift into structure-oriented flood-risk management solutions. People’s values attached to water and their unwillingness to change their relationship with the water system, in this case the occurrence of seasonal floods, may compromise the implementation of any sort of solution. In the same fashion, people from Rome may be very reluctant to change their habits because of what is considered, in their perception, an unreliable threat.
Any modelling exercise has to be coupled with an evaluation of the associated social context because similar model outcomes will lead to different solutions according to the aforementioned slow and fast socio-hydrological dynamics involved. This is relevant for future research, which will focus on the application of the model to different case studies around the world.
Acknowledgements
The present work was developed within the framework of the Panta Rhei Research Initiative of the International Association of Hydrological Sciences (IAHS). The authors are grateful to two anonymous reviewers as well as the Co-editor, Demetris Koutsoyiannis, whose constructive comments considerably improved the quality of this manuscript.
Disclosure statement
No potential conflict of interest was reported by the authors.
Additional information
Funding
References
- Blöschl, G., et al., 2015. Increasing river floods: fiction or reality? Wires Water, 2, 329–344. doi:10.1002/wat2.1079
- Blöschl, G., Viglione, A., and Montanari, A., 2013. Emerging approaches to hydrological risk management in a changing world. In: R.A. Pielke Sr. and F. Hossain, eds. Climate vulnerability: understanding and addressing threats to essential resources, vol. 5. Elsevier Inc., Academic Press, 3–10. doi:10.1016/B978-0-12-384703-4.00505-0.
- Bormann, H., Pinter, N., and Elfert, S., 2011. Hydrological signatures flood trends in German rivers: flood frequencies flood heights and specific stages. Journal of Hydrology, 404 (1–2), 50–66. doi:10.1016/j.jhydrol.2011.04.019
- Casacchia, O. and Crisci, M., 2013. La popolazione dell’area metropolitana di Roma. Evoluzione demografica e previsioni al 2024. IRPPS-CNR Working Paper Series, 56. luglio. 1–78.
- Castellarin, A., Di Baldassarre, G., and Brath, A., 2011. Floodplain management strategies for flood attenuation in the river Po. River Research and Applications, 27, 1037–1047. doi:10.1002/rra.1405
- Di Baldassarre, G., Brandimarte, L., and Beven, K., 2016. The seventh facet of uncertainty: wrong assumptions, unknowns and surprises in the dynamics of human-water systems. Hydrological Sciences Journal, 61 (9), 1748–1758. doi:10.1080/02626667.2015.1091460
- Di Baldassarre, G., Castellarin, A., and Brath, A., 2009. Analysis of the effects of levee heightening on flood propagation: example of the river po, Italy. Hydrological Sciences Journal, 54 (6), 1007–1017. doi:10.1623/hysj.54.6.1007
- Di Baldassarre, G., et al., 2013a. Towards understanding the dynamic behaviour of floodplains as human-water systems. Hydrology and Earth System Sciences, 17 (8), 3235–3244. doi:10.5194/hess-17-3235-2013
- Di Baldassarre, G., et al., 2013b. Socio-hydrology: conceptualising human–flood interactions. Hydrology and Earth System Sciences, 17 (8), 3295–3303. doi:10.5194/hess-17-3295-2013
- Di Baldassarre, G., et al., 2015. Debates—perspectives on socio-hydrology: capturing feedbacks between physical and social processes. Water Resources Research, 51, 4770–4781. doi:10.1002/2014WR016416
- Di Baldassarre, G., et al., 2014. The interplay between human population dynamics and flooding in Bangladesh: a spatial analysis. Proceedings of the International Association of Hydrological Sciences, 364, 188–191. doi:10.5194/piahs-364-188-2014
- Domeneghetti, A., et al., 2015. Evolution of flood risk over large areas: quantitative assessment for the Po River. Journal of Hydrology, 527, 809–823. doi:10.1016/j.jhydrol.2015.05.043
- Keating, A., et al., 2014. Operationalizing resilience against natural disaster risk: opportunities, barriers, and a way forward. White paper. Zurich Flood Resilience Alliance.
- Koutsoyiannis, D., 2011. Scale of water resources development and sustainability: small is beautiful, large is great. Hydrological Sciences Journal, 56 (4), 553–575. doi:10.1080/02626667.2011.579076
- Koutsoyiannis, D., 2014. Reconciling hydrology with engineering. Hydrology Research, 45 (1), 2–22. doi:10.2166/nh.2013.092
- Mechler, R. and Bouwer, L.M., 2015. Understanding trends and projections of disaster losses and climate change: is vulnerability the missing link? Climatic Change. doi:10.1009/s10584-014-1141-0
- Merz, B., et al., 2015. Charting unknown waters—on the role of surprise in flood risk assessment and management. Water Resources Research, 51, 6399–6416. doi:10.1002/2015WR017464
- Opperman, J.J., et al., 2009. Sustainable floodplains through large-scale reconnection to rivers. Science, 326 (5959), 1487–1488. doi:10.1126/science.1178256
- Roland, G., 2004. Understanding institutional change: fast-moving and slow-moving institutions. Studies in Comparative International Development, 38 (4), 109–131. doi:10.1007/BF02686330
- Sivapalan, M. and Blöschl, G., 2015. Time scale interactions and the coevolution of humans and water. Water Resources Research, 51, 6988–7022. doi:10.1002/2015WR017896
- Taleb, N.N., 2007. The black swan: the impact of the highly improbable. London: Penguin.
- Van den Brink, M. and Meijerink, S., 2011. Long term institutional continuity and change in Dutch coastal zone and river management. In: C. Heip and R. Laane, eds. Aspects of coastal research in contribution to LOICZ in the Netherlands and Flanders (2002–2010). LOICZ Research & Studies No. 38. Germany: Helmholtz-Zentrum Geesthacht.
- Viglione, A., et al., 2014. Insights from socio-hydrology modelling on dealing with flood risk—roles of collective memory, risk-taking attitude and trust. Journal of Hydrology, 518 (Part A(0)), 71–82. doi:10.1016/j.jhydrol.2014.01.018
- Viglione, A., et al., 2016. Attribution of regional flood changes based on scaling fingerprints. Water Resources Research, 52. doi:10.1002/2016WR019036
- Villarini, G., et al., 2011. Analyses of seasonal and annual maximum daily discharge records for central Europe. Journal of Hydrology, 399 (3–4), 299–312. doi:10.1016/j.jhydrol.2011.01.007