
ABSTRACT
This study aimed to quantify possible climate change impacts on runoff for the Rheraya catchment (225 km2) located in the High Atlas Mountains of Morocco, south of Marrakech city. Two monthly water balance models, including a snow module, were considered to reproduce the monthly surface runoff for the period 1989‒2009. Additionally, an ensemble of five regional climate models from the Med-CORDEX initiative was considered to evaluate future changes in precipitation and temperature, according to the two emissions scenarios RCP4.5 and RCP8.5. The future projections for the period 2049‒2065 under the two scenarios indicate higher temperatures (+1.4°C to +2.6°C) and a decrease in total precipitation (−22% to −31%). The hydrological projections under these climate scenarios indicate a significant decrease in surface runoff (−19% to −63%, depending on the scenario and hydrological model) mainly caused by a significant decline in snow amounts, related to reduced precipitation and increased temperature. Changes in potential evapotranspiration were not considered here, since its estimation over long periods remains a challenge in such data-sparse mountainous catchments. Further work is required to compare the results obtained with different downscaling methods and different hydrological model structures, to better reproduce the hydro-climatic behaviour of the catchment.
EDITOR M.C. Acreman
ASSOCIATE EDITOR R. Hirsch
1 Introduction
The mountainous chain of the High Atlas in Morocco constitutes a “water tower” providing most of the water supply for the neighbouring arid plains (Chehbouni et al. Citation2008, Jarlan et al. Citation2015). In spite of the importance of snow in the regional water balance, to our knowledge, no studies have been devoted so far to the hydrological modelling of snow-driven catchments in Morocco (or in North Africa) under changing climate conditions, while several such studies have been performed for mountainous ranges in Europe (Dobler et al. Citation2012, Gobiet et al. Citation2014, Ruelland et al. Citation2015, Szczypta et al. Citation2015), North America, (Furey et al. Citation2012), South America (Hublart et al. Citation2013) and Asia (White et al. Citation2014). However, this type of modelling is necessary to evaluate climate change impacts on water resources for this mountainous area in order to develop adaptation strategies.
Future climate projections indicate a possible temperature increase of 2–3°C for the Mediterranean basin by 2050, which might be associated with a decrease in precipitation of about 20–30% (Giorgi and Lionello Citation2008, Schilling et al. Citation2012). Most projections for North Africa agree on a future decrease of precipitation associated with a temperature increase, notably over Morocco (Schilling et al. Citation2012). These changes in the Mediterranean mountains may be associated with earlier declines in high flows from snowmelt in spring and increasing water resource uncertainty because of the reduced influence of snow accumulation and snowmelt processes (Garcia-Ruiz et al. Citation2011). The changes projected at the regional scale need to be analysed at the basin scale, which is relevant for water management. A common approach for hydrological impact studies of climate change at the basin scale is to use hydrological models with scenarios provided by climate model outputs downscaled to the catchment of interest (e.g. Etchevers et al. Citation2002, Chiew et al. Citation2009, Tramblay et al. Citation2013). Various downscaling methods exist to bridge the gap between the coarse outputs of global climate models (GCMs) and catchments (Teutschbein and Seibert Citation2013). These methods range from statistical approaches, requiring local calibration (Piras et al. Citation2015), to dynamical approaches, such as regional climate models (RCMs), that do not require such local calibration, thus providing added value in data-sparse catchments (Tramblay et al. Citation2013). For the Mediterranean region, a new generation of RCM simulations provided by the Med-CORDEX initiative (Ruti et al. Citation2016) is aimed at increasing the reliability of information on regional climate and understanding the processes responsible for the variability and evolution of the Mediterranean climate.
The hydrological impacts of climate change have been assessed across Mediterranean catchments using a variety of models, ranging from conceptual (Hreiche et al. Citation2007, Majone et al. Citation2012, Milano et al. Citation2013, Tramblay et al. Citation2013, Fiseha et al. Citation2014, Lespinas et al. Citation2014, Ruelland et al. Citation2015) to physically-based ones (Quintana Seguí et al. Citation2010, Senatore et al. Citation2011, Fatichi et al. Citation2014, Smiatek et al. Citation2014). However, the choice of hydrological model is strongly dependent on data availability and could also influence future projections (Bosshard et al. Citation2013). In order to provide future projections, hydrological models must be able to reproduce adequately various climatic conditions, which implies using data to calibrate and validate the models over long time periods (Vaze et al. Citation2010). As noted by Blöschl and Montanari (Citation2010), a long observation period is required to better understand the relationships between climate and hydrology and the long-term variations in the data. In developing countries with data-sparse networks, this makes the use of complex and physically-based process models difficult, partly due to the lack of long-term measurements necessary to run such models and to validate intermediate processes taken into account by complex mechanistic models. That is why a parsimonious conceptual model has been favoured for this initial study as regards the available data. However, since conceptual models require calibration, which can also compensate for systematic errors in the data, they may fail under conditions different from those used for calibration (Klemeš Citation1990, Refsgaard et al. Citation2014, Thirel et al. Citation2015).
This study builds upon existing studies for the High Atlas catchments in Morocco, providing datasets available for the present work and a detailed description of the catchment function. Previous studies have focused on (a) the monitoring of snow by remote sensing (Schulz and De Jong Citation2004, Chaponnière et al. Citation2005, Boudhar et al. Citation2010, Marchane et al. Citation2015), (b) the modelling of snow cover and runoff using hydrological models such as GR4J and SWAT (Chaponnière et al. Citation2008, Simonneaux et al. Citation2008, Boudhar et al. Citation2009), and (c) the evaluation of the water and energy balance of the snowpack at the station scale (Schulz and De Jong Citation2004, Boudhar et al. Citation2016). These studies highlighted the significant spatiotemporal variability of snow cover and its sensitivity to climate variability, and the importance of sublimation in the ablation of snowpack at high altitudes. These characteristics are typical of the semi-arid climate encountered in the High Atlas, where elevations reach about 4000 m a.s.l. Indeed, the rugged topography and the steep slopes of the basins result in strong spatiotemporal variability of the weather conditions. The aridity and intense solar radiation (with low relative humidity of the air) are notably responsible for the non-negligible contribution of sublimation to snow ablation by contrast with temperate basins, of between 20% and 44% in the Atlas Mountains, according to Schulz and De Jong (Citation2004) and Boudhar et al. (Citation2016).
The objective of this paper is to quantify possible climate change impacts on runoff in the Rheraya catchment. To this end, two hydrological models, each with a snow module, are first run to reproduce runoff at the catchment outlet. Then, an ensemble of regional climate models is considered in order to produce precipitation and temperature scenarios that are then incorporated in the hydrological simulations via a perturbation approach. In Section 2, the study area and the available datasets are presented; in Section 3, we describe the hydrological models, together with the methods used to create future scenarios; Section 4 shows the results; and in Section 5 the results are discussed.
2 Study area and datasets
2.1 The Rheraya catchment and in situ measurements
The catchment area of Rheraya (225 km2) is located in the High Atlas Mountains, 40 km south of the city of Marrakech, between latitudes 30°10ʹN and 30°20ʹN, and longitudes 7°40ʹW and 8°W. The catchment presents a large altitudinal gradient with elevations ranging from 1027 m to 4167 m at the top of Mount Toubkal, the highest point of North Africa (). The characteristics of the Rheraya catchment are presented in . The climate is semi-arid, precipitation is very irregular in space and time (Chaponnière et al. Citation2008), and the annual peak runoff occurs in spring due to snowmelt (). The relative contribution of snowmelt to annual streamflow is between 30% and 48%, depending on the year (Boudhar et al. Citation2009).
Table 1. Catchment characteristics.
Figure 1. Location of the Rheraya catchment.
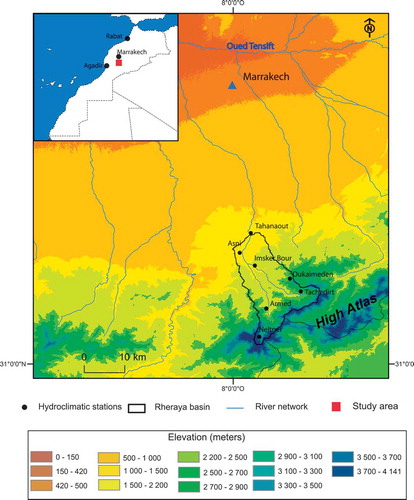
Figure 2. Mean inter-annual (a) daily precipitation, (b) temperature and (c) runoff for the Rheraya catchment.
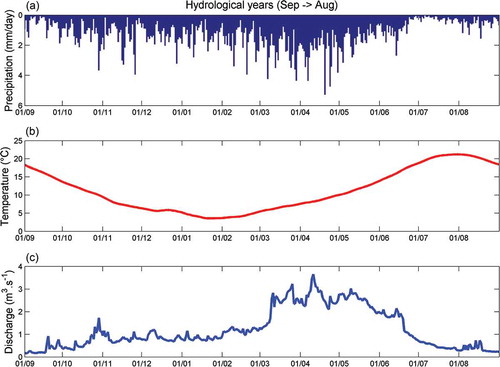
Despite the low density of meteorological stations in the Rheraya catchment, it is the most densely instrumented sub-basin of the High Atlas. The data considered in the present study have been collected and processed in the work of Simonneaux et al. (Citation2008), Chaponnière et al. (Citation2008) and Boudhar et al. (Citation2009). The station network in the Rheraya catchment was set up in the framework of the SUDMED (Chehbouni et al. Citation2008) and LMI TREMA (Khabba et al. Citation2013, Jarlan et al. Citation2015) programmes. For this study we used daily data for precipitation recorded at the Tahanaout (1027 m) and Oukaimeden (2650 m) stations for the period 1989‒2009. The Oukaimeden station also has measurements of snow heights carried out by the staff of the Club Alpin Français (CAF). The precipitation series over the Rheraya catchment, including both liquid and solid measurements, were computed by Simonneaux et al. (Citation2008). In addition, average, maximum and minimum daily temperature data were collected at the Aremd, Imskerbour, Neltner, Oukaimeden and Tachedirt stations for the period 2007–2013. For the Aremd station, other available variables include relative humidity, wind and solar radiation for the same period (2007–2013). shows the seasonal variability of precipitation, temperature and runoff. A decrease in runoff is observed at Tahanaout, with a shift towards drier conditions around the year 1997 (Simonneaux et al. Citation2008). No clear trend could be found in precipitation; however, a slight decrease in snow amount at the Oukaimeden station might be a cause of the declining runoff. No significant trends were detected in the temperature records.
The runoff data used in this work were collected at the Tahanaout station for the period 1989‒2009, using a stage–discharge relationship designed by the water management agency of the Tensift basin (ABHT). Since the runoff is measured based on a scale in an unstable rocky bed, the section is sensitive to change as strong events occur, which requires frequent updating of the rating curves (Simonneaux et al. Citation2008). The hydrological simulations were thus only evaluated at the monthly time step in order to limit the errors that can be expected in the daily discharge values.
2.2 Climate model outputs from the Med-CORDEX initiative
In this study, five RCM simulations with a horizontal resolution of 50 km were used. These selected simulations belong to core simulations of the Med-CORDEX initiative (http://www.medcordex.eu), which aims to produce for the Mediterranean region a set of simulations at different resolutions taking into account the specificity of the Mediterranean climate (). Different GCM/RCM combinations were considered to assess the uncertainty in future projections.
Table 2. Med-CORDEX simulations available at 50 km resolution (MED 44 grid). GUF: Goethe University Frankfurt; IPSL:Institut Pierre Simon Laplace; CNRM: Centre National de Recherches Météorologiques; ICTP: International Centre for Theoretical Physics; CMCC: Centro Euro-Mediterraneo sui Cambiamenti Climatici.
For each model, the following climate simulations were selected:
Evaluation runs (EVAL): simulations for the control period 1979‒2005, with the RCMs forced by ERA-Interim reanalysis (Dee et al. Citation2011). This allows the RCM outputs to be evaluated in comparison to the observed data.
Historical runs (HIST): simulations for the control period (1950‒2005, depending on the model) with RCMs forced by the different GCMs indicated in .
Scenario runs (RCP4.5 /RCP8.5): simulations for future projections (2005‒2100) with RCMs forced by different GCMs according to the emissions scenarios RCP4.5 and RCP8.5.
3 Method
3.1 Monthly water balance models
Two conceptual monthly water balance models were considered, the Génie Rural à 2 paramètres model (GR2M) proposed by Mouelhi et al. (Citation2006) and the monthly water balance model (MWBM) of McCabe and Markstrom (Citation2007). Both rely on a snow accumulation and melt model described in McCabe and Wolock (Citation1999), whose inputs are monthly temperature and precipitation. The occurrence of snow is computed as:
where S is monthly snowfall (mm), P is monthly precipitation (mm), Ta is monthly air temperature (°C), Train is a threshold above which all monthly precipitation is rain, and Tsnow is a threshold below which all monthly precipitation is snow (McCabe and Wolock Citation1999). Between Train and Tsnow the proportion of precipitation that is snow or rain changes linearly. If snow occurs in a given month, it is added to the snowpack and is subject to melt if conditions are such that melting can occur. Snowmelt is computed as a fraction of snow storage by:
where MF is the fraction of snow storage that can be melted in a month; MF increases from 0 at Tsnow to MaxMelt at and above Train. The MaxMelt parameter specifies the proportion of snowpack that becomes runoff (McCabe and Wolock Citation1999, McCabe and Markstrom Citation2007).
In the GR2M model, the production function relies on a soil moisture store, fed by net precipitation obtained from precipitation and potential evapotranspiration (Mouelhi et al. Citation2006), and snowmelt runoff. The parameter X1, the maximum capacity of the production store, is positive and is given in mm. The parameter X2 is the exchange coefficient, it is positive and has no dimension. Similarly, in the MWBM a soil moisture store receives net precipitation and snowmelt runoff; it has a soil moisture storage capacity denoted SMSC in mm. The Drofac parameter specifies the fraction of monthly precipitation that becomes direct runoff. The Rfactor parameter specifies how much surplus in a month becomes runoff. Hence the GR2M model has five parameters to calibrate and the MWBM six parameters, three of which are from the snow model. The inputs of the hydrological models are the total precipitation (P), produced by Simonneaux et al. (Citation2008) from the liquid precipitation recorded at Tahanaout and solid precipitation at Oukaimeden, temperature (T) and potential evapotranspiration (PET).
3.2 Model calibration and assessment of parameter uncertainties
The calibration of model parameters requires the definition of a function quantifying the model error that is a measure of the difference between the observed and simulated runoff. The quantitative criterion used to measure the quality of adjustments made by the model is the multi-objective Kling-Gupta efficiency (KGE) criterion introduced by Gupta et al. (Citation2009) and modified (KGE′) by Kling et al. (Citation2012). As noted by Gupta et al. (Citation2009), if solely the Nash-Sutcliffe criterion is used for calibration in basins with high runoff variability, the bias component will have a smaller contribution to the optimization of the Nash-Sutcliffe criterion, possibly leading to model simulations having large volume errors. The KGE′ combines linear correlation, bias and variability measures between observed and simulated runoff (Kling et al. Citation2012), and the higher the KGE′ value the better the agreement between the simulations and observations:
with:
where r is the Pearson product-moment correlation coefficient, μ is the mean runoff (m3/s), CV is the coefficient of variation and σ is the standard deviation of the runoff. The variables KGE′, r, β and γ are dimensionless and their optimum value is 1. Parameter calibration was carried out by maximizing the KGE′ using the Nelder-Mead simplex technique (Lagarias et al. Citation1998).
The performance of the hydrological models was estimated using different cross-calibration and validation periods to evaluate the transferability of the parameters under hydrologically contrasting conditions (see e.g. Andréassian et al. Citation2009). The first two methods were based on the split-sample test (SST) and the differential split-sample test (DSST) (Klemeš Citation1986). The SST is the most commonly used method in hydrology and involves dividing the data into two samples, one for calibration and the other for validation (here Period1 is 2000‒2009 and Period2 is 1989‒1999). The DSST consists of separating the period available into independent sub-periods and with different climatic characteristics between the periods, calibrating the model on the first period and validating it on the second, and vice versa. According to the median annual precipitation, the years were split into years wetter than the median (hereafter named Humid years) or drier than median (dry years). Therefore the wet and dry years are not necessarily continuous. In addition, a third method based on stratified sampling was considered. This method divides the time series into even years (Running1) and odd years (Running2), which allows one to account for possible trends in the climatic series (precipitation, temperature or flow). By using these three different calibration–validation schemes, six different parameter sets were obtained by calibration over the different periods considered (Period1, Period2, Humid years, Dry years, Running1, Running2) and used to assess the robustness of the model and the stability of its performance under different climatic conditions.
3.3 Estimation of potential evapotranspiration
Potential evapotranspiration (PET) is a key input variable for hydrological models, and its estimation in mountainous regions remains a major challenge (Herrnegger et al. Citation2012). To reduce the potential uncertainties related to the PET calculation, three formulas were compared over the period 2007‒2013 when many meteorological variables (temperature, relative humidity, wind and solar radiation) were available at the Aremd station. The three PET computations include, in order of complexity in their data requirements:
the Oudin (Oudin et al. Citation2005) formula, requiring only daily mean temperature and latitude;
the Hargreaves and Samani (Citation1985) formula, requiring the average daily mean, maximum and minimum temperatures; and
the FAO–Penman-Monteith (Allen Citation1998) equation, requiring mean, minimum and maximum temperatures, relative humidity, wind speed and solar radiation.
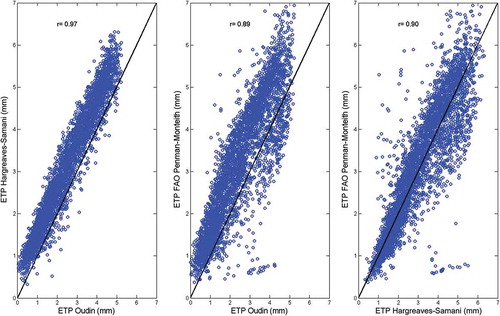
As shown in , the correlation between PET values computed using the three formulas is high, with correlation coefficients greater than 0.89. In particular, PET values computed using the FAO–Penman-Monteith and Hargreave-Samani equations are quite similar, as already noted by Er-Raki et al. (Citation2010) in the plain downstream of the Rheraya catchment. The Oudin formula provides PET values slightly lower than the two other equations. When used as input for the hydrological models, no significant differences were found between monthly simulated runoff with the three different PET formulations. As previously noted by Oudin et al. (Citation2005), conceptual hydrological models may not be very sensitive to the PET formulations as long as their calibration allows the water balance to be adjusted. As a consequence, the Oudin formula was retained for this study and served to compute a mean annual cycle of PET from the available daily temperature data (2007‒2013).
Figure 3. Correlation between PET computed using the Oudin, Hargreaves-Samani and Penman-Monteith formulas.
3.4 Construction of climate scenarios based on RCM outputs
Most often, bias-correction methods are considered with RCM outputs to produce future projections (Fowler et al. Citation2007). However, such methods assume that the bias in climate model outputs is stationary over time. Driouech et al. (Citation2010), Maraun (Citation2012) and Tramblay et al. (Citation2013) have shown that this hypothesis could not be always validated in semi-arid regions such as Morocco. In addition, the bias correction of individual RCM variables may have an impact on the climate change signal, in particular in mountainous areas, since several variables are needed to reproduce snow dynamics (Dobler et al. Citation2012). Another reason not to use bias correction in the present study is the very low density of climatic gauges with long-term records (two stations for precipitation only), by comparison with the relatively coarse resolution of RCM outputs (50 km).
For the aforementioned reasons, perturbation methods were preferred for the present study. These methods rely on perturbing the observed series by a climate change factor, inferred from the comparison of RCM simulations between the historical and future periods. The so-called “delta-change” method is both simple and robust since it does not rely on any stationarity hypothesis and has been widely applied in the evaluation of the impacts of climate change (e.g. Wilby and Harris Citation2006, Minville et al. Citation2008, Dobler et al. Citation2012). The series of monthly averages of temperature and precipitation between the periods 1989‒2005 and 2049‒2065 were modified with a monthly change factor to obtain future climate scenarios (via an additional factor for temperature and a multiplicative factor for precipitation). The main limitation of such a method is that it does not account for the possible change in the distribution of extreme events, which can be important to consider in a semi-arid context with few precipitation days.
Therefore, in addition to the delta-change method, a quantile-perturbation method (Chiew et al. Citation2009), described in detail in Tramblay et al. (Citation2013), was also used to produce future climate scenarios for precipitation. In comparison to the delta-change method, which considers only the monthly means, in the quantile-perturbation approach all the daily quantiles of the distributions are compared between the historical and the future periods, thus reflecting possible changes in extreme precipitation events. The computation was done for each month separately, between an observed period (CTRL), a simulation during the observation period (SIM) and a projected future period (PROJ). The approach followed these steps (Tramblay et al. Citation2013):
Identification of the frequency of dry days (when P < 0.1 mm) in CTRL, SIM and PROJ.
If the amount of dry days increases between SIM and PROJ, the corresponding amount of additional wet days in CTRL is randomly changed into dry days (100 randomly perturbed series (PERT) were generated).
If the amount of dry days decreases between SIM and PROJ, the corresponding amount of dry days is randomly changed into wet days in CTRL. The “new” wet days are randomly selected from wet days in CTRL (100 randomly perturbed series (PERT) were generated).
For each PERT series perturbed in steps (b) or (c), the empirical quantiles are adjusted by the change factor (CF) between the PROJ and SIM quantiles for the corresponding probabilities p:
4 Results
4.1 Assessment of RCM simulations in the reference period
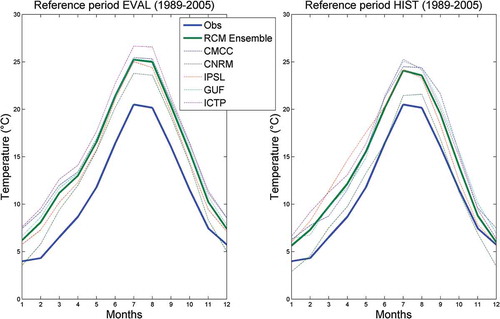
This section assesses the quality of RCM simulations in the historical period 1989‒2005 by comparing the seasonal distributions of observed and simulated temperature and precipitation. shows the monthly variations in the observed temperature and those simulated by RCM available for the evaluation (EVAL) and historical periods (HIST). All RCMs reproduce the general shape of observed temperature well, but with an overestimation of 3–6°C. However, this comparison can be considered biased by the fact that RCM grid size is equal to 2500 km2 while the target basin area is only 225 km2. We do not have observed temperature and precipitation data spread over such an area (2500 km2) to compare the RCM simulations and observations at the same scale. Therefore this overestimation is expected as the complex orography of the Atlas is largely smoothed at the grid size of a RCM.
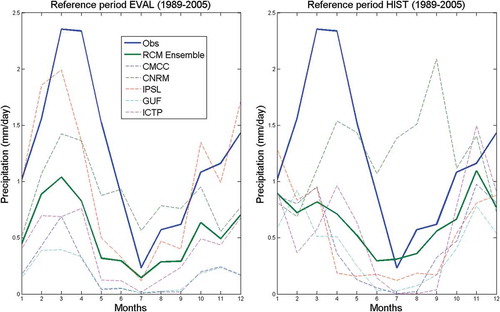
Figure 4. Observed and RCM temperatures during the reference period 1989–2005.
Regarding precipitation, shows the annual cycle simulated by the RCMs for the period 1989‒2005 compared to observed precipitation. Most RCMs underestimate precipitation, except the CNRM model, which strongly overestimates summer precipitation. For the evaluation period (EVAL), there is better reproduction of seasonality than in the historical period (HIST), with the maximum precipitation reproduced in March and the minimum in July. As observed in previous studies, precipitation simulated by RCMs is not precise enough to be used as input in hydrological models (Tramblay et al. Citation2013).
Figure 5. Observed and RCM precipitation during the reference period 1989–2005.
4.2 Projected changes in temperature and precipitation
In this part, we analyse the future changes in temperature and precipitation for the catchment according to the RCP4.5 and RCP8.5 scenarios between the historical period 1989‒2005 and the projection period 2049‒2065. The latter was chosen to evaluate changes at the medium term.
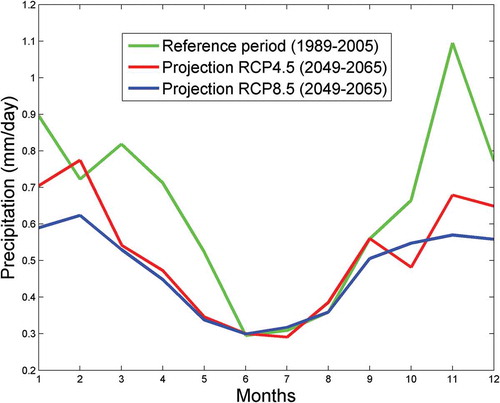
shows the projected monthly precipitation from the multi-model ensemble mean with the two RCP scenarios. shows the climate change signal for each model, in relative values for precipitation (%) between the periods 1989‒2005 and 2049‒2065. The results show that all the climate simulations lead to a decrease in precipitation. This decrease appears particularly pronounced during winter and spring. The projected changes in precipitation are −22% in the RCP4.5 scenario and −31% for the RCP8.5 scenario. However, there are significant differences in the magnitude of these changes for different RCMs (). Note that the RCM IPSL projects the largest precipitation decrease, with −38% for the RCP4.5 scenario and −49% for the RCP8.5 scenario.
Table 3. The precipitation change signal (%) between 1989–2005 and 2049–2065 for each climate model and scenario.
Figure 6. Projected precipitation for the future period 2049–2065.
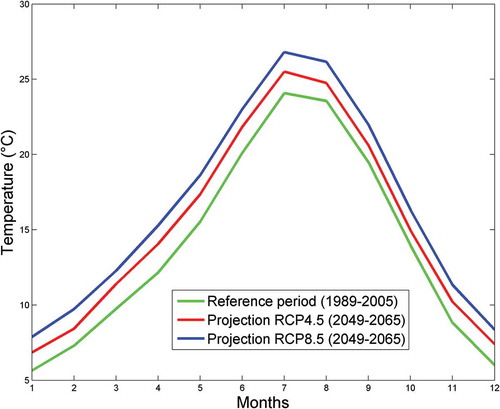
For temperature, shows the projected temperature cycle according to the two RCP scenarios. shows the climate change signal for each model, in absolute values of temperature, between the periods 1989‒2005 and 2049‒2065. It can be seen that both scenarios suggest a significant increase in temperature. On average, projected changes in temperature are +1.4°C for the RCP4.5 scenario and +2.6°C for the RCP8.5 scenario. In comparison to precipitation, these changes are relatively uniform throughout the year, with a larger increase in the summer months. During this season, the temperature changes are likely to have little impact on flows because there is almost no runoff or snow cover during the summer, while the increases in winter and spring temperatures could have a significant impact on the snow, reducing the period of snow cover and thus snow volumes available.
Table 4. The temperature change signal (°C) between 1989–2005 and 2049–2065 for each climate model and scenario.
Figure 7. Projected temperature for the future period 2049–2065.
4.3 Hydrological modelling results
and present the KGE′ values obtained for each calibration period (Period1, Period2, Humid years, Dry years, Running1, Running2; see Section 3.2) and the model parameter values. The KGE′ values range between 0.79 and 0.87 for calibration with the GR2M (), and between 0.64 and 0.8 for the MWBM (). In validation, the criterion values are only slightly degraded, with values between 0.44 and 0.68 for both models. The mean KGE′ over all calibration samples is 0.83 for the GR2M and 0.74 for the MWBM. On average, from the different calibration experiments, the relative bias on simulated runoff is 4% for the GR2M and 7% for the MWBM. It can be concluded from the analysis of KGE′ and model parameter values that there is relative stability of the results over the different calibration and validation periods. The drop in performance is most important when the model is validated using a standard SST on two periods (Period 1, Period 2). This is an indication that some changes affecting the rainfall–runoff relationship, such as land-use change, could have occurred in the catchment during the 1989‒2009 period.
Table 5. Calibration and validation results of the MWBM.
Table 6. Calibration and validation results of GR2M.
The analysis of hydrological simulations shows that both the GR2M and MWBM are able to correctly reproduce the shape of the observed monthly hydrographs (). The inter-annual mean monthly runoff dynamics are well reproduced; the six model runs with different parameter sets obtained for different calibration strategies encompass the observed runoff regime, except for the months of October and November (), when the GR2M model underestimates runoff while the MWBM overestimates it. In addition, the snow reservoir levels simulated by the model appeared realistic (as shown later, in ), with snow accumulation between November and May, although no distributed snow data over the catchment are available to validate this result.
Figure 8. Observed and simulated mean runoff cycles for the reference period 1989–2009, according to different sets of calibrated parameters for the GR2M and MWBM.
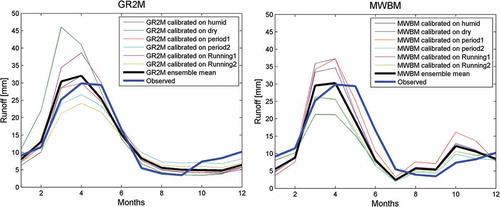
Figure 9. Comparison of the projected changes in runoff with delta-change and quantile-perturbation methods.
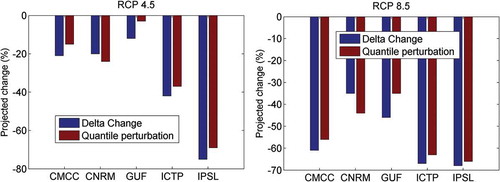
Figure 10. Projected changes in runoff from five RCM simulations for the future period 2049–2065.
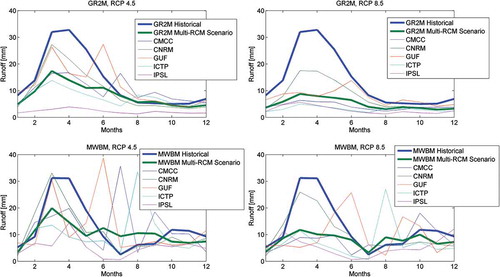
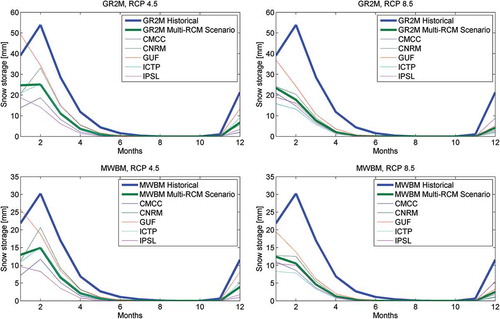
Figure 11. Projected changes in snow reservoir levels from five RCM simulations for the future period 2049–2065.
In order to produce runoff scenarios while keeping the whole uncertainty on the parameter estimates, no selection of the “best parameter set” was made for the projections: the hydrological model ensemble mean simulations obtained from the six parameter sets (the “ensemble mean simulation” as shown in ) was considered as the reference simulation for the historical time period.
4.4 Future projections on streamflow and snow amounts
As mentioned above, the monthly runoff values simulated from the observed data with six sets of parameters for each hydrological model were averaged to produce a single simulation at the monthly time step, reflecting the uncertainty related to the transferability of the hydrological model parameters towards climate-contrasted conditions. These reference simulations (shown in by the curves “GR2M ensemble mean” and “MWBM ensemble mean”) were then compared to future hydrological projections, obtained from the two hydrological models driven by perturbed observed climatic series, to assess the changes in monthly flows. The time series of observed precipitation and temperature were perturbed, according to a change signal simulated by the different RCMs between the 1989‒2005 and 2049‒2065 periods, using the delta-change or quantile-perturbation methods (see Section 3.4). The time series obtained were then used as input in the GR2M and MWBM, with the six sets of parameters described above, to obtain for each scenario RCP4.5 and RCP8.5 an average monthly runoff for the period 2049–2065.
Before analysing in detail the potential impact of climate change on catchment runoff, we first compare the impact on runoff of projected changes in precipitation only, based on the two perturbation methods tested: the delta-change by monthly factors and the quantile-perturbation method considering the full distribution of precipitation changes. shows the simulated runoff changes due to precipitation changes only, with the GR2M and MWBM according to the two methods for the two RCP scenarios at the mid-term horizon. The changes are almost identical according to the two methods, with for the RCP4.5 scenario −34% projected for the delta-change method and −30% for the quantile-perturbation method, and −68% and −66% respectively for the RCP8.5 scenario. This indicates that both methods give very similar results at the monthly time scale. The following results are presented using the delta-change approach with monthly change factors only.
shows the relative changes in monthly runoff simulated between the periods 1989‒2005 and 2049‒2065 for all RCMs and for both RCP scenarios. Overall, most climate scenarios lead to a significant decline in spring flows (March–May). Some RCMs suggest an increasing runoff for some seasons, such as GUF, CMCC and ICTP under the RCP4.5 scenario in late spring and summer. Considering the projections resulting from each of the RCMs (), high uncertainty is observed between the different models, although on average all agree on a decline. Under scenario RCP4.5, the projected decline in runoff is −38.5% for the GR2M and −19.2% for the MWBM, and with scenario RCP8.5, the projected decline in runoff is −62.9% and −37.5%, respectively.
The decline suggested by the RCP8.5 scenario is more marked than for the RCP4.5 scenario, especially in spring and autumn, while in summer and winter projected changes are of lesser amplitude. shows the changes in monthly levels of the snow reservoir simulated in the hydrological models between 1989‒2005 and 2049‒2065. Due to the increased temperature in the degree-day component of the snow module, the model simulates a significant decrease in snowfall in favour of liquid precipitation. This necessarily leads to a decrease in snow amounts, while the snow period is reduced. These results indicate that the impacts of climate change could be severe by 2050, with a major reduction in surface runoff during the spring, summer and autumn, and a considerable reduction in snow cover.
It should be noted that future changes in PET were not considered, since the formula of Oudin et al. (Citation2005) is based only on temperature. Indeed, with such a formula, increasing temperature would increase PET, but several studies have shown that, despite increased temperature, a decrease in the evaporative demand could be observed related to a decrease in the radiation, humidity or wind (Johnson and Sharma Citation2010, Sheffield et al. Citation2012). Nevertheless, sensitivity tests have shown that it is mainly the joint decrease of precipitation with increase in temperature that is reducing the runoff in the Rheraya catchment. If in addition to changes in precipitation and temperature an increase in PET is considered, computed from the climate scenarios according to the Oudin formula, the impact on runoff would be minimal (with an additional change of −3% to −10% in runoff, according to the two scenarios, not shown).
5 Discussion
The strongest uncertainties are most often related to the choice of climate models and scenarios, as noted by many studies (Minville et al. Citation2008, Chiew et al. Citation2009, Quintana Seguí et al. Citation2010, Dobler et al. Citation2012, Majone et al. Citation2012). However, hydrological model uncertainty could also have an important role (Bosshard et al. Citation2013). In the present work, an ensemble of simulations was considered at a moderate spatial resolution (50 km). More simulations at higher resolution (12 km) are becoming available for the Euro-Mediterranean domain, but a recent study by Tramblay et al. (Citation2013) in north Morocco showed that projected changes were similar at the 12 km and 50 km resolutions. However, this needs to be tested in further studies and in other catchments when a sufficient ensemble of high-resolution RCM simulations becomes available. Additionally, in the present study two perturbation approaches, based on monthly changes and on the daily quantiles of the distributions, were compared. Other downscaling approaches could also be tested to provide a broader range of projections according to different methods. In particular, there is a need to adapt the bias-correction methods in the semi-arid context, to overcome issues related to the validation of quantile-mapping bias-correction methods in semi-arid regions and to account correctly for extreme events (see e.g. Maraun Citation2012, Tramblay et al. Citation2013).
This study provides climate-driven quantitative estimates of the projected changes in runoff for the Rheraya basin; consequently, these results need to be complemented and completed by other studies with different hydrological or land-surface models, able to consider the possible feedback effects between the atmosphere and the land surface. In particular, the snow dynamics are modelled here via quite a simple degree-day approach, and the results of the present study could be compared to further work considering more complex energy-balance models (Boone and Etchevers Citation2001, Liston and Elder Citation2006, Magand et al. Citation2014). However, the application of such models in a data scarcity context remains challenging. As noted by Dobler et al. (Citation2012), an improved understanding of the physical processes governing future river flows can help to better estimate the uncertainties related to this type of impact studies. In addition, no changes in land use have been considered in the present study. Since most parts of the catchment exhibit steep slopes and high elevation, the vegetation cover remains limited and the stability of the hydrological model results indicated no major land-use changes occurred to modify the rainfall–runoff processes. However, the lowest elevation areas near the stream bed are cultivated, mainly as orchards; therefore, changes in land use or agricultural practice may have an effect on runoff processes in the future (Cristea et al. Citation2014) and there is a need to test models able to account for this type of anthropogenic activity (Szczypta et al. Citation2015).
In the present study PET was not modified in the future scenarios. However, we tested the simple hypothesis of an increase in PET proportional to the temperature increase. The impact of PET changes on runoff was less notable than that of precipitation changes. As observed by Kingston et al. (Citation2009), most climate change studies indicate an increase in PET associated with a warming climate, but very strong differences can be found between the PET models (Sheffield et al. Citation2012). As shown by Sheffield et al. (Citation2012), a decreasing trend in the global average of the Palmer drought severity index (PDSI) is detected when the PDSI is computed with PET derived from temperature only, but no trend is found when PET is computed with the Penman-Monteith equation. In semi-arid areas, water losses via evapotranspiration for vegetation and via sublimation for snow are important and not properly taken into account by simple conceptual models (Boudhar et al. Citation2009). In particular, feedback effects are neglected using this type of model; indeed, with increasing surface temperature the sublimation could decrease and then produce more ablation by melting, and as a consequence reduce the projected decline in surface runoff. As noted by Adam et al. (2009), earlier snowmelt could increase water availability at a time of year when the evaporative demand is relatively low, which could have a negative feedback on annual evapotranspiration. In contrast, loss of snowpack could lead to an earlier removal of snow cover and an increase in albedo, leading to a positive feedback on evapotranspiration due to increased net radiation. Therefore, there is a need to take into account additional variables linked to the evapotranspiration processes to produce future scenarios (Johnson and Sharma Citation2010).
6 Summary and conclusions
This study is the first attempt, to our knowledge, to evaluate quantitatively the possible future climate change impacts in a mountainous catchment in North Africa. The study focused on the Rheraya catchment (225 km2) located in the High Atlas Mountains in southern Morocco, where sufficient measurements over a relatively long time period were available to perform such a study with simple yet robust methods. Two conceptual models including a snow module were considered to reproduce the monthly dynamics of runoff in the catchment, and the uncertainty of its calibrated parameters was assessed using six contrasted periods for model calibration and validation. Model performance was found adequate to reproduce monthly runoff dynamics, considering the available data. To provide future scenarios, an ensemble of five regional climate models from the Med-CORDEX initiative was considered together with a delta-change and a quantile-perturbation method. Using the future climate simulations with the hydrological model revealed that surface runoff is expected to decline at the mid-term horizon in the Rheraya catchment. The evaluation of simulated precipitation by RCMs showed a strong underestimation of about 50%, but a good reproduction of the temperature cycle. The future projections for 2049–2065 under the two scenarios RCP4.5 and RCP8.5 showed increasing temperature (+1.4°C to +2.6°C) in conjunction with a decrease in total precipitation (−19% to −31%). Projected changes indicated a decrease in surface runoff (−19% to −63%, depending on the scenario and hydrological model) and a significant decrease in snow amounts, related to reduced precipitation and increased temperature. Despite the potential limitations of this type of approach, this is a first step towards the assessment of future projected changes in surface water resources in Morocco using climate models, which needs to be complemented by other studies comparing different hydrological and climate models.
Acknowledgements
The authors are grateful to the Water Management Agency of the Tensift Basin (ABHT) in Marrakech for providing the necessary data for this study.
Disclosure statement
No potential conflict of interest was reported by the authors.
Additional information
Funding
References
- Allen, R.G., et al., 1998. Crop evapotranspiration, guidelines for computing crop water requirements. In: Irrigation and drain, Paper No. 56. Rome: FAO, 300 pp.
- Andréassian, V., et al., 2009. HESS Opinions “Crash tests for a standardized evaluation of hydrological models”. Hydrology and Earth System Sciences, 13, 1757–1764. doi:10.5194/hess-13-1757-2009
- Blöschl, G. and Montanari, A., 2010. Climate change impacts—throwing the dice? Hydrological Processes, 24, 374–381.
- Boone, A. and Etchevers, P., 2001. An intercomparison of three snow schemes of varying complexity coupled to the same land surface model: local-scale evaluation at an alpine site. Journal of Hydrometeorology, 2, 374–394. doi:10.1175/1525-7541(2001)002<0374:AIOTSS>2.0.CO;2
- Bosshard, T., et al., 2013. Quantifying uncertainty sources in an ensemble of hydrological climate-impact projections. Water Resources Research, 49 (3), 1523–1536. doi:10.1029/2011WR011533
- Boudhar, A., et al., 2016. Energy fluxes and melt rate of a seasonal snow cover in the Moroccan High Atlas. Hydrological Sciences Journal, 61 (5), 931–943.
- Boudhar, A., et al., 2010. Long-term analysis of snow-covered area in the Moroccan High-Atlas through remote sensing. International Journal of Applied Earth Observation and Geoinformation, 12, 109–115. doi:10.1016/j.jag.2009.09.008
- Boudhar, A., et al., 2009. Evaluation of the snowmelt runoff model in the Moroccan High Atlas Mountains using two snow-cover estimates. Hydrological Sciences Journal, 54 (6), 1094–1113. doi:10.1623/hysj.54.6.1094
- Chaponnière, A., et al., 2008. Understanding hydrological processes with scarce data in a mountain environment. Hydrological Processes, 22, 1908–1921. doi:10.1002/(ISSN)1099-1085
- Chaponniere, A., et al., 2005. A combined high and low spatial resolution approach for mapping snow covered areas in the Atlas mountains. International Journal of Remote Sensing, 26 (13), 2755–2777. doi:10.1080/01431160500117758
- Chehbouni, A., et al., 2008. An integrated modelling and remote sensing approach for hydrological study in semi-arid regions: the SUDMED program. International Journal of Remote Sensing, 9, 25161–25181.
- Chiew, F.H.S., et al., 2009. Estimating climate change impact on runoff across southeast Australia: method, results, and implications of the modeling method. Water Resources Research, 45, W10414. doi:10.1029/2008WR007338
- Cristea, N.C., et al., 2014. Modelling how vegetation cover affects climate change impacts on streamflow timing and magnitude in the snowmelt-dominated upper Tuolumne Basin, Sierra Nevada. Hydrological Processes, 28, 3896–3918. doi:10.1002/hyp.v28.12
- Dee, D.P., et al., 2011. The ERA-Interim reanalysis: configuration and performance of the data assimilation system. Quarterly Journal of the Royal Meteorological Society, 137, 553–597. doi:10.1002/qj.v137.656
- Dobler, C., et al., 2012. Quantifying different sources of uncertainty in hydrological projections in an Alpine watershed. Hydrology and Earth System Sciences, 16, 4343–4360. doi:10.5194/hess-16-4343-2012
- Driouech, F., Déqué, M., and Sánchez-Gómez, E., 2010. Weather regimes-Moroccan precipitation link in a regional climate change simulation. Global Planetary Change, 72, 1–10. doi:10.1016/j.gloplacha.2010.03.004
- Er-Raki, S., et al., 2010. Assessment of reference evapotranspiration methods in semi-arid regions: can weather forecast data be used as alternate of ground meteorological parameters? Journal of Arid Environments, 74, 1587–1596. doi:10.1016/j.jaridenv.2010.07.002
- Etchevers, P., et al., 2002. Impact of a climate change on the Rhone river catchment hydrology. Journal of Geophysical Research, 107, ACL 6-1–ACL 6-18. doi:10.1029/2001JD000490
- Fatichi, S., et al., 2014. Does internal climate variability overwhelm climate change signals in streamflow? The upper Po and Rhone basin case studies. Science of the Total Environment, 493, 1171–1182. doi:10.1016/j.scitotenv.2013.12.014
- Fiseha, B.M., et al., 2014. Impact of climate change on the hydrology of upper tiber river basin using bias corrected regional climate model. Water Resources Management, 28, 1327–1343. doi:10.1007/s11269-014-0546-x
- Fowler, H.J., Blenkinsop, S., and Tebaldi, C., 2007. Linking climate change modelling to impacts studies: recent advances in down-scaling techniques for hydrological modeling. International Journal of Climatology, 27, 1547–1578. doi:10.1002/joc.1556
- Furey, P.R., et al., 2012. A stochastic conceptual modeling approach for examining the effects of climate change on streamflows in Mountain Basins. Journal of Hydrometeorology, 13, 837–855. doi:10.1175/JHM-D-11-037.1
- Garcia-Ruiz, J.M., et al., 2011. Mediterranean water resources in a global change scenario. Earth Sciences Reviews, 105, 121–139. doi:10.1016/j.earscirev.2011.01.006
- Giorgi, F. and Lionello, P., 2008. Climate change projections for the Mediterranean region. Global Planetary Change, 63, 90–104. doi:10.1016/j.gloplacha.2007.09.005
- Gobiet, A., et al., 2014. 21st century climate change in the European Alps —a review. Science of the Total Environment, 493, 1138–1151. doi:10.1016/j.scitotenv.2013.07.050
- Gupta, H.V., et al., 2009. Decomposition of the mean squared error and NSE performance criteria: implications for improving hydrological modelling. Journal of Hydrology, 377 (1–2), 80–91. doi:10.1016/j.jhydrol.2009.08.003
- Hargreaves, G.H. and Samani, Z.A., 1985. Reference crop evapotranspiration from temperature. Applied Engineering in Agriculture, 1 (2), 96–99. doi:10.13031/2013.26773
- Herrnegger, M., Nachtnebel, H.-P., and Haiden, T., 2012. Evapotranspiration in high alpine catchments -an important part of the water balance ! Hydrology Research, 43 (4), 460–475. doi:10.2166/nh.2012.132
- Hreiche, A., Najem, W., and Bocquillon, C., 2007. Hydrological impact simulations of climate change on Lebanese coastal rivers. Hydrological Sciences Journal, 52 (6), 1119–1133. doi:10.1623/hysj.52.6.1119
- Hublart, P., et al., 2013. Modeling current and future trends in water availability for agriculture on a semi-arid and mountainous Chilean catchment. In: Cold and mountain region hydrological systems under climate change: towards improved projections (Proc. IAHS/IAPSO/IASPEI Joint Assembly, H04, 22–26 July 2013) Gothenburg, Sweden: IAHS Publication, 360, 26–32.
- Jarlan, L., et al., 2015. Remote sensing of water resources in semi-arid mediterranean areas: the joint international laboratory TREMA. International Journal of Remote Sensing, 36 (19–20), 4879–4917. doi:10.1080/01431161.2015.1093198
- Johnson, F. and Sharma, A., 2010. A comparison of australian open water body evaporation trends for current and future climates estimated from class a evaporation pans and general circulation models. Journal of Hydrometeorology, 11, 105–121. doi:10.1175/2009JHM1158.1
- Khabba, S., et al., 2013. The sudmed program and the joint international laboratory TREMA: A decade of water transfer study in the soil-plant-atmosphere system over irrigated crops in semi-arid area. Procedia Environmental Sciences, 19, 524–533. doi:10.1016/j.proenv.2013.06.059
- Kingston, D.G., et al., 2009. Uncertainty in the estimation of potential evapotranspiration under climate change. Geophysical Research Letters, 36, L20403. doi:10.1029/2009GL040267
- Klemeš, V., 1986. Operational testing of hydrological simulation models. Hydrological. Sciences Journal, 31, 13–24. doi:10.1080/02626668609491024
- Klemeš, V., 1990. The modelling of mountain hydrology: the ultimate challenge. Hydrology of Mountainous Areas. In: Proceedings of the Strbske Pleso Workshop, June 1988. Czechoslovakia: IAHS Publication, 190, 29–43.
- Kling, H., Fuchs, M., and Paulin, M., 2012. Runoff conditions in the upper Danube basin under an ensemble of climate change scenarios. Journal of Hydrology, 424-425, 264–277. doi:10.1016/j.jhydrol.2012.01.011
- Lagarias, J.C., et al., 1998. Convergence properties of the nelder–mead simplex method in low dimensions. SIAM Journal on Optimization, 9, 112–147. doi:10.1137/S1052623496303470
- Lespinas, F., Ludwig, W., and Heussner, S., 2014. Hydrological and climatic uncertainties associated with modeling the impact of climate change on water resources of small Mediterranean coastal rivers. Journal of Hydrology, 511, 403–422. doi:10.1016/j.jhydrol.2014.01.033
- Liston, G.E. and Elder, K., 2006. A distributed snow-evolution modeling system (SnowModel). Journal of Hydrometeorology, 7, 1259–1276. doi:10.1175/JHM548.1
- Magand, C., et al., 2014. Introducing hysteresis in snow depletion curves to improve the water budget of a land surface model in an Alpine catchment. Journal of Hydrometeorology, 15, 631–649. doi:10.1175/JHM-D-13-091.1
- Majone, B., et al., 2012. Modeling the impacts of future climate change on water resources for the Gállego river basin (Spain). Water Resources Research, 48, W01512. doi:10.1029/2011WR010985
- Maraun, D., 2012. Nonstationarities of regional climate model biases in European seasonal mean temperature and precipitation sums. Geophysical Research Letters, 39, L06706. doi:10.1029/2012GL051210
- Marchane, A., et al., 2015. Assessment of daily MODIS snow cover products to monitor snow cover dynamics over the Moroccan Atlas mountain range. Remote Sensing of Environment, 160, 72–86. doi:10.1016/j.rse.2015.01.002
- McCabe, G.J. and Markstrom, S.L., 2007. A monthly water-balance model driven by a graphical user interface. U.S. Geological Survey Open-File Report 2007-1008. Reston, VA: USGS, 12 pp.
- McCabe, G.J. and Wolock, D.M., 1999. General circulation model simulations of future snowpack in the Western United States. Journal of the American Water Resources Association, 35 (6), 1473–1484. doi:10.1111/jawr.1999.35.issue-6
- Milano, M., et al., 2013. Modeling the current and future capacity of water resources to meet water demands in the Ebro basin. Journal of Hydrology, 500, 114–126. doi:10.1016/j.jhydrol.2013.07.010
- Minville, M., Brissette, F., and Leconte, R., 2008. Uncertainty of the impact of climate change on the hydrology of a nordic watershed. Journal of Hydrology, 358, 70–83. doi:10.1016/j.jhydrol.2008.05.033
- Mouelhi, S., et al., 2006. Stepwise development of a two-parameter monthly water balance model. Journal of Hydrology, 318, 200–214. doi:10.1016/j.jhydrol.2005.06.014
- Oudin, L., et al., 2005. Which potential evapotranspiration input for a lumped rainfall–runoff model? Part 2 – Towards a simple and efficient potential evapotranspiration model for rainfall–runoff modelling. Journal of Hydrology, 303 (1–4), 290–306. doi:10.1016/j.jhydrol.2004.08.026
- Piras, M., et al., 2015. Quantification of hydrologic impacts of climate change in a Mediterranean basin in Sardinia, Italy, through high-resolution simulations. Hydrology and Earth System Sciences, 18, 5201–5217.
- Quintana Seguí, P., et al., 2010. Comparison of three downscaling methods in simulating the impact of climate change on the hydrology of Mediterranean basins. Journal of Hydrology, 383, 111–124. doi:10.1016/j.jhydrol.2009.09.050
- Refsgaard, J.C., et al., 2014. A framework for testing the ability of models to project climate change and its impacts. Climatic Change, 122, 271–282. doi:10.1007/s10584-013-0990-2
- Ruelland, D., Hublart, P., and Tramblay, Y. 2015. Assessing uncertainties in climate change impacts on runoff in Western Mediterranean basins. In: Hydrologic non-stationarity and extrapolating models to predict the future IAHS publication. Vol. 371, 75–81. doi:10.5194/piahs-92-1-201
- Ruti, P., et al., 2016. MED-CORDEX initiative for Mediterranean climate studies. Bulletin of the American Meteorological Society. doi:10.1175/BAMS-D-14-00176.1
- Schilling, J., et al., 2012. Climate change, vulnerability and adaptation in North Africa with focus on Morocco. Agriculture, Ecosystems & Environment, 156, 12–26. doi:10.1016/j.agee.2012.04.021
- Schulz, O. and De Jong, C., 2004. Snowmelt and sublimation: field experiments and modelling in the High Atlas Mountains of Morocco. Hydrology and Earth System Sciences, 8 (6), 1076–1089. doi:10.5194/hess-8-1076-2004
- Senatore, A., et al., 2011. Regional climate change projections and hydrological impact anal-ysis for a Mediterranean basin in Southern Italy. Journal of Hydrology, 399, 70–92. doi:10.1016/j.jhydrol.2010.12.035
- Sheffield, J., Wood, E.F., and Roderick, M.L., 2012. Little change in global drought over the past 60 years. Nature, 491, 435–438. doi:10.1038/nature11575
- Simonneaux, V., et al., 2008. Modelling runoff in the Rheraya Catchment (High Atlas, Morocco) using the simple daily model GR4J. Trends over the last decades. In: 13th IWRA World Water Congress, Montpellier, France.
- Smiatek, G., Kunstmann, H., and Andreas Heckl, A., 2014. High-resolution climate change impact analysis on expected future water availability in the upper Jordan Catchment and the Middle East. Journal of Hydrometeorology, 15, 1517–1531. doi:10.1175/JHM-D-13-0153.1
- Szczypta, C., et al., 2015. Impact of climate and land cover changes on snow cover in a small Pyrenean catchment. Journal of Hydrology, 521, 84–99. doi:10.1016/j.jhydrol.2014.11.060
- Teutschbein, C. and Seibert, J., 2013. Is bias correction of Regional Climate Model (RCM) simulations possible for non-stationary conditions? Hydrology and Earth System Sciences, 17, 5061–5077. doi:10.5194/hess-17-5061-2013
- Thirel, G., et al., 2015. Hydrology under change: an evaluation protocol to investigate how hydrological models deal with changing catchments. Hydrological Science Journal, 60 (7–8), 1184–1199. doi:10.1080/02626667.2014.967248
- Tramblay, Y., et al., 2013. High-resolution Med-CORDEX regional climate model simulations for hydrological impact studies: a first evaluation of the ALADIN-Climate model in Morocco. Hydrology and Earth System Sciences, 17, 3721–3739. doi:10.5194/hess-17-3721-2013
- Vaze, J., et al., 2010. Climate non-stationarity – validity of calibrated rainfall-runoff models for use in climate change studies. Journal of Hydrology, 394, 447–457. doi:10.1016/j.jhydrol.2010.09.018
- White, C.J., Tanton, T.W., and Rycroft, D.W., 2014. The impact of climate change on the water resources of the Amu Darya Basin in Central Asia. Water Resources Management, 28, 5267–5281. doi:10.1007/s11269-014-0716-x
- Wilby, R.L. and Harris, I., 2006. A framework for assessing uncertainties in climate change impacts: low-flow scenarios for the River Thames, UK. Water Resources Research, 42, W02419. doi:10.1029/2005WR004065