
ABSTRACT
The study focuses on the spatial and temporal variations of intense/extreme rainfall events over Gujarat State (India) during the period 1970–2014. Average monsoon rainfall for the state shows a significant increasing trend, with an increase of 48 mm/decade. Some of the stations in the Saurashtra region show a statistically significant increasing trend but none of the stations in the state show a decreasing trend. The increasing trend in monsoon rainfall is very significant for the past three decades, with an increase of 167 mm/decade. Instead of fixed absolute threshold values, relative threshold values of rainfall corresponding to the 95th, 98th, 99th and 99.5th percentiles for each station have been proposed to represent heavy, very heavy, intense and extreme rainfall, which varied between 70–120, 105–160, 130–210 and 165–280 mm, respectively. Significant increasing trends are observed for the frequency of heavy and very heavy rainfall events over the state.
Editor D. Koutsoyiannis; Associate editor Y. Gyasi-Agyei
1 Introduction
It is a well-accepted fact that the temperature of the Earth–atmosphere system is increasing. The globally averaged combined land and ocean surface temperature increased by 0.85°C over the period 1880–2012 (IPCC, Citation2014). As the climate warms up, water vapour content in the atmosphere increases. Trenberth (Citation2011) found that the water vapour content in the atmosphere increases by about 7% per 1°C warming. Under a warming environment, weather systems such as thunderstorms, depressions and cyclonic storms will have more potential for intense precipitation (Gordon et al. Citation1992, Meehl et al. Citation2000).
India receives about 80% of its total annual rainfall during the southwest monsoon season from June to September. Joshi and Rajeevan (Citation2006) observed an increasing trend in monsoon rainfall over the west coast and northwest India. Kumar et al. (Citation2010) studied trends in annual rainfall for 30 meteorological subdivisions in India using monthly data series of 135 years (1871–2005) and found that three subdivisions (Haryana, Punjab and Coastal Karnataka) showed a statistically significant increasing trend and one subdivision (Chattisgarh) indicated a significant decreasing trend. Pingale et al. (Citation2015) performed trend analysis of annual and monsoon rainfall at three different spatial scales over Rajasthan State, which is at the northern boundary of Gujarat State (Ajmer city, Ajmer district and Rajasthan State), for the period of 1971–2005 and did not detect any trend at the 10% level of significance.
Understanding changes in extreme daily rainfall events is more important than realizing changes in the mean condition. One-day extreme rainfall events occur not only in years of excess rainfall but also in drought years. Nandargi and Dhar (Citation2011) studied the decadal distribution of extreme one-day rainfall events (R ≥ 250 mm) between 1871 and 2007 over the Himalayas and found that 60 extreme rainfall events occurred during the 18 drought years and 42 one-day extreme rainfall events occurred during 17 excess rainfall years.
Studies have shown an increasing trend of extreme precipitation worldwide (Alexander et al. Citation2006, Tank et al. Citation2006, Guhathakurta and Rajeevan Citation2008). Dash et al. (Citation2009) observed significant increasing trends in the contribution of heavy intensity rainfall to the total amount of heavy rainfall over northwest India, northeast India, central northeast India, Uttarakhand and Telangana.
Using gridded data for the period 1951–2000, Goswami et al. (Citation2006) found an increasing trend in occurrence of very heavy rainfall (R ≥ 150 mm/d) concurrent with a decreasing trend in moderate rainfall (5 ≤ R < 100 mm/d), resulting in no discernible net trends in summer monsoon rainfall over Central India. Using high-resolution daily gridded rainfall data (1901–2004), Rajeevan et al. (Citation2008) found an increasing trend (0.8 events/decade) in frequency of very heavy rainfall events (R ≥ 150 mm) over Central India. Ghosh et al. (Citation2009) contradicted these observations and found spatially varying mixed responses of global warming towards rainfall occurrence and amounts all over India. Dash et al. (Citation2009) observed that the number of moderate rain days and low rain days averaged over India has significantly decreased, whereas the number of heavy rain days has increased. Nandargi and Dhar (Citation2011) found that there was an increase in the frequency of extreme rainfall events over the Himalayas from the decade 1951–1960 onwards. Subash et al. (Citation2011) observed that the decadal occurrence of number of extreme excess rainfall years over the eastern coastal subdivisions of the Indian continent had an increasing trend, while that over 17 subdivisions had a decreasing trend during the period 1871–2008. Varikoden et al. (Citation2013) reported an increasing trend in very heavy rainfall (R > 200 mm) over northwest India. Using the high-resolution (0.25° × 0.25°) gridded rainfall data, Pai et al. (Citation2014) observed a higher increasing trend in very heavy rainfall events (R > 150 mm) over Central India in the period 1956–2010 compared to that of Goswami et al. (Citation2006) and Rajeevan et al. (Citation2008), and, in their opinion, this increasing trend is due to the increasing trend in monsoon lows during recent decades. Recently, Nandargi et al. (Citation2016) analysed the extreme rainfall events that occurred in the period 1901–2013 over Uttarakhand (India) and found that the highest number of one-day extreme rainfall events (34 days) was recorded during the decade 1961–1970; they also observed a decreasing trend in magnitude of extreme rainfall in 42% of Uttarakhand stations, especially after 1970.
Strong coupling between equatorial Indian Ocean sea-surface temperature (SST) and very heavy rainfall events over Central India in the present global warming scenario suggests an increase in the frequency of very heavy rainfall events and the risk of floods over Central India (Rajeevan et al. Citation2008). According to Kitoh et al. (Citation2013) the projected changes in the extreme precipitation indices suggest strong sensitivity of the Asian monsoon to global warming. Yilmaz (Citation2015) constructed extreme rainfall datasets for current (1970–1989) and future (2080–2099) periods based on daily rainfall data over Antalya in Turkey using the peaks-over-threshold method. He performed frequency analysis of extreme rainfall data for the current and future periods and found that rainfall intensities for the future period may increase by up to 23% over the current period, especially for higher return periods.
Because of the typical topography, Gujarat State experiences great diversity in its climate, with hot and dry conditions in the northwestern part and humid conditions in the south. The minimum temperature goes down to about 6°C in certain parts of the state during winter and the maximum temperature reaches about 46°C over the Kutch region during peak summer (IMD, Citation1995). The southern part of the state generally receives high and assured rainfall, central parts receive medium and less assured rainfall, and the Kutch region receives scanty and irregular rainfall. Even though a major part of Gujarat is arid, most of the state experiences intense rainfall events, occasionally even more than 200 mm/d. The major synoptic systems responsible for heavy rainfall over Gujarat State are lows/depressions moving towards Gujarat from the Bay of Bengal, cyclonic storms in the Arabian Sea moving towards the Gujarat coast, mid-tropospheric cyclones forming over the northwest coast of the country, and extension and intensification of offshore troughs over the west coast.
Because climates are so diverse across different parts of Gujarat State, it is difficult to provide a single definition of intense or extreme rainfall. In general, three different methods have been used to define extreme rainfall: (a) absolute thresholds, (b) return values and (c) relative thresholds, i.e. percentiles. All the studies mentioned above are based on absolute thresholds. The India Meteorological Department (http://imd.gov.in/section/nhac/termglossary.pdf) specifies the following absolute thresholds to classify the intensity of daily rainfall: Heavy (64.5–124.4 mm), Very Heavy (124.5–244.4 mm), Extremely Heavy (>244.5 mm) and Exceptionally Heavy if the amount is close to the highest recorded rainfall. Francis and Gadgil (Citation2006) defined intense rainfall events as “those days during which the rainfall at one or more stations exceeds the threshold values of 150 mm/d”. The drawbacks of using such absolute thresholds are (i) intense/extreme rainfall may occur rarely in certain parts and very frequently in other parts; and (ii) the impact of the same amount of rainfall in different regions may be quite different. Return values associated with a pre-determined level of probability of exceedence as design values estimated from annual maximum one-day or multi-day rainfall amounts over many years are generally used in engineering applications (Simonovic Citation2012). In the present study, an attempt has been made to analyse spatial and temporal variations of different classes of rainfall intensities, especially intense and extreme rainfall over Gujarat State, based on percentiles (relative thresholds). These threshold values will be different for different locations as well for different time periods.
A brief description of the study area, data period and source, criteria for classification of intensity of rainfall and details of the Mann-Kendall test for significance are given in Section 2. The results of analysis of threshold values for different rainfall intensity classes, spatial distribution of rainfall and temporal distributions of intensity and frequency of rainfall in different classes with statistical significance are discussed in Section 3, and a brief summary of the work is presented in Section 4.
2 Data and methodology
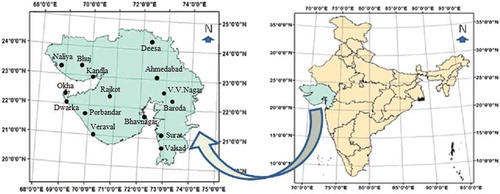
The overall methodology adopted in the study is presented in the flowchart shown in . Gujarat is the westernmost state of India and shares an international border with Pakistan. The state is situated between 20°10′–24°50′N and 68°40′–74°40′E. Indian states bordering Gujarat include Rajasthan to the northeast, Madhya Pradesh to the east and Maharashtra to the south. The state has an area of 196 024 km2, with a coastline of 1600 km (http://nidm.gov.in/PDF/DP/GUJARAT.pdf). The state can be divided into three regions based on geography, as follows: (a) Saurashtra Peninsula, which is essentially a hilly region with low mountains; (b) Kutch, located in the northwest of Gujarat with a maximum altitude of about 300 m and an almost desert-like topography; and (c) Mainland, which is the eastern part of the state. The Gulf of Kutch separates the Saurashtra peninsula from Kutch and the Gulf of Cambay divides Mainland from Saurashtra. The geographical diversity of Gujarat includes hills, desert, forests and rivers. Gujarat has many rivers; the four major rivers are (i) the Narmada, which originates on the Amarkantak Plateau and merges into the Arabian Sea, and which is the site of the Sardar Sarovar Dam; (ii) the Sabarmati, which starts from the Aravalli hills, flows through Rajasthan and then into Gujarat, and discharges into the Arabian Sea; (iii) the Tapti, which has a length of more than 700 km, and is one of the three rivers of India that flows from east to west, the other two being the Narmada and Mahi; and (iv) the Aji, which is a crucial water resource for Saurashtra, and starts from the hills at Sardhar and Lodhika, flows through Rajkot district and then discharges into the Arabian Sea.
Figure 1. Flowchart of the methodology adopted.
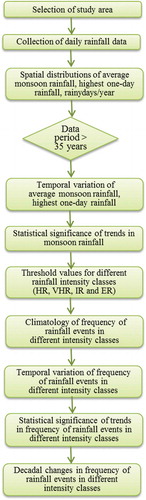
The India Meteorological Department (IMD) maintains weather observatories in India; they calibrate all instruments and check the quality of all observed data. Rainfall data for 15 IMD observatories for the period 1970–2014 were used for the present study and their locations are shown in . Spatial variations of average monsoon rainfall over Gujarat State and the highest one-day point rainfall over the state during the period 1970–2014 were analysed based on data from these 15 stations. The total numbers of rainy days (R ≥ 2.5 mm) during the past four decades were studied. Temporal variations of monsoon rainfall for the state as a whole and the highest one-day point rainfall over the whole state were investigated. Temporal variations of monsoon rainfall at 12 individual stations having about 35 years or more of data were investigated.
Figure 2. Location of IMD observatories in Gujarat.
The following criteria were used to classify the intensity of rainfall based on the percentile value of rainfall on rainy days for the monsoon seasons of 45 years:
Heavy rainfall R ≥ 95th percentile
Very heavy rainfall R ≥ 98th percentile
Intense rainfall R ≥ 99th percentile
Extreme rainfall R ≥ 99.5th percentile
Threshold values for each class of intensity were estimated based on the above specified percentile values of the daily rainfall data for the monsoon season for each station. Contour lines of threshold rainfall corresponding to different percentile values were plotted for the spatial variation. Any day with at least one station having recorded rainfall above the threshold value was considered to be an event in that category. Events of heavy rainfall, very heavy rainfall, intense rainfall and extreme rainfall over Gujarat State during the period 1970–2014 were identified. Year-to-year variation in the frequency of daily rainfall exceeding threshold values for the various classes during the monsoon season was analysed for all stations having 40 years or longer of data.
Generally, trend analyses are performed using parametric and nonparametric approaches. Parametric trend tests are regarded to be more powerful than the nonparametric ones when the data are normally distributed, independent and have homogeneous variance (Hamed and Rao Citation1998). Based on various theoretical reasoning and empirical evidence, the Gumbel distribution has been extensively used to represent extreme rainfall. Koutsoyiannis (Citation2004) has shown the inappropriateness of the Gumbel distribution and the appropriateness of the EV2 distribution for rainfall extremes. The rank-based Mann-Kendall (MK) test is a distribution-free test; hence, it is suitable for trend analysis of rainfall data which, in general, are non-normally distributed (Kundzewicz and Robson Citation2000). In the present study, the Mann-Kendall statistical test (Mann Citation1945, Kendall Citation1970) was applied to the monsoon rainfall data to detect statistical significance in trends. Gilbert (Citation1987) described a detailed computational procedure of the MK statistical test for determining significance in trends.
The MK test is applicable in cases when the data values of a time series can be assumed to obey the model:
where is a continuous monotonic increasing or decreasing function of time and the residuals
can be assumed to be from the same distribution with zero mean. It is therefore assumed that the variance of the distribution is constant in time. The MK test checks whether to reject the null hypothesis of nonexistence of monotonic trend or to accept the alternative hypothesis of presence of monotonic trend at different significance levels. The MK statistic provides an indication of the existence of any statistically significant trends and whether the trend is positive or negative.
The MK test statistic S is calculated by:
where xj and xk are the annual values in years j and k, j > k, respectively, and:
Since n is more than 10, the normal approximation test is used. First the variance of S is computed by the following equation, which takes into account that ties may be present:
Here q is the number of tied groups and tp is the number of data values in the qth group.
The values of S and var(S) are used to compute the test statistic Z, as follows:
The presence of a statistically significant trend is evaluated using the Z statistic. A positive value of Z indicates an upward trend and a negative value indicates a downward trend. The statistic Z has a normal distribution. To test for either an upward or downward monotone trend, a two-tailed test is used for four different significance levels: α = 0.1, 0.05, 0.01 and 0.001. The null hypothesis is rejected if the absolute value of Z is greater than Z1−α/2, where Z1−α/2 is obtained from the standard normal cumulative distribution tables.
3 Results and discussion
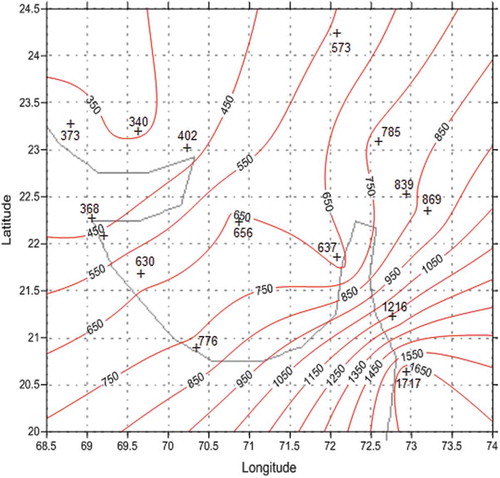
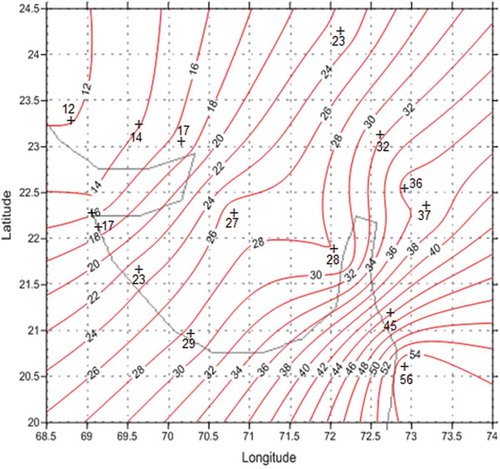
The average monsoon rainfall for Gujarat State as a whole, based on average of monsoon rainfall for all 15 stations for the period 1970–2014, is 706 mm. The spatial variation of average monsoon rainfall over Gujarat State is presented in . A systematic reduction in monsoon rainfall from the southeastern part of the state to the northwestern part, with a high gradient in the southeastern part, is clearly observed. Seasonal mean rainfall in the southern part of the state is more than four times that in the northwestern part. The isohyets are nearly parallel to the southwest–northeast direction. The Kutch region has low average monsoon rainfall of less than 450 mm. The average monsoon rainfall over the Saurashtra region varied between 500 and 950 mm, and in the East Gujarat region it varied from about 600 mm in the northern part to more than 1650 mm in the southern part. The highest mean monsoon rainfall of 1717 mm was recorded at Valsad in the southern part of the East Gujarat region and the lowest mean monsoon rainfall of 340 mm occurred at Bhuj in the Kutch region.
Figure 3. Spatial distribution of average monsoon rainfall (mm) over Gujarat State (1970–2014) based on 15 IMD stations.
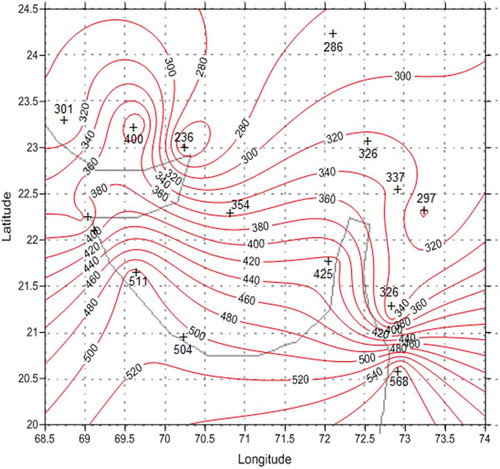
The highest one-day rainfall recorded at individual observatories during the period 1970–2014 is plotted for spatial variation in . The maximum of the highest one-day point rainfall during the period is seen over the southernmost part of East Gujarat; Valsad recorded the highest one-day rainfall of 568 mm on 27 June 2002. The minimum value of the highest one-day rainfall is seen around Kandla in the Kutch region. It is interesting to note that the highest one-day rainfall recorded over certain pockets in the Kutch region is close to, or even more than, the seasonal average there. All stations, including the stations in the desert part of the Kutch region, recorded rainfall of more than 200 mm/d at least once in the period of study. It is interesting to note that the highest one-day rainfall recorded over the desert region of Gujarat State is more than that of the northern part of the East Gujarat region, where the average seasonal rainfall is more than double that in the desert regions.
Figure 4. Spatial distribution of the highest one-day rainfall (mm) over Gujarat State (1970–2014).
The spatial variation of the average number of rainy days (R ≥ 2.5 mm) per year during the monsoon season over Gujarat State is presented in . The pattern is similar to that of the mean monsoon rainfall, with a SE–NW gradient. The average number of rainy days per season over the Kutch region is less than 20, whereas in the southern part of East Gujarat region it is about 55.
Figure 5. Spatial distribution of frequency of rainy days/year during the monsoon period over Gujarat State (1970–2014).
The temporal variation of yearly average monsoon rainfall over Gujarat State as a whole in the period 1975–2014, based on data from 12 stations, is presented in . The average monsoon rainfall over the state shows a statistically significant increase (90% level of significance) and the linear trend reveals an increase of 48 mm/decade, which corresponds to 7% of mean monsoon rainfall. It is interesting to note that the linear trend in the state average monsoon rainfall over the past three decades (1985–2014) shows a statistically very significant increasing trend (99% level of significance) with a linear increase of 167 mm/decade; which is about 26% of its seasonal mean. The increase in monsoon rainfall is very prominent during the last 15 years; the highest average monsoon rainfall for the state (1208 mm) occurred during this period and in nine years during this 15-year period recorded values were more than the climatic mean. Mohanty et al. (Citation2015) studied heavy rainfall activity over both meteorological subdivisions of Gujarat State (Gujarat Region and Saurashtra & Kutch Region) for the period 1974–2013 and found that monsoon rainfall increased appreciably in the decade 2004–2013 for both subregions.
Figure 6. Temporal variations of average monsoon rainfall over Gujarat State as a whole and at a few selected stations (1975–2014).
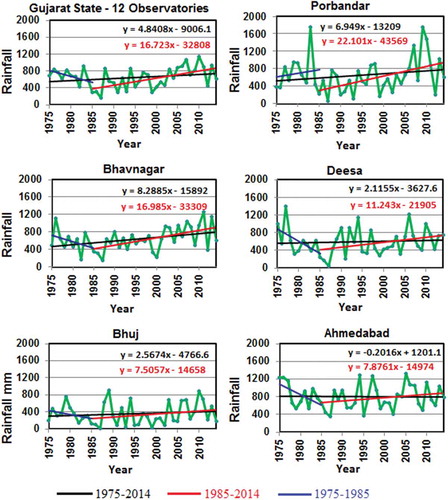
Monsoon rainfall at 12 IMD observatories was analysed individually for its temporal variations in the period 1975–2014, and the results are summarized in . An increase of 5% of the mean per decade or more is considered as an increasing trend. Temporal variations over a few representative stations are also presented in . Seven out of 12 stations show an increasing trend over the past four decades; the average decadal change at five stations (Dwarka, Baroda, Bhavnagar, Veraval and Porbandar) is more than 10% of the mean monsoon rainfall. Regression lines reveal monsoon rainfall has increased by 1.5 times or more at all these five stations during the past four decades. Stations Dwarka, Bhavnagar and Veraval in the Saurashtra region and Baroda in the East Gujarat region show statistically significant increasing trends at 99.9%, 95%, 90% and 90% levels, respectively. It is important to note that none of the stations in Gujarat State have shown any decreasing trend during the past four decades.
Table 1. Trends in monsoon rainfall at IMD stations in Gujarat State for the periods 1975–2014 and 1985–2014.
To see the recent trends, monsoon rainfall data for the past three decades (1985–2014) over 12 stations were analysed separately. It is interesting to note that all 12 stations show very prominent increasing trends of more than 10% of their mean per decade over the period 1985–2014, in which the increase is statistically significant at 90% or more over eight stations. The observed increasing trends over the past three decades are significant at the 99.9% level for Baroda in the East Gujarat region and Dwarka in the Saurashtra region, and at the 99% level for Bhavnagar in the Saurashtra region, with decadal changes of 297, 246 and 170 mm, respectively. At four stations, Porbandar, Veraval, Rajkot and Deesa, the increasing trend is significant at the 95% level. The average decadal increase is more than 20% of the seasonal mean rainfall at eight out of 12 stations. Regression lines based on the past three decades show that the monsoon rainfall has more than doubled during the period at seven out of 12 stations.
It may be noted that during the first decade of the study period, all stations except Veraval and Porbandar have shown a decreasing trend. For the state as a whole, the decreasing trend for this period was 28.7 mm/year.
Dash et al. (Citation2011) have shown that, over the entire country including Gujarat State, short spells of heavy intensity rainfall are increasing, whereas long spells of moderate intensity and low intensity rainfall are decreasing during the summer monsoon season. One of the important conclusions of their study is that the seasonal contribution of moderate rainfall to total moderate rainfall has a decreasing trend in Gujarat State.
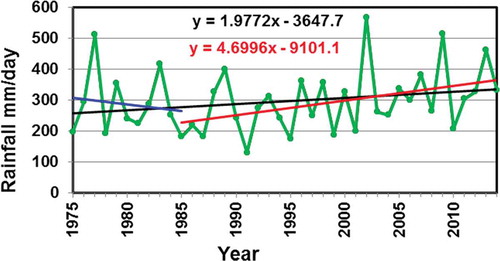
The temporal variation of the highest one-day point rainfall over Gujarat State recorded in each year of the period 1975–2014 is presented in . The highest one-day point rainfall shows a statistically significant increasing trend (95% level) and the linear trend shows an increase of about 20 mm/decade. The linear trend during the past three decades indicates a higher increase of about 47 mm/decade. Goswami et al. (Citation2006), using gridded data, found that the average intensity of the heaviest four events in each monsoon season over Central India showed an increase of about 10%/decade. Pingale et al. (Citation2014) found positive trends in extreme annual daily rainfall over urban centres in southeastern parts of Rajasthan State (lies north of Gujarat State) for the period 1971–2005, with a maximum increasing trend of 1.38 mm/year.
Figure 7. Temporal variation of highest one-day point rainfall over Gujarat State (1975–2014).
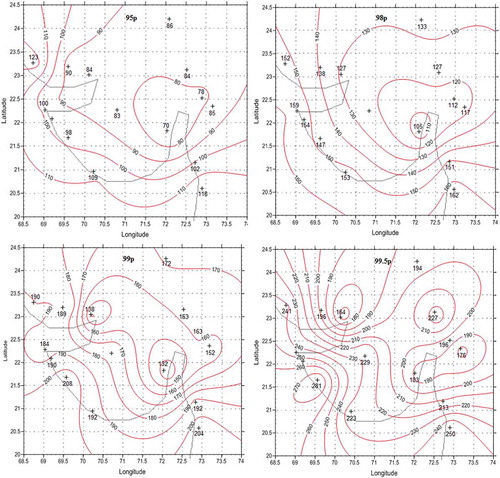
All the above rainfall indicators, such as seasonal rainfall, highest one-day point rainfall and number of rainy days, indicate high spatial variability of monsoon rainfall over Gujarat State. This suggests that the use of the absolute threshold proposed by IMD for classifying intensity of rainfall over Gujarat State cannot be justified. So, we applied relative threshold values of rainfall corresponding to the 95th, 98th, 99th and 99.5th percentiles to represent Heavy, Very Heavy, Intense and Extreme rainfall, respectively. These are referred to hereafter as 95p, 98p, 99p and 99.5p. The distribution of one-day monsoon rainfall (R > 2.5 mm) at Ahmedabad for the period 1970–2014 is shown in . Threshold values for Heavy (R ≥ 95p), Very Heavy (R ≥ 98p), Intense (R ≥ 99p) and Extreme (R ≥ 99.5p) rainfall for all 15 stations based on the 45 years of data are given in , and their spatial variations are presented in . Threshold values for Heavy rainfall (R ≥ 95p) varied between 70 and 123 mm, with a state average of 93 mm; those for Very Heavy rainfall (R ≥ 98p) varied between 105 mm at Bhavnagar and 162 mm at Valsad, with a state average of 137 mm, and those for Intense rainfall (R ≥ 99p) varied from 132 mm at Bhavnagar to 208 mm at Porbandar. The northeastern part of the state has a nearly uniform threshold value for Intense rainfall of between 160 and 170 mm. For the state as a whole, the average Intense rainfall threshold is 176 mm. There is a strong gradient of Extreme rainfall thresholds (R ≥ 99.5p) over the western parts of the state, varying from 164 mm at Kandla to 281 mm at Porbander. The average threshold value for extreme rainfall for Gujarat State as a whole is 217 mm. In general, lower threshold values are seen near the Bhavnagar area for all cases. Even though the average monsoon rainfall is less over the Kutch region, the threshold values for all cases are comparatively high over this region.
Table 2. Threshold values for Heavy (95p), Very Heavy (98p), Intense (99p) and Extreme rainfall (99.5p) for the IMD stations in Gujarat State (1970–2014). Note: p refers to the percentile, e.g. 98p is the 98th percentile.
Figure 8. Distribution of one-day rainfall (R ≥ 2.5 mm) during the monsoon period at Ahmedabad (1970–2014).
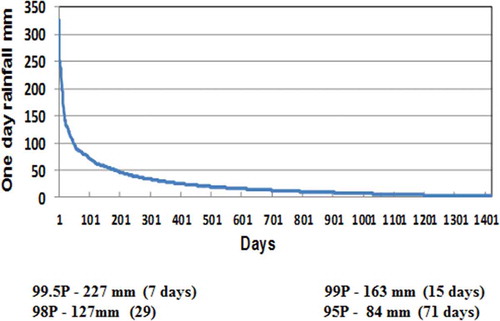
Figure 9. Threshold values for Heavy (95p), Very Heavy (98p), Intense (99p) and Extreme (99.5p) rainfall over Gujarat State (1970–2014).
shows the average frequency of Heavy, Very Heavy, Intense and Extreme rainfall per decade at 12 observatories for the period 1975–2014. The highest frequencies in all categories are seen at the southern station of Surat. At this station, on average about 5 intense rainfall days and more than 2 extreme rainfall days occurred in a decade. At all three southern stations in East Gujarat (Surat, Baroda and Ahmedabad), Heavy rainfall occurred on more than 16 days per decade, in which more than 6 days recorded Very Heavy rainfall, and more than 3 days recorded Intense rainfall. The highest frequency of Extreme rainfall (2.4/decade) occurred at Surat. In Saurashtra region, the average frequency of Heavy Rainfall per decade was between 9 and 15 days, Very Heavy rainfall per decade was between 3 and 6 days and Intense rainfall was between 2 and 3 days per decade. In the Kutch region, the frequency of Heavy, Very Heavy and Intense rainfall per decade was 6–9, 2–4 and 1–2 days per decade, respectively. The average frequency of Extreme rainfall for Saurashtra region was between 1 and 2 days per decade and that in the Kutch region was about 1 day per decade.
Table 3. Average number of days per decade with Heavy (R ≥ 95p), Very Heavy (R ≥ 98p), Intense (R ≥ 99p) and Extreme (R ≥ 99.5p) rainfall for the IMD stations in Gujarat State (1970–2014).
The highest frequency of Heavy, Very Heavy, Intense and Extreme rainfall recorded in any year during the period 1975–2014 at each station is presented in . The highest frequency of Very Heavy rainfall days in a year varied between 1 and 5; the lowest was at Naliya and the highest was at Surat. In the East Gujarat region, the highest number of Intense rainfall days in a year varied between 2 and 4; southern stations Surat and Baroda recorded 4 and 3 Intense rainfall days, respectively, in 1976. Naliya, in the northwestern part of the state, has never recorded more than 1 Intense rainfall day in any year. In the Saurashtra region, only Porbandar recorded 3 Intense rainfall days in a year (1983). The highest frequency of Extreme rainfall in any year occurred at Deesa in the northeastern part of the state (3 days in 1977) and all other stations recorded a maximum of 1 or 2 Extreme rainfall days.
Table 4. Highest number of days per year with Heavy (R ≥ 95p), Very Heavy (R ≥ 98p), Intense (R ≥ 99p) and Extreme (R ≥ 99.5p) rainfall for the IMD stations in Gujarat State (1975–2014).
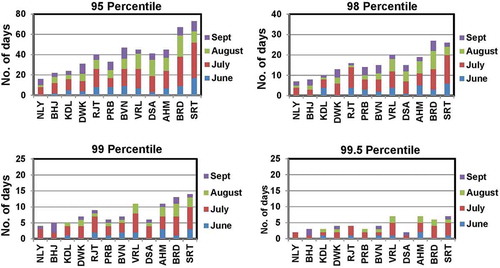
The frequency of rainfall above the threshold values for 95p, 98p, 99p and 99.5p in the period 1985–2014 on a monthly basis for 12 stations is shown in . Stations Surat, Veraval and Ahmedabad recorded the highest number of Extreme rainfall days (7) in the 30-year period, followed by Baroda with 6 Extreme rainfall days; at all these stations the highest number of Extreme rainfall days occurred in July. The northwestern station Naliya and northeastern station Deesa recorded the lowest number of Extreme rainfall days (only 2 days). Only Surat and Bhavnagar recorded Extreme rainfall in all four months. Six of the 12 stations did not record Extreme rainfall in June; similarly seven stations did not record Extreme rainfall in September. Over the 30-year period, among the 12 stations, Surat recorded the maximum number of Intense rainfall days (14), of which 7 days of rainfall was Extreme. The northwestern stations Naliya, Bhuj and Dwarka and the northeastern station Deesa did not record any Intense rainfall during June. In general, all stations in Gujarat State recorded the maximum number of Intense rainfall days during the month of July.
Figure 10. Number of days of recorded rainfall above the threshold values for each station on a monthly basis (1985–2014).
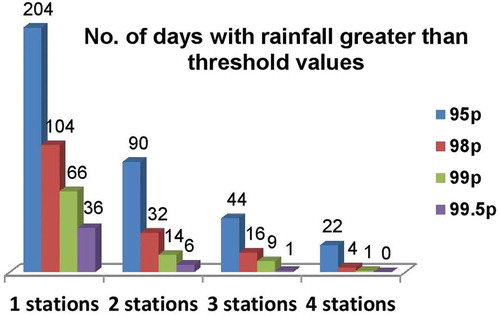
To obtain the spread of intensity of rainfall, the number of days on which at least one, two, three or four stations among the 15 IMD stations in Gujarat State recorded rainfall of various intensities during the monsoon seasons of 2001–2014 are shown in . During this 14-year period, Extreme rainfall (R ≥ 99.5p) was recorded on no occasions at four or more stations, on only one occasion (1 July 2005) at three stations (Ahmedabad, VV Nagar and Baroda), on six occasions at two stations and on 36 occasions at only one station. During this period, there was only one day (7 August 2007) on which Intense rainfall (R ≥ 99p) was recorded at four stations, two of which exceeded the 99.5p threshold, indicating widespread Intense rainfall. On nine occasions, three stations and on 14 days, two stations recorded Intense rainfall. Similarly, Very Heavy rainfall was recorded on four days at four stations and on 16 occasions at three stations.
Figure 11. Number of days with one, two, three or four stations that recorded Heavy (R ≥ 95p), Very Heavy (R ≥ 98p), Intense (R ≥ 99p) and Extreme (R ≥ 99.5p) rainfall in the monsoon season among 15 IMD stations across Gujarat State (2001–2014).
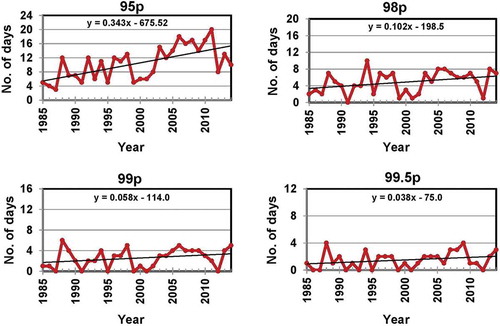
Any day on which at least one of the 12 stations in Gujarat State recorded rainfall exceeding the 95, 98, 99 or 99.5 percentile threshold values is considered, respectively, as a Heavy, Very Heavy, Intense or Extreme rainfall event. Temporal variations in the frequency of such events in the past three decades are shown in . The MK test revealed a statistically significant increase in the frequency of Heavy and Very Heavy rainfall events in Gujarat State at the 99.9% and 90% levels, respectively. The linear trend in frequency of Heavy rainfall events shows an increase of about 3.4 events per decade. The frequency of Very Heavy rainfall events has increased at a rate of about 1.0 event per decade. The highest frequency of Heavy rainfall occurred in 2011 (20 events) and of Very Heavy rainfall events in 1994 (10 events). The linear trend shows that, on average, the frequency of Intense rainfall events increased from about 2.5 per year in the beginning of the study period to about 3.5 per year in the latter stage of the study period. The highest frequency of Intense rainfall events was recorded in 1988 with six events. The frequency of Extreme rainfall increased from about one event per year in the beginning to about two events per year during the latter part of the study period. During the study period, four Extreme rainfall events were recorded in only two years (1988 and 2009). Ray et al. (Citation2009) observed that the occurrence of Heavy rainfall events (R > 70 mm) had more than doubled in the decade 1999–2008 compared to 1989–1998 for the southern Gujarat stations of Surat and Baroda.
Figure 12. Frequency of events in which rainfall exceeded 95p, 98p, 99p or 99.5p threshold values.
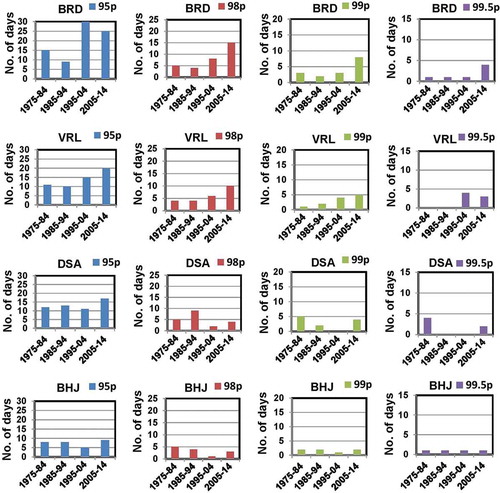
Since the frequency of rainfall events, especially Extreme and Intense rainfall events, in many years is zero or one, the MK test could not be performed for statistical significance in trends at most of the stations. Decadal variations in frequency of Heavy, Very Heavy, Intense and Extreme rainfall in the past four decades were analysed and the results for four representative stations are shown in . None of the stations in the Kutch region show any systematic change in frequency in any class. All stations in the Saurashtra region, except Bhavnagar and Baroda in the East Gujarat region, show a systematic increase in frequency of Very Heavy rainfall from the decade 1985–1994 onwards. A sharp increase in the frequency of Very Heavy rainfall at Bhavnagar and Dwarka was observed for the last decade compared to 1995–2004. A decrease in the frequency of Very Heavy rainfall was observed only at Ahmedabad. At Veraval, a systematic increase in the frequency of Very Heavy and Intense rainfall throughout the period is clearly seen in . A sharp increase in the frequency of Intense rainfall was observed at Dwarka, Bhavnagar and Porbandar stations. Baroda recorded four Extreme rainfall days in the last decade compared to only one day each in all previous decades. Dwarka and Veraval stations did not record any Extreme rainfall events in the first two decades, but in the last decade both stations recorded three days of Extreme rainfall.
Figure 13. Decadal changes in frequency of Heavy, Very Heavy, Intense and Extreme rainfall at representative stations (1975–2014).
4 Summary and conclusions
Gujarat State experiences intense rainfall on certain occasions during the southwest monsoon. These intense rainfall events contribute significantly to average monsoon rainfall, but at the same time they cause a lot of inconvenience and damage. Very limited studies have been carried out on the intense rainfall events over Gujarat State and these studies are based on fixed threshold values for the classification of intensity of rainfall. Since the spatial variation of rainfall over Gujarat State is very high, we propose classes of rainfall intensity thresholds based on percentile values.
The spatial and temporal variations of intensity and frequency of monsoon rainfall over Gujarat State were studied for the period 1970–2014. The spatial variation in monsoon rainfall shows a systematic reduction in rainfall from southeastern parts to northwestern parts of the state. All stations, including that in the desert part of the Kutch region, recorded rainfall of 200 mm/d at least once in the study period. The highest one-day point rainfall over the desert region of Gujarat State is more than that in northern part of the eastern Gujarat region, where the average seasonal rainfall is more than twice that in the desert regions.
The temporal variation of average monsoon rainfall for Gujarat State shows a statistically significant increasing trend, a decadal increase of 7% of its seasonal mean for the past four decades and an increase of 26% of its seasonal mean for the past three decades. Five of the 12 stations studied showed a decadal increase of 10% or more of their seasonal mean. The increase is statistically significant at number of stations, especially those in the Saurashtra region. Increasing trends in the recent three decades were much more significant at a greater number of stations. The average decadal increase is more than 20% of their seasonal mean at eight out of 12 stations. None of the stations in Gujarat State showed any decreasing trend in monsoon rainfall.
The threshold values for Heavy, Very Heavy, Intense and Extreme rainfall for different stations in Gujarat State were in the ranges 70–120, 105–160, 130–210 and 165–280 mm, respectively. Even though the average monsoon rainfall is less over the Kutch region, the threshold values for all intensity categories are comparatively high. The frequency of Intense rainfall varied between 1.5 and 5.0 per decade and Extreme rainfall varied between 0.8 and 2.4 per decade in different parts of the state. A statistically significant increase in the frequency of Heavy and Very Heavy rainfall events is observed; Heavy rainfall events increased at a rate of 3.4 events per decade. The linear trend shows that, on average, the frequency of intense rainfall events increased from about 2.5 events per year in the beginning of the study period to 3.5 events per year during the latter part. A few stations in the Saurashtra region showed an increasing trend in the frequency of Heavy and Very Heavy rainfall and none of the stations showed any decreasing trend in frequency of rainfall events.
A study of this nature would be useful for better hydrological planning and urban infrastructure development and also for identification of optimum adaptation and mitigation strategies for any region.
Acknowledgements
The authors are thankful to the India Meteorological Department for providing rainfall data. They also wish to thank the editors and anonymous reviewers for their valuable suggestions and comments which helped to improve the manuscript.
Disclosure statement
No potential conflict of interest was reported by the authors.
Additional information
Funding
Related Research Data
References
- Alexander, L.V., et al., 2006. Global observed changes in daily climate extremes of temperature and precipitation. Journal of Geophysical Research, 111, D05109. doi:10.1029/2005JD006290
- Dash, S.K., et al., 2009. Change in the characteristics of rain events in India. Journal of Geophysical Research, 114, 1–12. doi:10.1029/2008JD010572
- Dash, S.K., et al., 2011. Characteristics changes in the long and short spells of different rain intensity in India. Theoretical and Applied Climatology, 105, 563–570. doi:10.1007/s00704-011-0416-x
- Francis, P.A. and Gadgil, S., 2006. Intense rainfall events over the west coast of India. Meteorology and Atmospheric Physics, 94, 27–42. doi:10.1007/s00703-005-0167-2
- Ghosh, S., Luniya, V., and Gupta, A., 2009. Trend analysis of Indian summer monsoon rainfall at different spatial scales. Atmospheric Science Letter, 10, 285–290. doi:10.1002/asl.235
- Gilbert, R.O., 1987. Statistical methods for environmental pollution monitoring. New York: Van Nostrand Reinhold.
- Gordon, H.B., et al., 1992. Simulated changes in daily rainfall intensity due to the enhanced greenhouse effect: implications for extreme rainfall events. Climate Dynamics, 8, 83–102. doi:10.1007/BF00209165
- Goswami, B.N., et al., 2006. Increasing trends of extreme rainfall events over India in a warming environment. Science, 314, 1442–1445. doi:10.1126/science.1132027
- Guhathakurta, P. and Rajeevan, M., 2008. Trends in the rainfall pattern over India. International Journal of Climatology, 28, 1453–1469. doi:10.1002/joc.1640
- Hamed, K.H. and Rao, A.R., 1998. A modified Mann-Kendall trend test for autocorrelated data. Journal of Hydrology, 204, 182–196. doi:10.1016/S0022-1694(97)00125-X
- IMD (India Meteorological Department), 1995. Climate of Gujarat and Diu, Daman and Nagar Haveli. Delhi: India Meteorological Department, Government of India.
- IPCC (Intergovernmental Panel on Climate Change), 2014. Climate Change 2014 Synthesis Report Summary for Policymakers, AR4.
- Joshi, U. and Rajeevan, M., 2006. Trends in precipitation extremes over India. Research Report. National Climate Centre, India Metrological Department Pune, India, 3.
- Kendall, M.G., 1970. Rank Correlation Methods. 2nd. New York: Hafner.
- Kitoh, A., et al., 2013. Monsoons in a changing world: a regional perspective in a global context. Journal of Geophysical Research: Atmospheres. 118. 10.1002/jgrd.50258
- Koutsoyiannis, D., 2004. Statistics of extremes and estimation of extreme rainfall: I. Theoretical investigation. Hydrological Sciences Journal, 49, 575–590. doi:10.1623/hysj.49.4.575.54430
- Kumar, V., Jain, S.K., and Singh, Y., 2010. Analysis of long-term rainfall trends in India. Hydrological Sciences Journal, 55, 484–496. doi:10.1080/02626667.2010.481373
- Kundzewicz, Z.W. and Robson, A., Eds., 2000. Detecting trend and other changes in hydrological data.WCDMP-45; WMO-TD No. 1013. Geneva, Switzerland: World Meteorological Organization.
- Mann, H.B., 1945. Nonparametric tests against trend. Econometrica, 13, 245–259. doi:10.2307/1907187
- Meehl, A.G., et al., 2000. Trends in extreme weather and climate events: issues related to modeling extremes in projections of future climate change. Bulletin of American Meteorological Society, 81, 427–436. doi:10.1175/1520-0477(2000)081<0427:TIEWAC>2.3.CO;2
- Mohanty, M., Ray, K., and Chakravarthy, K., 2015. Analysis of increasing heavy rainfall activity over western India, particularly Gujarat State in the past decade. In: High-Impact Weather Events over the SAARC Region. doi:10.1007/978-3-319-10217-7_17
- Nandargi, S. and Dhar, O.N., 2011. Extreme rainfall events over the Himalayas between 1871 and 2007. Hydrological Sciences Journal, 56 (6), 930–945. doi:10.1080/02626667.2011.595373
- Nandargi, S., Gaur, A., and Mulye, A.S., 2016. Hydrological analysis of extreme rainfall events and severe rainstorms over Uttarakhand, India. Hydrological Sciences Journal, 61, 2145–2163. doi:10.1080/02626667.2015.1085990
- Pai, D.S., et al., 2014. Analysis of the daily rainfall events over India using a new long period (1901-2010) high resolution (0.25°×0.25°) gridded rainfall data set. Climate Dynamics. 43. 10.1007/s00382-014-2307-1
- Pingale, S., et al., 2015. Implications of spatial scale on climate change assessments. Journal of Water and Land Development, 26, 37–56. doi:10.1515/jwld-2015-0015
- Pingale, S.M., et al., 2014. Spatial and temporal trends of mean and extreme rainfall and temperature for the 33 urban centres of the arid and semiarid state of Rajasthan. Atmospheric Research, 138, 78–90. doi:10.1016/j.atmosres.2013.10.024
- Rajeevan, M., Bhate, J., and Jaswal, A.K., 2008. Analysis of variability and trends of extreme rainfall events over India using 104 years of gridded daily rainfall data. Geophysical Research Letters. 35. 10.1029/2008GL035143
- Ray, K., Mohanty, M., and Chincholikar, J.R., 2009. Climate variability over Gujarat, India, ISPRS Archives XXXVIII-8/W3, Workshop Proceedings: Impact of climate change on agriculture, Space Applications Centre (ISRO) Ahmedabad, India, 38–43.
- Simonovic, S., 2012. Floods in a changing climate: risk management. Cambridge, UK: Cambridge University Press.
- Subash, N., Ram Mohan, H.S., and Sikka, A.K., 2011. Decadal frequency and trends of extreme excess/deficit rainfall during the monsoon season over different meteorological sub-divisions of India. Hydrological Sciences Journal, 56, 1090–1109. doi:10.1080/02626667.2011.608677
- Tank Klein, A.M.G., et al., 2006. Changes in daily temperature and precipitation extremes in central and south Asia. Journal of Geophysical Research, 111, D16105. doi:10.1029/2005JD006316
- Trenberth, K.E., 2011. Changes in precipitation with climate change. Climate Research, 47, 123–138. doi:10.3354/cr00953
- Varikoden, H., Krishna Kumar, K., and Babu, C.A., 2013. Long term trends of seasonal and monthly rainfall in different intensity ranges over Indian subcontinent. Mausam, 64, 481–488.
- Yilmaz, A.G., 2015. The effects of climate change on historical and future extreme rainfall in Antalya, Turkey. Hydrological Sciences Journal, 60, 2148–2162. doi:10.1080/02626667.2014.945455