
ABSTRACT
Knowledge relating to the relationship between the characteristics of precipitation and sources of moisture is essential to improve our understanding of the global water cycle. This study presents the first quantitative estimation of the moisture source regions combined with stable isotope analyses for precipitation at K-puszta, east Hungary. The contributions of the following moisture sources were diagnosed according to the sector analysis of 4-day backward trajectories together with the calculation of evaporation and precipitation fluxes based on the specific humidity: Mediterranean region (57.0%), local moisture (14.8%), Atlantic region (14.2%), Northern Europe (7.4%) and Eastern Europe (6.6%). The δD and δ18O values of daily precipitation were measured and the deuterium excess (d-excess) was calculated. The d-excess showed systematic differences among the marine sources, reflecting the characteristics of the moisture source area. The results suggest that the stable isotope composition of precipitation preserves information regarding the origin of the water vapour.
Editor M. C. Acreman; Associate editor X. Fang
1 Introduction
The distribution of precipitation in the temperate climate zone has significant spatial and temporal variability. Although the territory of the Carpathian Basin is relatively homogeneous and has a well-balanced climate from a worldwide point of view (Fábián and Matyasovszky Citation2010), there is relatively large mesoscale spatial diversity in the precipitation supply (Ács and Breuer Citation2013). Based on the Thornthwaite climate classification system, which is also suitable for describing the spatial distribution of the mesoscale hydroclimate of Hungary (Drucza and Ács Citation2006), the water supply of the country varies from dry to damp. The Péczely (Citation1957a, Citation1957b) classification system draws a similar conclusion: based on this method, Hungary can be described as having a dry to temperate moist climate (Ács et al., Citation2013). The mesoscale application of the Feddama (Citation2005) method also characterizes the water supply in Hungary from dry to moist (Breuer et al. Citation2017).
Precipitation variability is primarily influenced by geographical location, as the air masses transporting moisture to this region come from different directions. However, the distribution of air moisture from different source regions producing precipitation over Hungary may depend on synoptic and hemispheric scale processes. Extratropical cyclones are responsible for a large portion of the heat and moisture transport between the tropics and the polar regions. These cyclones, together with their fronts, transport large amount of precipitation to Hungary. The Mediterranean cyclones affect the weather in the Carpathian Basin, especially during the autumn and spring (Kelemen et al. Citation2015). In addition to the precipitation events, they may influence the local convective storms during the summer as well. Therefore, inter-annual and long-term changes in frequency or intensity of these cyclones may significantly affect the regional weather or even climate conditions. Knowledge about current dynamic processes governing water transport to the Carpathian Basin is important for understanding and estimating precipitation supply sensitivity to future changes.
Previous studies related to the precipitation supply of the region investigated macrocirculation patterns and cyclone tracks (Bartholy et al. Citation2006, Kelemen et al. Citation2015) and the sensitivity of convective precipitation to soil hydraulic parameters (Ács et al. Citation2010). However, as far as we know, there is no study available about the origin of air moisture. This study presents the first quantitative estimate of the water vapour contribution from various source regions causing precipitation in Hungary.
Due to the development of Lagrangian models (e.g. Draxler and Hess Citation1998, Stohl and Seibert Citation1998), backward trajectory analysis has become a relatively simple and quick way to determine the source regions of the air moisture of precipitation for a given site. Calculating the evaporation and precipitation fluxes along the backward trajectories, the moisture uptake regions can be identified (Delaygue et al. Citation2000, Sodemann et al. Citation2008, Krklec and Domínguez-Villar Citation2014).
Information about the air moisture source regions may be useful for further studies, especially for palaeoclimatological investigations. The oxygen and hydrogen isotopic ratios are commonly used proxies of palaeoclimatic records, not only in ice cores (Grootes and Stuiver Citation1997, Johnsen et al. Citation1997, Petit et al. Citation1999) and sea sediment cores (Martinson et al. Citation1987), but in terrestrial formations such as speleothems (Spötl and Mangini Citation2002, Griffiths et al. Citation2010, Demény et al. Citation2013), lake sediments (Wolfe et al. Citation2001) and tree rings (McCarroll and Loader Citation2004). The isotopic composition of terrestrial samples and its variability are strongly influenced by the actual isotopic composition of the precipitation.
The effects that influence the stable oxygen and hydrogen isotope ratio of precipitation water in the various physical processes of the hydrological cycle have been investigated since the 1960s (Dansgaard Citation1964, Rozanski et al. Citation1993, Gat Citation1996, Jouzel et al. Citation2009). The five most important factors are (1) moisture source region, (2) temperature, (3) altitude, (4) the continental effect and (5) amount effects. Indeed, the combination of these factors determines the final isotope composition of the precipitation (Lachniet Citation2009). Although deconvoluting the processes governing these effects is not straightforward, there are several empirical relationships between the actual climate parameters (temperature, amount of precipitation) and the isotope ratio that are widely applied in palaeoclimatic reconstructions (e.g. Darling et al. Citation2005).
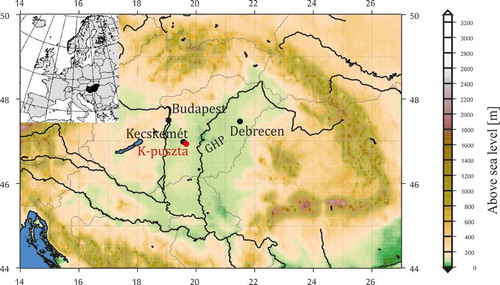
In this study, we focus on the relationship between the water vapour source region and the isotopic composition of the precipitation. For this purpose, daily based precipitation sampling was carried out at the K-puszta (46°58′N, 19°33′E, 126 m) EMEP (European Monitoring and Evaluation Programme) background air pollution station situated near Kecskemét on the Great Hungarian Plain, east Hungary (). The water samples were used to measure the stable hydrogen and oxygen isotope composition of precipitation. Four-day reconstruction of air mass history was used to determine the moisture source of the precipitation, together with the determination of moisture uptake locations based on changes in specific humidity along back trajectories from April 2012 to March 2013.
Figure 1. Location of the studied site (K-puszta) in the Great Hungarian Plain (GHP) in east Hungary. The meteorological data were taken from Kecskemét, which is located ~8 km to the southeast from K-puszta. On the map, Debrecen is also shown, from where relatively long-term stable isotope measurements of precipitation have been published (Vodila et al. Citation2011).
2 Methods
Daily precipitation sampling was carried out from April 2012 to March 2013. The sample collection period covered 24 hours, from 07:00 to 07:00 h UTC the next day. An automatic precipitation collector was used, which was heated above 0°C to melt the snow and to avoid freezing of the collected water during winter. The snow-water equivalent was considered in the case of snow. Additionally, the automatic precipitation collector was equipped with a cap that was only open when precipitation occurred to avoid evaporation during dry periods. After sampling the precipitation, the water samples were stored in a refrigerator in plastic bottles with a double cap to protect the samples from solar radiation and to avoid evaporation.
The isotope composition measurement of the samples was carried out at the Institute for Geological and Geochemical Research, Research Centre for Astronomy and Earth Sciences, Hungarian Academy of Sciences on a Liquid-Water Isotope Analyser-24d (Los Gatos Research). The instrument uses off-axis integrated cavity ring-down spectroscopy to measure the absolute abundances of 2HHO, HH18O and HHO via laser absorption.
Isotopic ratios are reported as δ values with respect to the international Vienna Standard Mean Ocean Water (V-SMOW) standard and in per mil (‰) according to the formula of McKinney et al. (Citation1950):
The uncertainty of the δD measurement is ±0.6‰, while that of the δ18O measurement is ±0.15‰ (V-SMOW).
In order to give an estimation of the air moisture source regions for K-puszta, the backward trajectories for every precipitation event were produced by the HYPSPLIT (HYbrid Single-Particle Lagrangian Integrated Trajectory) model, developed by the National Oceanic and Atmospheric Administration Air Resources Laboratory (NOAA ARL; Draxler and Hess Citation1998) using the database provided by the Global Data Assimilation System (GDAS) with 1° spatial resolution. The model was run at 12:00 UTC for the days when precipitation occurred, for the period April 2012–March 2013. The hourly values of atmospheric pressure, potential and ambient temperature, precipitation and relative humidity were calculated for each trajectory. The trajectories were computed for 96 hours (4 days) back in time at three altitudes: 500, 1500 and 3000 m above ground level.
Moreover, it should be noted that the real precipitation event could have occurred at any time of the rainy day, but unfortunately we do not have any information about the exact time. To evaluate the effect of the possible time lag between the simulated and real precipitation events and the variability of trajectories during rainy days, we randomly selected 12 days from every month of the study period and calculated the trajectories for every hour within the day. We compared the obtained results with the trajectory run at 12:00 UTC. We found that 96% of the trajectories passed the same sector as that assigned to the day based on the trajectory run at 12:00 UTC (for further details, see Supplementary Material).
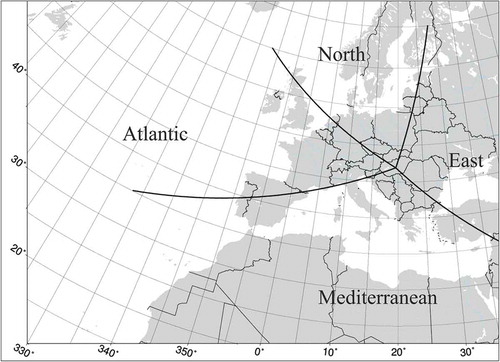
In order to identify the water vapour source regions, the trajectories were classified into sectors, based on the route involved. Four sectors were determined () around the centre point of K-puszta: (1) the Northern European sector; (2) the Eastern European sector; (3) the Mediterranean sector; and (4) the Atlantic sector. The 3° radius (approx. 330 km) neighbourhood around the centre was not considered. An additional group, representing the local convective precipitation events, was defined based on the daily weather report of the Hungarian Meteorological Service. Thus, five groups were defined. It often happened that the route of a single trajectory involved more than one sector. In this case, the locations of the evaporative regions were determined by calculating the specific humidity along each trajectory. We assumed that the increase in specific humidity below the planetary boundary layer is caused by evaporation, while the decrease is caused by precipitation. In the case of an increase in specific humidity above the planetary boundary layer, the location was not considered as a moisture source region. The amount of evaporation was summarized along the trajectories for all of the sectors passed over. Finally, we selected the trajectory from the three different starting heights with the largest amount of moisture uptake and used that for further evaluation (i.e. to classify the sector in which the most water vapour entered the air parcel).
Figure 2. The sectors for determination of precipitation sources of K-puszta.
3 Results
3.1 Weather characteristics
As long-term meteorological data are not available for K-puszta, we compared our results with data from the meteorological station in Kecskemét (WMO ID: 12 970), located ~8 km to the southeast of K-puszta. In Kecskemét, the average annual mean temperature was 9.9°C between 1981 and 2010. The difference between the average temperature of the hottest month (July, 20.9°C) and the coldest (January, −1.5°C) was 22.4°C. The average amount of annual precipitation was 513 mm, the wettest month was June (66.3 mm) on the average, while the driest was March (27.1 mm), but the average monthly precipitation was less than 30 mm in January and February as well. The average relative humidity was 74%. The distribution of the monthly values had a weak seasonal variation: higher values in winter (October–March, 81%), with lower values in summer (April–September, 67%).
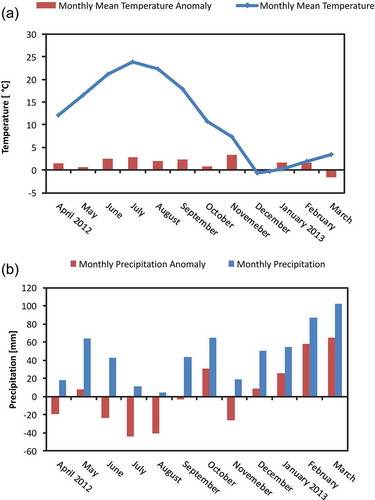
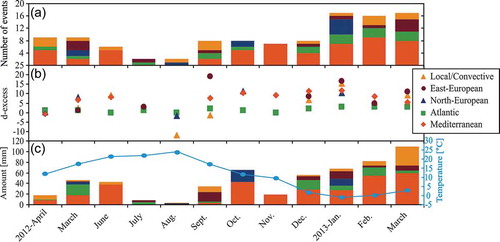
During the study period (April 2012–March 2013), the average monthly temperature was higher than the long-term average value in almost every month ()). Only in February (1.9°C) and March (3.4°C), were the values lower than the long-term average, with 0.1°C and 1.3°C, respectively. The summer months were particularly warmer, with temperatures 2.5°C, 2.9°C and 2°C above the long-term monthly mean in June (21.1°C), July (23.8°C) and August (22.3°C), respectively. The average difference between the long-term average and that in the study period was 1.3°C. The total amount of precipitation was 48.8 mm higher than the average in the reference period ()). In addition, the annual distribution of precipitation had large variability. The summer was extremely dry, causing serious drought in the country; the precipitation amount during the three summer months (58.2 mm) was less than the long-term average amount for June (66.3 mm). In contrast, in the winter months and in March (altogether 293.8 mm), there was much more precipitation than the long-term average (136.6 mm).
Figure 3. (a) Monthly mean temperature (blue) for the study period (April 2012–March 2013) and the differences (red) relative to the long-term average of monthly mean temperature (1981–2010). (b) Monthly amount of precipitation (blue) for the study period (April 2012–March 2013) and the differences (red) relative to the long-term average of monthly precipitation (1981–2010).
3.2 Moisture source regions
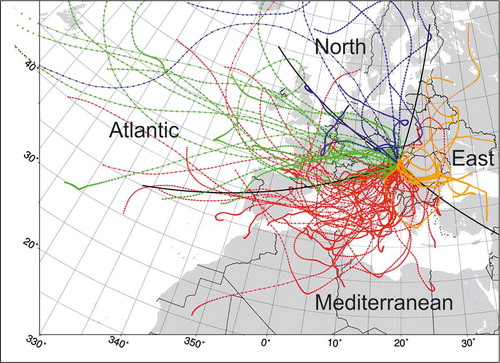
The trajectory and sector analyses suggest that the precipitation in K-puszta derived from different sources in variable proportions (). In the examined period, the Mediterranean Sea was the main source region, as 57.0% of the total amount of annual precipitation derived from that area; approximately 14.2% of the annual precipitation came from the Atlantic region, followed by Northern Europe (7.4%) and Eastern Europe (6.6%). The local precipitation was about 14.8%.
Figure 4. Backward trajectories representing the days with precipitation in the period April 2012–March 2013. The source regions are shown: Mediterranean (red), Atlantic (green), Northern European (blue) and Eastern European (brown).
The monthly distribution of source regions shows an inhomogeneous pattern (). The dominance of the Mediterranean sector was pronounced during the study period (especially in November, when all the precipitation arrived from the Mediterranean sector), except for July and August when K-puszta received no precipitation from the Mediterranean area at all. However, it is worth mentioning that the total precipitation during these months was less than 15.5 mm, thus the contribution from other regions was also very low. Precipitation from the Atlantic and Northern European sectors occurred mostly in the winter half-year (October–March). The moisture from the Eastern European sector had occasional contributions to the precipitation: based on our estimation, a significant amount of water vapour arrived from that area in December 2012 and March 2013. Local precipitation occurred almost every month except for July, October and November.
Figure 5. (a) Distribution of moisture sources based on the number of precipitation events; (b) calculated d-excess of different moisture sources; and (c) distribution of moisture sources based on the amount of the precipitation in different moisture sources.
3.3 Values of δD, δ18O and d-excess
Rainfall δD values ranged from −188.6‰ to −1.5‰, while the δ18O values ranged from −25.1‰ to 0.0‰. The highest δD and δ18O values were found in May, while the lowest were found in January (). The annual mean δD and δ18O were −69.9‰ and −9.6‰, respectively. A clear seasonal cycle can be observed: the highest values of both δD and δ18O occurred mostly in late spring and summer, while the lowest values occurred in winter. The correlation of the two data series is very strong (0.99).
Figure 6. Variation of the stable isotope composition (δD and δ18O) of daily precipitation during the study period.
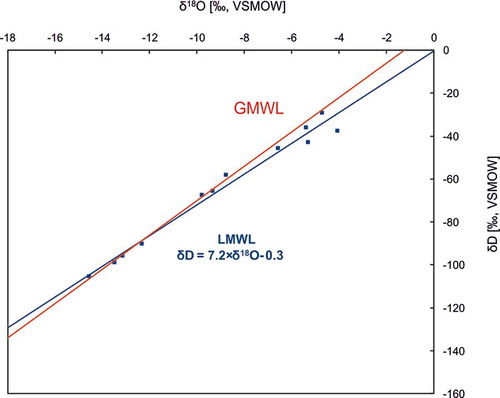
The strong linear connection of δD and δ18O is a global phenomenon, as both oxygen and hydrogen isotopes (in ‰) respond to the same isotopic processes. Dansgaard (Citation1964) defined the global meteoric water line (GMWL: ) using the stable isotope composition of precipitation. Later, the equation of the GMWL was slightly modified by Rozanksi et al. (Citation1993;
) using a larger database. The local meteoric water line (LMWL), which is characteristic for a certain area, can differ from the global line in both slope and intercept according to varying climatic and geographical parameters.
For K-puszta, the equation of the LMWL based on the weighted average of stable isotope composition of monthly precipitation () is .
Figure 7. Amount-weighted stable isotope composition of monthly precipitation in K-puszta with the local meteoric water line (LMWL). The global meteoric water line (GMWL, Craig Citation1961) is also shown.
The concept of deuterium excess was introduced by Dansgaard (Citation1964) and is defined based on the equation of the GMWL, as . The d-excess value of a single atmospheric precipitation sample is believed to be mainly related to the meteorological conditions in the source region in which the precipitating water vapour originated.
The d-excess values of daily precipitation varied from −12.0‰ to 22.0‰. The annual average was 6.8‰, while the annual weighted mean value was 8.5‰. The highest amount-weighted monthly mean of the d-excess value (11.9‰) occurred in September, while the lowest occurred in August (−5.1‰).
4 Discussion
4.1 Variability of the moisture source regions
The main purpose of our study was to determine the source regions of precipitation in K-puszta ().
As mentioned above, the main marine sources of the moisture for the precipitation in K-puszta are the Mediterranean and Atlantic regions. In the following, we compare our results with other parts of Europe where the precipitation is also significantly influenced by these two marine sources. Based on investigations similar to ours, it seems that Switzerland (Sodemann and Zubler Citation2010) and Spain (Krklec and Domínguez-Villar Citation2014) receive a significant amount of precipitation from these sources.
In Switzerland, from 1995 to 2002, the main source region was the Atlantic Ocean area with 39.6% contribution, followed by the Mediterranean Sea (23.3%). The proportion of the continental source was 20.8%, while the Northern European region (North Sea and Baltic Sea) contributed 16.6% to the total precipitation. It is apparent that the major source for the precipitation in Switzerland is the Atlantic Ocean, while in Hungary it is the Mediterranean Sea, although both regions are approximately the same distance from the Mediterranean. The relatively low contribution of the Atlantic to the precipitation in Hungary is likely related to the longer pathway of the air masses transporting Atlantic moisture and to the Alps, which act as a geographical barrier. Most probably a similar process is responsible for the lower contribution of the Northern European region to Hungary’s precipitation, as the Carpathian Mountains can prevent the moisture-laden air masses from the North Sea from reaching the interior.
The seasonal changes in the contribution of the moisture sources in Switzerland show some similarities to our results: in both regions, the Mediterranean source region reaches its maximum contribution in late autumn and spring, while that of the Northern European and Atlantic regions is in winter. However, there is a marked difference during the summer: while in Switzerland the Mediterranean contribution remains high in every summer month, in K-puszta there was no precipitation from that sector in July and August. As the examined periods of the two studies are not the same, this might be caused by the inter-annual variability of the cyclone tracks in the Mediterranean area. Another possible explanation for this difference could be related to the relative proximity of Switzerland to the Gulf of Genoa, which is one of the main Mediterranean cyclogenesis regions (Kelemen et al. Citation2015). Thus, the relatively short-lived summer cyclones cannot reach Hungary but are able to produce precipitation in Switzerland.
Krklec and Domínguez-Villar (Citation2014) investigated the moisture source of the precipitation in Spain from 2009 to 2011. They found that the main moisture sources were the Proximal Atlantic region and the Iberian Peninsula, while the Mediterranean Sea had a lower relative contribution than in Switzerland and Hungary. The contribution of the Atlantic region was the highest in winter, and the lowest in summer, similar to Hungary. Although Spain is located in the western part, while Hungary is situated closer to the eastern part of the Mediterranean region, both places are affected by air masses containing Mediterranean moisture in spring and autumn but from opposite directions. This similar temporal distribution is likely related to the frequency of Mediterranean cyclogenesis, which is largest in spring and autumn (e.g. Kelemen et al. Citation2015).
The summer in the studied period in Spain was characterized by a reduced amount of Mediterranean water vapour, similar to Hungary. However, it is worth mentioning that the summer of 2012 in Hungary was extremely hot and dry. Further investigations would be necessary to clarify whether the lack of Mediterranean moisture, similar to central Spain, was occasional, or whether the typical circulation pattern caused this phenomenon.
It can be concluded that there are relatively large variations in moisture source regions for different locations in Europe. The relative contribution of the Mediterranean Sea to the precipitation in Switzerland and Hungary is large, while it is small in Spain. The contribution of the Atlantic Ocean is typically high for both western European sites, which may be related to the short distance from the Atlantic Ocean, yet it is low in Hungary, as the Alps act as orographic barriers for air masses. Our study also supports the known phenomenon that, in the western part of the extended Mediterranean area, the long-range transport of air moisture plays a key role in precipitation formation, while towards the eastern part of Europe, moisture recycling through thermodynamic processes and local effects (e.g. soil structure) is more pronounced (Gimeno et al. Citation2010, Nieto et al. Citation2010, Drumond et al. Citation2011).
4.2 Variability of stable isotope composition
Besides determining the source regions of the precipitation, we also measured the stable isotope composition of the daily precipitation samples and the results are shown in . The LMWL (), which describes the relationship between δD and δ18O, differs from the GMWL (Craig Citation1961), reflecting the local meteorological conditions. The slope and the intercept of the LMWL () is lower than that of the GMWL (
) (). Additionally, the LMWL differs from the meteoric water line of Debrecen, which is the closest station on the Great Hungarian Plain () where stable isotope measurements of precipitation were performed (Vodila et al. Citation2011). This station gives lower values for the slope and intercept
(Vodila et al. Citation2011) than the water line at K-puszta, especially in the extreme years, which were dry and warm, when the intercepts were even lower (−9.93 in 2002, −22.23 in 2003 and −8.13 in 2007). In 2003 and in 2007 the mean summer temperature was, respectively, 21.7°C and 22.5°C (0.8°C and 1.6°C higher, respectively, than the long-term average, which was determined for the period 1981–2010). The deviation of the temperature of these hot summers from the long-term average in Debrecen is smaller than that in the study period in K-puszta (2.7°C). The lower slope and intercept at both stations are likely related to sub-cloud evaporation of the raindrops, whose impact on the isotopic composition of the precipitation is discussed in more detail in the next section.
4.3 The relationship between source region and stable isotope composition
The d-excess value of the precipitation sample, which was defined by Dansgaard (Citation1964, , is believed to be related to the evaporation conditions of the precipitation source region. Under lower relative humidity, the kinetic fractionation is more pronounced, causing higher d-excess values, while the fractionation under or close to equilibrium conditions might be characterized by lower values (Clark and Fritz Citation1997). As the condensation process in clouds happens close to isotopic equilibrium, the d-excess value of the newly formed raindrops may preserve the value of the source water vapour (Merlivat and Jouzel Citation1979). However, there are some secondary processes that can modify the initial value. Secondary evaporation (the evaporation of the falling raindrops under warm and dry conditions) can reduce the d-excess value (Froehlich et al. Citation2002), while intensive moisture recycling can increase it (Froehlich et al. Citation2008). The effect of secondary evaporation can be especially large during small amounts of precipitation in hot summer months. Indeed, the d-excess shows pronounced variation during the year, which is partly related to the meteorological conditions at the site during the precipitation event. The low d-excess values are typical for events with a low amount of precipitation and/or for events taking place under relatively hot weather conditions. The summer in K-puszta in the examined period was extremely hot and dry, and the amount of daily precipitation was often less than 5 mm. These events are likely affected by secondary evaporation, lowering the original d-values. Therefore, in the following we use amount-weighted mean values, avoiding the significant effect of low amount events (and hence secondary processes) on the final calculated d-excess values.
To highlight the connection between the d-excess value and the source region of the precipitation, the trajectories were selected based on the diagnosed source region, and the weighted mean values were calculated for each sector (). These were compared to the d-excess values measured in stations near to the source regions.
Figure 8. Calculated amount-weighted d-excess for each sector based on the determination of moisture source of daily precipitation.
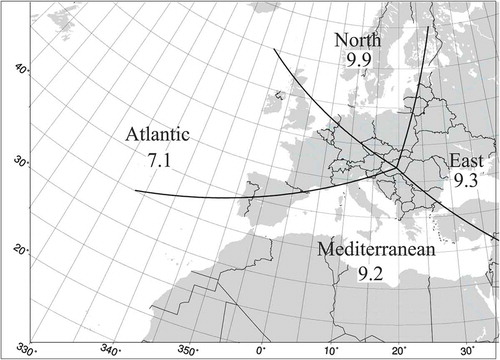
The amount-weighted mean d-excess value of the precipitation at K-puszta originating in the Mediterranean basin is 9.2‰, while for that originating in the Atlantic region the value is 7.1‰. The precipitation originating in the Northern and Eastern European regions is characterized by d-excess values of 9.9‰ and 9.3‰, respectively.
In the middle of the Mediterranean Sea basin, the average d-excess value is higher than the global average, ranging from 15‰ to 28‰. Moreover, along the eastern coast, values above 30‰ can occur (Gat and Carmi Citation1970, Citation1987, Gat and Dansgaard Citation1972, Gat et al. Citation2003). In Athens (Greece), a 9-year weighted mean value was 15‰, in Antalya (Turkey) an 11-year mean value was 19‰. From the isotope composition of rainwater collected in Croatia and Slovenia, calculated d-excess values were lower, varying from 9‰ to 17‰ (Vreca et al. Citation2006).
The d-excess value of the Atlantic region corresponds to the global average or is slightly lower. The 7-year average value of rainwater collected in Valentia (Ireland) is 6.9‰ (IAEA Citation1992). In Spain, the d-excess of Atlantic precipitation is approximately 10‰ (Cruz-San et al. Citation1992). It can be concluded that Mediterranean region precipitation has higher d-excess values than Atlantic precipitation. Our results are consistent with the observations, as the precipitation water had higher d-excess values for the precipitation originating in the Mediterranean region, compared to that from the Atlantic Ocean.
The weighted mean d-excess value is 9.9‰ for the precipitation from the Northern European region, and 82% of the precipitation originating from this area fell in K-puszta in October and January. In this region (North Sea and Baltic Sea), there is high seasonal variability of d-excess. At the station in Lista (Norway) the d-excess of the precipitation varied between 4.1‰ and 11.6‰. Higher values were found in the winter months, lower ones in the spring months (IAEA Citation1992).
The weighted d-excess value for northern precipitation is close to the d-excess values measured in the coastal territory of the North Sea (Lista, Norway) in the winter time (d-excess = 8.4‰). The weighted mean d-excess for the northern precipitation was calculated from 10 events, thus it is not necessarily representative in general.
Although in this study the main focus was on the d-excess values of the precipitation that originated in marine regions, the d-excess of local (convective) precipitation was also evaluated (d-excess = 6.3‰). The numerous processes (including evapotranspiration, moisture recycling and secondary evaporation) and parameters (e.g. stable isotope composition of soil water) determine and affect the isotopic composition of local precipitation. The evaporation of water (e.g. soil, lakes, rivers) would increase, while the secondary evaporation would decrease the d-excess values. Transpiration is not believed to fractionate the original values (Harwood et al. Citation1999, Farquhar et al. Citation2007). However, a detailed discussion of the isotopic composition of the local precipitation events is beyond the scope of this study because it would require additional information on parameters that need to be determined (stable isotope composition of soil water, etc.).
5 Conclusions
This paper presents the first quantitative estimation about air moisture sources of precipitation in Hungary. The examination was carried out for K-puszta and covered a 1-year period, from April 2012 to March 2013.
Backward trajectory analysis was carried out using the Lagrangian HYSPLIT model to evaluate the contributions of the different source regions to the precipitation. For the days with precipitation, we considered the 4-day backward trajectories started at 12:00 h UTC at three elevations: 500, 1500 and 3000 m a.s.l. Moisture uptake areas were identified based on the route involved, the changes in specific humidity along the trajectories and the daily report of the Hungarian Meteorological Service. Finally, we determined five moisture source regions. The identified sources were the following: the Mediterranean Sea, the Atlantic Ocean, Northern Europe, Eastern Europe and local source regions. According to our results during the studied period, the main marine contributor to the precipitation in K-puszta was the Mediterranean Sea (57.0%), followed by the Atlantic Ocean (14.2%). The studied location received significantly less precipitation from the other sources. Comparing our results with other European studies, it can be concluded that the rate of contribution of the Atlantic source is strongly influenced by the geographical and orographic settings. As the air masses from the Atlantic region cross large mountain ranges such as the Alps, which behave as an orographic barrier, the contribution of this source to the precipitation decreases towards the east. Similarly, the Carpathian Mountains may block the majority of the air masses originating from the north and east. According to our study, the Mediterranean area supplies Central Europe with a large amount of water vapour, which contributes to the formation of precipitation. This observation highlights the vulnerability of the precipitation supply of this region to changes in circulation patterns due to global climate change.
In addition to the trajectory analysis, the stable isotope composition of the precipitation water was measured during the study period. The aim was to evaluate the influence of the source region of the water vapour on the isotope composition of the precipitation. The d-excess values of the major marine sources show a systematic distribution; therefore, it can be assumed that the moisture source has a significant influence on the isotope composition of precipitation at K-puszta.
Supplementary Trajectories
Download MS Word (1.9 MB)Supplementary Table
Download MS Excel (16.9 KB)Acknowledgements
We would like to thank the Hungarian Meteorological Service for providing us with the meteorological data and the precipitation samples. We especially appreciate the help of Edit Czágler and Zsolt Varga with sample collection. The authors would also like to thank proofreader Iain Coulthard.
Disclosure statement
No potential conflict of interest was reported by the authors.
Supplementary Material
Supplemental data for this article can be accessed here.
Additional information
Funding
Related Research Data
References
- Ács, F. and Breuer, H., 2013. Biophysical climate classification methods. Budapest: Electronic book (eBook) (in Hungarian).
- Ács, F., et al., 2013. Climate of Hungary in the 20th century according to different climate classification methods (in Hungarian). Légkör, 58, 106–110.
- Ács, F., et al., 2010. Effect of soil hydraulic parameters on the local convective precipitation. Meteorologische Zeitschrift, 19, 143–153. doi:10.1127/0941-2948/2010/0435
- Bartholy, J., Pongrácz, R., and Pattantyús-Ábrahám, M., 2006. European cyclone track analysis based on ECMWF ERA-40 data sets. International Journal of Climatology, 26, 1517–1527. doi:10.1002/(ISSN)1097-0088
- Breuer, H., Ács, F., and Skarbit, N., 2017. Climate change in Hungary during the twentieth century according to Feddema. Theoretical and Applied Climatology, 127, 853–863. doi:10.1007/s00704-015-1670-0
- Clark, I.D. and Fritz, P., 1997. Environmental isotopes in hydrogeology. New York: Lewis Publishers, 328.
- Craig, H., 1961. Isotopic variations in meteoric waters. Science, 133, 1702–1703. doi:10.1126/science.133.3465.1702
- Cruz-San, J., et al., 1992. Sources of precipitation over South Eastern Spain and groundwater recharge – an isotopic study. Tellus, 44B, 226–236.
- Dansgaard, W., 1964. Stable isotopes in precipitation. Tellus, 16, 436–468. doi:10.3402/tellusa.v16i4.8993
- Darling, W.G., et al., 2005. Isotopes in water. In: M.J. Leng, ed. Isotopes in palaeonvironmental research. Dordrecht, NL: Springer, 1–66.
- Delaygue, G., et al., 2000. The origin of Antarctic precipitation: a modelling approach. Tellus, 52B, 19–36. doi:10.3402/tellusb.v52i1.16079
- Demény, A., et al., 2013. Mid-Holocene climate conditions and moisture source variations based on stable H, C and O isotope compositions of speleothems in Hungary. Quaternary International, 293, 150–156. doi:10.1016/j.quaint.2012.05.035
- Draxler, R.R. and Hess, G.D., 1998. An overview of the HYSPLIT_4 modelling system for trajectories, dispersion and deposition. Australian Meteorological Magazine, 47, 295–308.
- Drucza, M. and Ács, F., 2006. Relationship between soil texture and near surface climate in Hungary. Időjárás, 110, 135–153.
- Drumond, A., et al., 2011. A Lagrangian analysis of the variation in moisture sources related to drier and wetter conditions in regions around the Mediterranean Basin. Natural Hazards and Earth System Sciences, 11, 2307–2320. doi:10.5194/nhess-11-2307-2011
- Fábián, Á.P. and Matyasovszky, I., 2010. Analysis of climate change in Hungary according to an extended Köppen classification system, 1971 – 2060. Időjárás, 114, 251–261.
- Farquhar, G.D., Cernusak, L.A., and Barnes, B., 2007. Heavy water fractionation during transpiration. Plant Physiology, 143, 11–18. doi:10.1104/pp.106.093278
- Feddema, J.J., 2005. A revised Thornthwaite-type global climate classification. Physical Geography, 26, 442–466. doi:10.2747/0272-3646.26.6.442
- Froehlich, K., et al., 2008. Deuterium excess in precipitation of Alpine regions – moisture recycling. Isotopes in Environmental and Health Studies, 44, 61–70. doi:10.1080/10256010801887208
- Froehlich, K., Gibson, J.J., and Aggarwal, P.K., 2002. Deuterium excess in precipitation and its climatological significance. In: Proceedings of study of environmental change using isotope techniques, IAEA-CSP-13/P. Vienna: IAEA, 54–66.
- Gat, J.R., 1996. Oxygen and hydrogen isotopes in the hydrologic cycle. Annual Review of Earth and Planetary Sciences, 24, 225–262. doi:10.1146/annurev.earth.24.1.225
- Gat, J.R., et al., 2003. Isotope composition of air moisture over the Mediterranean Sea: an index of the air–sea interaction pattern. Tellus, 55B, 953–965. doi:10.1034/j.1600-0889.2003.00081.x
- Gat, J.R. and Carmi, I., 1970. Evolution of the isotopic composition of atmospheric waters in the Mediterranean Sea area. Journal of Geophysical Research, 75, 3039–3048. doi:10.1029/JC075i015p03039
- Gat, J.R. and Carmi, I., 1987. Effect of climate changes on the precipitation patterns and isotopic composition of water in a climate transition zone: case of the Eastern Mediterranean Sea area. In: S.I. Solomon, M. Beran and W. Hogg, eds. The influence of climate change and climate variability on the hydrologic regime and water researches (Proceedings of Vancouver Symposium). IAHS Publ. Vol. 168, 513–523.
- Gat, J.R. and Dansgaard, W., 1972. Stable isotope survey of fresh water occurrences in Isreal and the Jordan Rift Valley. Journal of Hydrology, 16, 177–211. doi:10.1016/0022-1694(72)90052-2
- Gimeno, L., et al., 2010. On the origin of continental precipitation. Geophysical Research Letters, 37, L13804. doi:10.1029/2010GL043712
- Griffiths, M.L., et al., 2010. Younger Dryas- Holocene temperature and rainfall history of southern Indonesia from δ18O in speleothem calcite and fluid inclusions. Earth and Planetary Science Letters, 295, 30–36. doi:10.1016/j.epsl.2010.03.018
- Grootes, P.M. and Stuiver, M., 1997. Oxygen 18/16 variability in Greenland snow and ice with 10−3- to 10−5-year time resolution. Journal of Geophysical Research - Oceans, 102, 26455–26470. doi:10.1029/97JC00880
- Harwood, K.G., et al., 1999. Determinants of isotopic coupling of CO2 and water vapour within a Quercus petraea forest canopy. Oecologia, 119, 109–119. doi:10.1007/s004420050766
- IAEA, 1992. Statistical treatment of environmental isotope data in precipitation. In: Technical report series no. 331. Vienna: IAEA.
- Johnsen, S.J., et al., 1997. The δ18O record along the Greenland ice core project deep ice core and the problem of possible Eemian climatic instability. Jornal of Geophysical Research, 102, 26397–26410. doi:10.1029/97JC00167
- Jouzel, J., Froehlich, K., and Schotterer, U., 2009. Deuterium and oxygen-18 in present-day: precipitation: data and modelling. Hydrological Sciences Journal, 42 (5), 747–763. doi:10.1080/02626669709492070
- Kelemen, F., Bartholy, J., and Pongrácz, R., 2015. Multivariable cyclone analysis in the Mediterranean region. Időjárás, 119, 159–184.
- Krklec, K. and Domínguez-Villar, D., 2014. Quantification of the impact of moisture source regions on the oxygen isotope composition of precipitation over Eagle Cave, central Spain. Geochimica Et Cosmochimica Acta, 134, 39–54. doi:10.1016/j.gca.2014.03.011
- Lachniet, M.S., 2009. Climatic and environmental controls on speleothem oxygen isotope values. Quaternary Science Reviews, 28, 412–432. doi:10.1016/j.quascirev.2008.10.021
- Martinson, D.G., et al., 1987. Age dating and the orbital theory of the ice ages: developments of a high-resolution 0 to 300,000- year chronostratigraphy. Quaternary Research, 27, 1–29. doi:10.1016/0033-5894(87)90046-9
- McCarroll, D. and Loader, N.J., 2004. Stable isotopes in tree rings. Quaternary Science Reviews, 23, 771–801. doi:10.1016/j.quascirev.2003.06.017
- McKinney, C.R., et al., 1950. Improvements in mass spectrometers for the measurement of small differences in isotope abundance ratios. Review of Scientific Instruments, 21, 724–730. doi:10.1063/1.1745698
- Merlivat, M. and Jouzel, J., 1979. Global climatic interpretation of the deuterium–oxygen-18 relationship for precipitation. Journal of Geophysical Research, 84, 5029–5033. doi:10.1029/JC084iC08p05029
- Nieto, R., et al., 2010. A Lagrangian identification of the main moisture sources and sinks affecting the Mediterranean area. WSEAS Transactions on Environment and Development, 6, 365–374.
- Péczely, G., 1957a. Áramlási helyzetek Magyarországon különböző makroszinoptikus helyzetekben (in Hungarian). Időjárás, 61, 408–419.
- Péczely, G., 1957b. Grosswetterlagen in Ungarn. In: Kleinere Veröffentlichungen der Zentralanstalt für Meteorologie Budapest. Budapest, Vol. 30. (in German).
- Petit, J.R., et al., 1999. Climate and atmospheric history of the past 420,000 years from the Vostok ice core, Antarctica. Nature, 399, 429–436. doi:10.1038/20859
- Rozanski, K., et al., 1993. Isotopic patterns in modern global precipitation. In: P. K. Swart, J. McKenzie and S. Savin, eds. Climate change in continental isotopic records. Washington, DC: Geophysical Monograph Series 78. American Geophysical Union, 1–36.
- Sodemann, H., et al., 2008. Interannual variability of Greenland winter precipitation sources: 2. Effects of North Atlantic Oscillation variability on stable isotopes in precipitation. Journal of Geophysical Research, 113, D12111. doi:10.1029/2007JD009416
- Sodemann, H. and Zubler, E., 2010. Seasonality and inter-annual variability of the moisture sources for Alpine precipitation during 1995-2002. International Journal of Climatology, 30, 947–961.
- Spötl, C. and Mangini, A., 2002. Stalagmite from the Austrian Alps reveals Dansgaard Oeschger events during isotope stage 3: implications for the absolute chronology of Greenland ice cores. Earth and Planetary Science Letters, 203, 507–518. doi:10.1016/S0012-821X(02)00837-3
- Stohl, A. and Seibert, P., 1998. Accuracy of trajectories from the conservation of meteorological traces. Quarterly Journal of the Royal Meteorological Society, 124, 1465–1484. doi:10.1002/qj.49712454907
- Vodila, G., et al., 2011. A 9-year record of stable isotope ratios of precipitation in Eastern Hungary: implications on isotope hydrology and regional palaeoclimatology. Journal of Hydrology, 400, 144–153. doi:10.1016/j.jhydrol.2011.01.030
- Vreca, P., et al., 2006. Isotopic characteristics of precipitation in Slovenia and Croatia: comparison of continental and maritime stations. Journal of Hydrology, 330, 457–469. doi:10.1016/j.jhydrol.2006.04.005
- Wolfe, B.B., et al., 2001. Carbon and oxygen isotope analysis of lake sediment cellulose: methods and applications. In: W.M. Last and J.P. Smol, eds. Tracking environmental change using lake sediments: physical and geochemical methods. Dordrecht, The Netherlands: Kluwer Academic Publishers, Vol. 2, 373–400.