
ABSTRACT
The groundwater flow path plays an important role in maintaining hydrological and ecological quality and security, which are important in the comprehensive management and use of both groundwater and surface water. In this study, an integrated multi-tracer-constrained framework was used to determine the groundwater flow path. The results show that there are shallow and deep flow paths in riverbank filtration, controlled by the different permeabilities of riverbed sediments and aquifers at different depths. The contribution of river water to shallow groundwater is less than that to deep groundwater because of the low permeability of the riverbed sediment in the dense muddy layer in the shallow slope of the river valley. This contribution decreases with increasing distance from the Liao River. The shallow groundwater quality is better than the deep groundwater quality because of its longer residence time.
EDITOR R. WoodsASSOCIATE EDITOR F. Tauro
1 Introduction
Groundwater and surface water are not isolated components in a hydrological system, but interact in a wide range of ways (Sophocleous Citation2002, Yang et al. Citation2014). As a natural filtration system, riverbank filtration provides an interaction and transition zone between groundwater and surface water, and plays an important role in the hydrological cycle (Brunke and Gonser Citation1997, Hiscock and Grischek Citation2002, Polomčić et al. Citation2013). Placing production wells close to a river can induce river recharge to groundwater and facilitate the protection of water quality, because recharge can degrade toxic and hazardous substances, and improve the surface water quality by physical, chemical, and biological filtration (Tufenkji et al. Citation2002, Gandy et al. Citation2007, Diem et al. Citation2013, Huntscha et al. Citation2013). Riverbank filtration is therefore an effective, stable, and easy way to improve water quality. Research that increases our knowledge of riverbank filtration will therefore have widespread practical applications because future population growth will lead to increasing demands for water (Hayashi and Rosenberry Citation2002, Dillon Citation2005, Lee et al. Citation2012, Su et al. Citation2014).
Riverbank filtration provides pretreatment of river water during passage through riverbed sediments. Riverbed sediments have a large impact on the groundwater flow path and differences among the lithological and structural characteristics of riverbed sediments will lead to different flow paths (Bouwer Citation2002, Hancock Citation2002, Massmann et al. Citation2008a, Gianni et al. Citation2016). Under natural conditions and artificial exploitation, frequent and strong interactions occur within the filtration zone. The groundwater flow paths from the river to the production wells govern the quantity and quality of pumped groundwater because different flow paths lead to different seepage times through the filtration zone, affect water–rock reactions and biogeochemical processes, change the degradation rates of biodegradable compounds, and cause differences among the water quantities and qualities at different aquifer depths. This results in stratification of “dirty water” and “clean water” (Alley et al. Citation2002, Haque and Johannesson Citation2006, Massmann et al. Citation2008a, Selle et al. Citation2013, Xie et al. Citation2013).
Determining the groundwater flow path within the riverbank filtration zone and clarifying how environmental parameters and hydrogeochemical process are affected by groundwater exploitation is of great significance for water resource management using filtration zones (Rodgers et al. Citation2004, Kalbus et al. Citation2006). Previous studies have shown that there are significant differences among the biogeochemical processes in different flow paths, but have mostly focused on river–groundwater and water–rock interactions (Haque and Johannesson Citation2006, Kedziorek et al. Citation2008, Xie et al. Citation2013, Postma et al. Citation2017).
A variety of methods have been used to determine the groundwater flow path during riverbank filtration, including hydraulic tests, environmental tracers, and groundwater flow numerical simulation models (Shand et al. Citation2007, Soulsby et al. Citation2011, Koh et al. Citation2012, Partington et al. Citation2013, Kármán et al. Citation2014). Hydraulic tests can provide high-precision hydrogeological information. Large field tests and long-term observations can be used to obtain information of hydrogeological significance (Chapman Citation1999, Kalbus et al. Citation2006). Because many rivers have high contents of organic pollutants, higher than those in the groundwater, organic pollutants have been used as tracers to investigate the relationship between river water and groundwater in recent years (Adams et al. Citation2001, Burkhardt et al. Citation2005, Storteboom et al. Citation2010). Hydrogen and oxygen isotopes are ideal tracers for groundwater flow because they are not changed during the mixing of different water bodies (Massmann et al. Citation2008b, Qin et al. Citation2012). Although groundwater flow numerical simulation models can be used to quantify river–groundwater interactions, the results have a degree of uncertainty because of inaccurate representations of heterogeneity and insufficient knowledge of the spatial distributions of recharge to and discharge from the aquifers in groundwater systems (Harrar et al. Citation2003, Irvine et al. Citation2012, Refsgaard et al. Citation2012). Any one method therefore may not accurately determine the degree and magnitude of the effects of riverbed sediments on groundwater flow paths. Different methods can be combined for effective investigation of groundwater–surface water interactions and determination of groundwater flow paths. A range of studies have been performed to further develop this combined approach (Kinzelbach et al. Citation2003).
Shenyang City is one of the old industrial bases in China, and the industrial, agricultural, and domestic water demand is met mainly by groundwater from river water infiltration. The recharge source for the exploited groundwater in this study is the Liao River, which is one of seven major rivers in China facing serious water quality problems; several organic pollutants (e.g. fluoranthene, benzo[k]fluoranthene, sulfamerazine, and sulfamethoxazole) are still being detected in surface water and groundwater, despite treatment in recent years (Dong et al. Citation2016).
In this study, an integrated multi-tracer-constrained framework for interpreting hydrogeological conditions, water chemistry, typical polycyclic aromatic hydrocarbons (PAHs), new emerging contaminants, and hydrogen and oxygen stable isotopes were used to determine the groundwater flow path. Qualitative and quantitative analyses were used to identify groundwater stratification differences along the flow path at different depths. These differences are controlled by the different permeabilities of the riverbed sediments and the aquifer. The river–groundwater hydrodynamic exchange process was clarified. Our research addresses the present poor understanding of how riverbed sediment differences determine where and how river water recharges groundwater and the lack of research on the spatial distribution of river recharge to the aquifer during riverbank filtration. The aim of this study was to contrast and complement the results obtained using various methods to develop an integrated method for groundwater flow path determination and to clarify the effects of hydrological processes on the biogeochemical activity in the riverbank filtration zone. A combination of various methods was used to determine groundwater flow paths to achieve a better understanding of hydrogeologically similar riverbank filtration settings, and provide useful information to enable the sustainable use of water resources and the protection of riverbank filtration zones.
2 Materials and methods
2.1 Site description
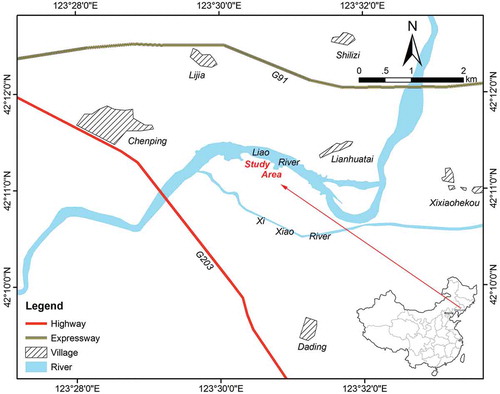
The site is situated 40 km north of Shenyang City, in northeastern China (). It is located on the alluvial and diluvial plain of the Liao River. It is characterized by a flat topography, with land surface elevations varying from 42 to 52 m above sea level. This area is typical of temperate semi-humid monsoon climate. The mean annual temperature is 7°C, with a maximum temperature of 27°C (July) and a minimum temperature of −19°C (January). The mean annual precipitation is 635.5 mm, over 80% of which is concentrated in the flood season from May to September. The mean annual surface water evaporation is 1594 mm. The Liao River flows through the northern part of the study area; it has a width of 100–300 m and a runoff of 7.88–41.8 m3 s−1 (Zhang Citation2015).
Figure 1. Location of the study area.
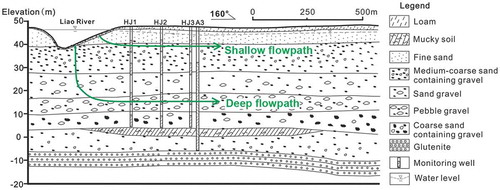
Groundwater is stored in a Quaternary loose phreatic aquifer overlying impermeable Tertiary glutenite and underlying loam and mucky soil of thickness 1–3 m (). The aquifer is about 50 m thick and is composed of fine sand, medium-coarse sand containing gravel, sandy gravel, pebbly gravel, and coarse sand containing gravel. There are 12 pumping wells in the study area. The total amount of groundwater pumped is approximately 30 000 m3 d−1, and has remained stable for many years. As a result, a groundwater depression cone has formed with a groundwater depth of 3 m in the centre and the surrounding groundwater flows toward this centre. The groundwater is always recharged by Liao River water.
Figure 2. Hydrogeological cross-section and groundwater flow paths.
2.2 Monitoring stations
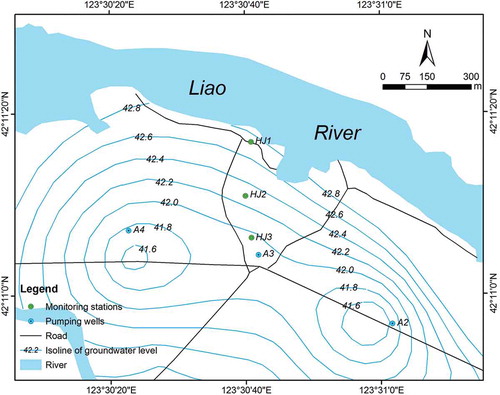
For comprehensive monitoring of the hydrodynamics within the riverbank filtration zone of the Liao River, three monitoring sites were established, i.e. HJ1, HJ2, and HJ3, at distances of 15, 200, and 345 m from the south bank of the river (). Wells of different depths were established within the riverbank filtration zones of the three monitoring sites so that the hydrochemical compositions and 18O and 2H stable isotope compositions could be measured at different depths, and for collection of other relevant information at different depths. The main parameters of the monitoring wells are shown in . The casing diameter of all the wells is 13 cm. We set up an atmospheric precipitation sampling point at A3, an exploitation well 60 m southeast of HJ3. Regional groundwater samples were collected from Dading village.
Table 1. Well depths and construction details.
Figure 3. Distribution of monitoring stations and isolines of groundwater levels.
2.3 Sampling and analysis
Groundwater, river water, and precipitation samples were collected in July, August, September, and October 2014, and in January, March, June, and August 2015 for analysis of major ions and stable isotopes (2H and 18O). Organic samples were collected in August 2014. Groundwater samples were taken after purging the wells until stable values of groundwater temperature, pH, electrical conductivity (EC), and dissolved oxygen (DO), measured using a portable tester (HQ40d; Hach Company, Colorado, USA), were attained. River water samples were taken, using a syringe, directly from the river at a mean depth of 20 cm below the water surface, in the middle of the river. Samples of water (50 mL) were collected in polyethylene bottles, which had been precleaned with deionized water, for major ion and stable isotope analysis; 1 L water samples were collected in brown glass bottles with small openings, which had been precleaned with deionized water, for organic pollutant analysis. The precipitation samples were collected in polyethylene bottles containing a very small amount of pre-injected liquid paraffin to prevent evaporation. The bottles were preserved with a sealing membrane.
Major ions were determined using ion chromatography (881 Compact IC; Metrohm, Herisau, Switzerland), and organic pollutants were determined using gas chromatography (Agilent 7890A) and liquid chromatography (Agilent 1200; Agilent Technologies, Inc., CA, USA) at the Institute of Water Resources and Environment, Jilin University. Oxygen and hydrogen analyses were performed at the Pri-eco Technology Co., Ltd., China, using a Picarro L2130-i analyzer (Picarro Inc., CA, USA). The results were expressed using a thousand-score deviation relative to Vienna Standard Mean Ocean Water (VSMOW), with standard deviations of 0.5‰ and 0.1‰ for 2H and 18O, respectively.
2.4 Water seismic wave reflection
In September 2015, the project team conducted a geophysical exploration of the Liao River in the study area using the water seismic wave reflection method. The basic principle is as follows: because of the differences among wave impedances in different media, when a point source excitation seismic wave is incident to the lithological medium interface, seismic waves are reflected in the ground at different medium interfaces, and the received seismic wave field changes. Based on the seismic time profiles obtained from seismic data, the characteristics of reflected wave fields can be studied and compared with existing geological data to determine the standard reflection horizon. The other wave groups under the top of the bedrock are analyzed, the interfaces for different media are determined, and the lithological composition and its structural features can be identified.
According to the solid elastic kinetic theory, seismic waves propagated in a uniform, homogeneous, and ideal elastic medium satisfy the elastic wave propagation equation, which can be expressed in the Cartesian coordinate system as follows (Bedford and Drumheller Citation1994, Touhei Citation2011):
where vector U is the displacement of the medium by an external force (F), referred to as the displacement vector; U = U(u,v,w), where u, v, and w are the displacement components of the three coordinate axes x, y, and z. Vector F is the external force acting on the medium, referred to as the force vector; F = F(Fx,Fy,Fz), where Fx, Fy, and Fz are the three force components. The constants λ and μ are the elastic constants of the medium, and are referred to as the Lamé constants. The constant ρ is the density of the medium. The scalar θ is the volumetric coefficient.
The Mini-Trace II data acquisition/processing system (24-bit), Mini-Streamers Hydrophone arrays, and Geo-Spark 1000 J PPS (Geo Marine Survey Systems B.V., Rotterdam, The Netherlands) were used for seismic data acquisition. The interpretation software GeoSuite AllWorks was used.
2.5 Particle analysis of aquifer media
Soil samples were collected at different depths from the southern bank of the Liao River in August 2015. Particle analysis was performed using a sieve method at the Institute of Water Resources and Environment, Jilin University. A grain-size distribution curve was generated for each depth and was used to estimate the hydraulic conductivities of the sands using the following methods (Song et al. Citation2009):
Hazen method (used for sands with an effective grain size of approximately 0.1–3.0 mm):
Terzaghi method (used for large-grain sands):
Kozeny method (used for large-grain sands):
where C is Hazen’s empirical coefficient, which takes a value between 0.0 and 1.5, with an average value of 1.0; dm is the diameter of the mth percentile grain size (mm); e is the porosity ratio; n is the porosity; and K and K18 are the hydraulic conductivities (cm s−1) of the medium at 20 and 18°C, respectively.
2.6 Slug tests
Slug tests were performed on the riparian bank monitoring wells at HJ1 in August 2015. The slug, which was made of poly(vinyl chloride) tubing (120.0 × 4.0 cm), was filled with sand, capped, and sealed. The head changes during the slug tests were collected using a dipperLog water level logger (Heron Instruments Inc., Ontario, Canada); these have a 0.05% accuracy and a 0.006% resolution, and record data every second. The hydraulic conductivity of the aquifer was determined from the slug test using the methods proposed by Hvorslev (Citation1951) and Bouwer and Rice (Citation1976), solved using Aquifer Test v3.0 (Waterloo Hydrogeologic, Inc., Ontario, Canada).
2.7 Mixing model for hydrogen and oxygen isotopes
Groundwater and river water sources involved in mixing can be characterized as end-members of a mixed sample, and their relative contributions can be estimated using an end-member mixing model, which is based on mass conservation (Martinez et al. Citation2017). End-member mixing hypothesizes that compositional variations among samples are the result of physical mixing of a fixed number of end-members (Weltje Citation1997).
In this study, for two water bodies with different isotope values in the mixing process, the isotope composition can be determined as:
where δ1, δ2, and δ are the isotope values for different end-member water bodies (river water, regional groundwater), and the mixed water sample (local groundwater); n1 and n2 are the proportions of different end-member water bodies in the mixed water sample.
3 Results and discussion
3.1 Permeability of riverbed sediments and aquifer media
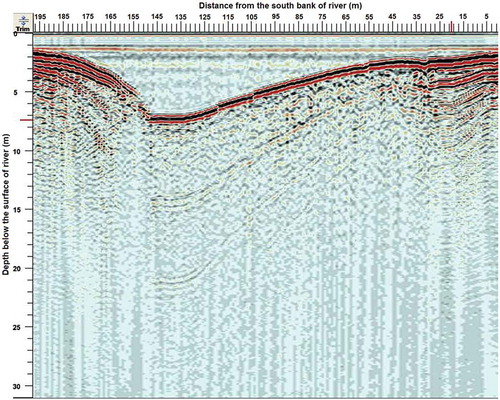
The geophysical exploration profile is shown in . At 0–27 m and 179–197 m from the south bank of the Liao River, the reflected wave is less than that at the riverbed centre, indicating that the lithology of the sediments changes little. The continuity of the reflected wave is high, indicating that the lithology continuity is high, and there are clear signs of stratification. In the middle part of the riverbed, the reflected waveform is not stable and multiple reflection waves are formed, which indicates that the lithology changes frequently and the differences are large. The persistence range of the reflected wave is small, and is difficult to track continuously, which shows that the deposition stability is very low, the horizontal continuity of the formation is very low, and the intergranular spaces in the sediments are large.
Figure 4. Geophysical profile of river sediments.
The particle analysis results show the grain-size distributions for samples collected at different depths in the riverbank filtration zone (). At a depth of 20 m there is medium-coarse sand containing gravel, at a depth of 35 m sandy gravel and pebbly gravel predominate, and at a depth of 45 m coarse sand containing gravel predominates. These results show that the particle size increases from top to bottom. shows the typical recovery time for a slug test and fit of data for estimating the hydraulic conductivity. The hydraulic conductivities at depths of 10, 20, 35, and 45 m were calculated based on the grain-size analysis and slug tests (). The estimated hydraulic conductivity up to a depth of 20 m below the ground surface ranged from 6.5 to 35.1 m d−1, whereas that below 20 m ranged from 52.0 to 91.5 m d−1.
Table 2. Hydraulic conductivities estimated from grain-size analysis and slug tests.
Figure 5. Grain-size curves for soil samples.
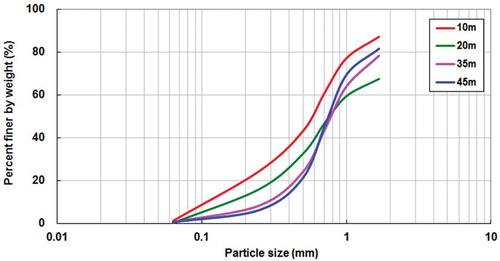
Figure 6. Example of typical recovery time and fit of data for estimating hydraulic conductivity.
3.2 Water chemistry
The results of chemical analysis of groundwater and surface water samples are shown in a Piper diagram in . The major-ion results show that calcium is the dominant cation, and chloride and bicarbonate are the dominant anions in the river water samples. Most of the samples are characterized as Ca–HCO3–SO4–Cl or Ca–Na–HCO3–Cl water types, and the EC values are in the range 480–610 μS cm−1. In the shallow groundwater samples from a well depth ≤20 m, calcium is the dominant cation, and bicarbonate is the dominant anion; they are mostly characterized as Ca–Mg–HCO3 or Ca–HCO3 water types, with EC values in the range 602–1402 μS cm−1. In the deep groundwater samples, from a well depth >20 m, calcium is the dominant cation, and chloride and bicarbonate are the dominant anions; most are characterized as Ca–HCO3–Cl or Ca–Na–HCO3–Cl water types, and the EC values are in the range 477–534 μS cm−1 for HJ1, 544–626 μS cm−1 for HJ2, and 662–867 μS cm−1 for HJ3 (, ).
Table 3. Electrical conductivities (μS cm−1) of river water and groundwater at different times.
Figure 7. Piper diagram of river water and groundwater samples.
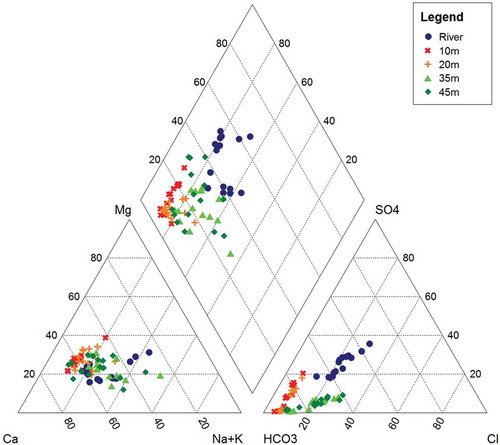
Figure 8. Box charts of (a) electrical conductivity and (b) chloride ion concentration.
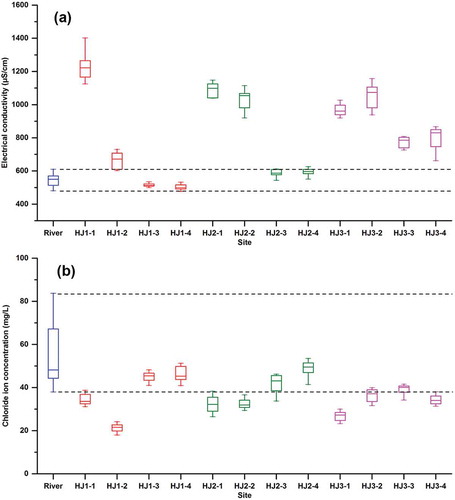
The chloride ion concentration in the river is in the range 37.96–83.74 mg L−1, 17.99–39.99 mg L−1 in the shallow part, and 31.36–53.55 mg L−1 in the deep part. It is evident that the chloride ion concentration in deep groundwater is close to that in the river (, ). Overall, the hydrochemical composition of the water is similar for the river and deep groundwater, and the differences between river water and groundwater increase gradually with increasing distance from the Liao River, as the contribution from the river to the groundwater gradually decreases.
Table 4. Chloride ion concentrations (mg L−1) of river water and groundwater at different times.
3.3 Organic pollutant tracers
The Liao River flows through industrial and agricultural catchment centres around Shenyang, such as Benxi and Anshan (metal working), Liaoyang and Panjin (chemical and oil industries), and Fushun and Tieling (coal and energy industries). In recent years, pollution of the Liao River has continued to increase, and the river ecosystem is under great pressure, mainly as a result of organic pollution. The main sources of organic pollutants in the Liao River are industrial wastewater, urban domestic sewage, and agricultural and livestock pollution.
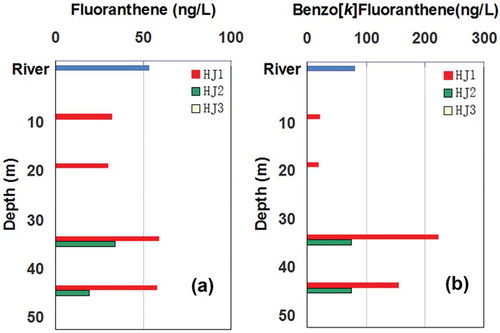
Polycyclic aromatic hydrocarbons are typical organic environmental pollutants. Monitoring data show that in 2005, 2007, and 2010, the PAH concentrations in the river were 946.1–13 448.5, 216–1360, and 32.6–108.5 ng L−1, respectively (Guo et al. Citation2007, Han et al. Citation2009, Hu et al. Citation2016). The concentrations of fluoranthene and benzo[k]fluoranthene at different depths and locations in the study area are plotted in . In shallow groundwater, the concentrations of fluoranthene and benzo[k]fluoranthene were lower than 30 ng L−1. This is low compared to the concentrations in deep groundwater, where that of fluoranthene was 50 ng L−1 or more, and that of benzo[k]fluoranthene was 150 ng L−1 or more. This is consistent with the results of Massmann’s research. The poorly permeable sludge on the shore has a significant blocking and degradation effect on PAHs. The permeability of the deep aquifer is better, and the connectivity with the lake is better, therefore the degradation effect is weaker. The PAHs in the shallow groundwater mainly come from recent pollution, whereas those in the deep groundwater mainly come from historical pollution (Massmann et al. Citation2008b).
Figure 9. Variations in concentrations of typical polycyclic aromatic hydrocarbons with depth and distance from the river.
Newly emerging contaminants are not covered by a legal framework for environmental protection. Such pollutants, which are generated in the construction industry or by other activities, damage the environment. The Tonglian Group Shenyang Antibiotic Factory is located in Hushitai Town, Shenyang City, about 20 km from the study area. Antibiotics are widely used in medicine, aquaculture, and animal husbandry, and they enter the soil and water environments in various ways. Agriculture and animal husbandry are the main economic pillars of Hushitai Town, therefore antibiotics are probably widely used there. This greatly increases the risk of antibiotic pollution of water bodies in the study area.
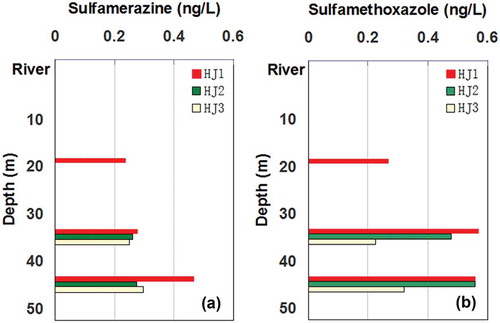
Monitoring data show that in 2011, 2013, and 2015 the concentrations of sulfonamide antibiotics in the river were 0.8–40.6, 0–91, and 0–44.1 ng L−1, respectively (Yang et al. Citation2012, Qin et al. Citation2015, Dong et al. Citation2016). We selected sulfamerazine and sulfamethoxazole as examples of these newly emerging contaminants and investigated the spatial changes in their concentrations in groundwater. In the river water and shallow groundwater, the concentrations of sulfamerazine and sulfamethoxazole are relatively low, and those in some individual samples are below the detection limit (). However, in the deep groundwater the concentration rises and is relatively high, probably for historical reasons, as described above.
Figure 10. Variations in concentrations of typical newly emerging contaminants with depth and distance from the river.
3.4 Hydrogen and oxygen composition of groundwater and river water
We used the monitoring data for precipitation isotopes in this area to obtain the local meteoric water line (LMWL) equation: δ2H = 6.83δ18O − 4.74. The LMWL slope of 6.83 is less than that of the global meteoric water line (GMWL). This is because the study area is located in arid and semiarid areas, with low humidity, low precipitation, and high evaporation.
Three groups of water bodies (river water, regional water, and local groundwater) were distinguished using hydrogen and oxygen stable isotope data (, ). The data near the LMWL clearly show that local precipitation is the main source of river water, regional groundwater, and local groundwater in the study area.
Table 5. Values of δ2H and δ18O (‰ vs Vienna Standard Mean Ocean Water) of river water, regional groundwater, and local groundwater at different times.
Figure 11. Plots of δ2H and δ18O of river water, regional groundwater, and local groundwater.
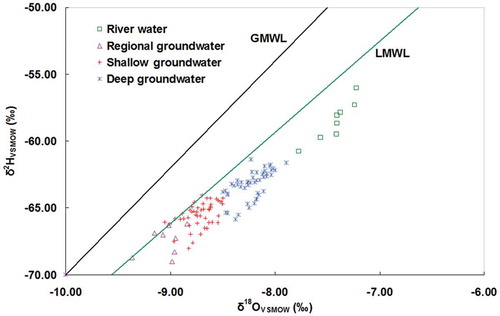
The river water points are distributed to the right side of the LMWL; the values of δ18O and δ2H are −7.77 to −7.22‰, and −60.76 to −56.03‰, respectively, and the average values are −7.42 and −58.49‰, respectively. The slope is significantly less than that of the LMWL; this indicates a strong evaporation effect, which results in different degrees of 2H and 18O enrichment. The regional groundwater points are distributed on both sides of the LMWL, which is evidence that the regional groundwater is mainly recharged by atmospheric precipitation. The values of δ18O and δ2H are −9.36 to −8.84‰ and −69.03 to −66.20‰, respectively, and the average values are −9.04 and −67.46‰, respectively. The local groundwater points are distributed to the right side of the LMWL; the values of δ18O are −9.05 to −7.89‰, with an average of −8.47‰, and the values of δ2H are −68.04 to −61.39‰, with an average of −64.38‰. The results for local groundwater are therefore intermediate between those for river water and regional groundwater.
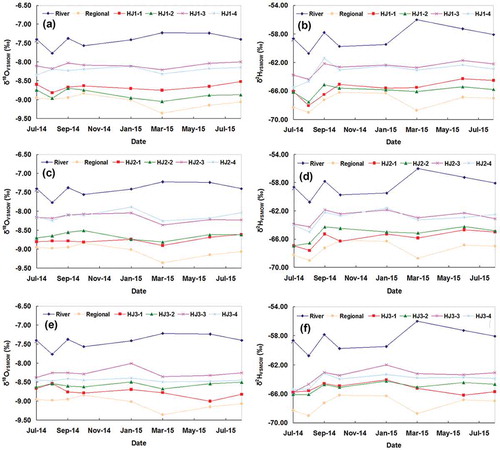
The trends in δ18O and δ2H with time for river water, regional groundwater, and local groundwater show that there is little seasonal variation, and that the δ18O and δ2H values for local groundwater are always between those for river water and regional groundwater (). At the HJ1 site, which is the nearest the river, the δ18O values for shallow groundwater (groundwater at a depth of less than 20 m, monitored at wells HJ1-1 and HJ1-2) are −9.05 to −8.52‰. Deep groundwater at HJ1 (groundwater at a depth of more than 20 m, monitored at wells HJ1-3 and HJ1-4) has δ18O values of −8.35 to −8.00‰. Enrichment by 18O is greater for deep groundwater than for shallow groundwater, which is closer to that of river water. At the HJ2 site, which is 200 m from the river, the enrichment becomes similar to that at the HJ1 site with increasing distance from the river, but the difference between the deep groundwater and shallow groundwater decreases. At the HJ3 site, which is 345 m from the river, the difference is much smaller.
Figure 12. Time series of δ2H and δ18O for river water, regional groundwater, and local groundwater.
3.5 Control of riverbed sediments on groundwater flow path during riverbank filtration
Changes in the lithological and structural characteristics of riverbed sediments directly affect the strength of hydraulic exchange because the sediments are the direct contact interface between the river and groundwater. This leads to different hydraulic connections in different locations, and affects the velocity of water movement as well as the flux of nutrients during riverbank filtration, thereby affecting the groundwater quality. Identification of the hydrogeological conditions of the riverbank filtration zone combined with geophysical exploration can provide a basis for clarifying the hydraulic exchange characteristics of river and groundwater.
From the characteristics of the reflected wave for riverbed sediments, it can be concluded that in the ranges 27 m from the southern bank to the river centre and 18 m from the northern bank to the river centre the horizontal continuity and stratification of the riverbed sediments are high, and interlayer spaces are small, resulting in low permeability. In the middle of the riverbed, the sediment horizontal continuity is low, stratification is low, and the interlayer spaces are relatively large, indicating relatively high permeability. It can be seen that the riverbed sediments show significant heterogeneity. The permeability of the main channel is stronger and the river recharge rate is higher than those of both sides of the riverbank.
Although geophysical exploration can show the lithological distribution of riverbed sediments and the aquifer medium intuitively, it cannot indicate the permeability of the medium and the related lithological characteristics. It is therefore necessary to perform particle analysis and slug tests. The estimated hydraulic conductivity suggests that the aquifer medium in the riverbank filtration zone shows significant heterogeneity. Because of the coarse lithology below 20 m, the permeability of the deep aquifer is higher than that of the shallow aquifer.
3.6 Hydraulic exchange extent between river water and shallow and deep groundwater
3.6.1 Electrical conductivity and chloride ion
To some extent, the EC reflects the runoff path and residence time of water in the hydrological cycle. In general, the longer the flow path, the higher are the EC values. Because of the low permeabilities of the sediments on both sides of the riverbank and the shallow aquifer medium, the infiltration time is relatively long in the shallow area, the flow path is longer, and the corresponding EC values are higher. In contrast, the EC values of the water are similar for the river and deep groundwater, because the river and underlying deep groundwater are closely linked through the main channel where the permeability is high. The EC values increase with increasing distance from the Liao River, and the difference between the EC values for the river and deep groundwater gradually increase. The chloride ion content is low, and varies greatly among different water bodies. In natural groundwater, chloride ions come mainly from rivers. The chloride ion concentration in shallow groundwater is generally lower than that in the river, indicating that there is a weak hydraulic connection.
3.6.2 Organic pollutants
The differences among the hydraulic exchange intensities of the river, and the shallow and deep groundwater result in different groundwater qualities at different depths. Typical PAHs and new emerging contaminants in the study area were selected to verify the two flow paths based on analysis of the water quality difference.
The study area is located in a reservoir area, and there are almost no industrial, agricultural, animal husbandry, or other human activities within the study area. The PAHs and antibiotics in the groundwater are therefore derived from the infiltration of river water. The concentration of organic pollutants in the groundwater is high, mainly as a result of accumulation by river water recharge.
The grain size of riverbed sediments in the nearshore zone associated with the shallow groundwater is classified as fine, and consists mainly of silty loam and loamy sandy soil. With increasing distance from the shore, the sediments become fine and medium-fine sand, with low permeability coefficients, leading to low flow velocities, and the river infiltration rate is slow. As pollutants migrate downwards, the organic pollutants are more likely to be adsorbed or biodegraded by microorganisms in sediments, where there are adequate reactions between infiltration water and sediments, and the attached microorganisms; the concentration of organic pollutants in the shallow groundwater therefore decreases and is relatively low.
At the river centre, associated with the deep aquifer, the surface sediments on the riverbed are very thin, and consist of medium-coarse sand and coarse gravel. The permeabilities of these sediments are high. As contaminants move down and DO is depleted, biogeochemical reactions (dissolution, sorption–desorption, and oxidation–reduction) slow down, therefore the organic pollutant attenuation rate is low, leading to high concentrations in deep groundwater. However, with increasing distance from the river, a series of biogeochemical reactions occur along the groundwater flow path, allowing organic pollutants to degrade and the contaminant concentration to decrease. The above analysis shows that the river and underlying deep groundwater are closely linked through the main channel, the infiltration rate of the river to the deep aquifer is faster than to the shallow aquifer, and the impact of the river on deep groundwater weakens as the flow path increases.
3.6.3 Δ2H and δ18O
The hydraulic exchange characteristics of river water and groundwater differ at different depths because of the heterogeneity of riverbed sediments and the aquifer medium. To confirm this, the hydrogen and oxygen stable isotopes in river water and groundwater were analyzed to identify the transformation between river water and groundwater, and clarify the hydrodynamic changes involved in riverbank filtration.
Because of the influence of meteorological factors, latitude, altitude, precipitation, and evaporation, the hydrogen and oxygen stable isotope compositions of atmospheric precipitation in different areas differ greatly. A comparison of the distribution ranges and average values of hydrogen and oxygen stable isotopes for river water, regional groundwater, and local groundwater shows that 18O and 2H enrichment is highest for river water and lowest in regional groundwater. The distribution ranges and average values of local groundwater hydrogen and oxygen stable isotopes are between those for river water and regional groundwater. The good linear distribution of isotope data for river, regional groundwater, and local groundwater shows that the two end-members of local groundwater are river water and regional groundwater, and that local groundwater mainly originates from infiltration of river water and lateral recharge of regional groundwater.
The hydrogen and oxygen stable isotope values for deep groundwater are closer to the values for river water. It can therefore be concluded that the recharge of deep groundwater from river water is greater than that for shallow groundwater. However, with increasing distance from the river, the differences among the hydrogen and oxygen stable isotope values for deep and shallow groundwater gradually decrease. The effect of the river on deep groundwater therefore gradually decreases with increasing distance from the Liao River.
3.7 Contribution of river water recharge to shallow and deep groundwater based on δ2H and δ18O
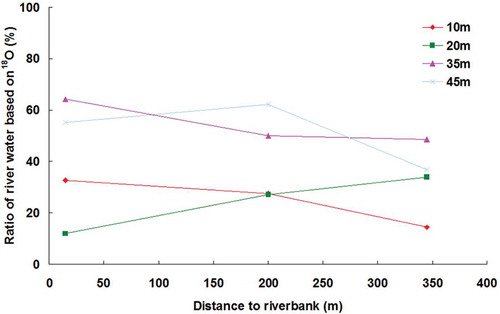
The hydrogen and oxygen isotope mass balance model was used to calculate the contributions of different end-member water bodies of local groundwater at different locations and depths for August 2015 (). The spatial variations in the river water recharge rates show that the contributions of river water to shallow groundwater and deep groundwater are clearly different: for the shallow groundwater, the contribution by river water infiltration is 10–40%, whereas for the deep groundwater, the proportion is more than 50% (). The river recharge ratio decreased from 60 to 40% with increasing distance from the Liao River, showing an overall decreasing trend. Because the screens of the pumping wells are installed below a depth of 20 m, and because silt in the river bank is distributed heterogeneously, there is a thinning trend from the river bank to the river centre. The deep groundwater is therefore more affected by river water infiltration.
Table 6. Proportions of river water in local groundwater.
Figure 13. Ratio variations for river water at different locations and depths.
The hydrogeological conditions of the study area, water chemical analysis results, hydrogen and oxygen stable isotope contents, and concentrations of PAHs and newly emerging contaminants suggest that there are two main types of flow path from the river to the production wells, i.e. shallow and deep flow paths ().
The shallow flow path involves lateral flow through a low-permeability layer perpendicular to the southern bank of the river. The river water infiltrates into the shallow aquifer from both sides of the riverbank, and the aquifer medium is mostly silty sand and fine sand; this results in longer migration times because of the low permeability. The deep flow path involves vertical flow through a high-permeability layer perpendicular to the bottom of the river. The river water infiltrates into the deep aquifer from the main channel of the river, and the aquifer medium is mostly medium-coarse sand, sandy gravel, and coarse sand containing gravel; this results in inadequate biogeochemical reactions.
We observed that different flow paths, mainly caused by riverbed sediment differences, can affect the rate of seepage through the riverbank filtration zone, which affects particular interactions such as water–rock reactions, and biogeochemical processes. This results in deterioration of the groundwater quality as a result of transported organic carbon, suspended solids, microorganisms, and specific organic pollutants that are difficult to degrade and to remove from the aquifer. This causes water quantity and quality differences at different depths of the aquifer, resulting in stratification of “dirty water” and “clean water”.
4 Conclusions
The aim of this study was to determine the groundwater flow path. The major ions, organic pollutants, δ2H and δ18O were used as tracers to constrain and delineate the details of the infiltration processes in the Liao River in Liaoning province, northeast China. In this case study area, groundwater has a close hydraulic relationship with the river, and recharge from rivers is an important replenishment source in the case of riverside pumping. The shallow groundwater is a mixture of river water and regional groundwater, and the contribution to the shallow groundwater of river infiltration is 10–40%, whereas for the deep groundwater the contribution by river water is more than 50%. The effect of river infiltration declines with increasing distance from the river bank to the pumping wells. River water infiltrates into the phreatic water, therefore riverbed sediments have a clear effect on this relationship because they are the direct contact interface between the river and groundwater. The groundwater quality is better in the shallow layers than in the deeper layers because of biogeochemical reactions in the dense muddy layer in the shallow slope of the river valley. The organic mass concentration is low in the shallow groundwater, but high in the deep groundwater, implying that the deep groundwater has a closer hydraulic relationship with the river water than does the shallow groundwater.
The groundwater flow path was identified based on multiple tracers in the Liao River. There are two main types of flow path from the river to the production wells, i.e. shallow and deep flow paths. The shallow flow path involves lateral flow through a low-permeability layer, and the deep flow path involves vertical flow through a high-permeability layer. There are significant differences between the biogeochemical processes in the different flow paths.
Use of a combination of various environmental tracers provides an improved scientific basis for understanding flow paths during riverbank filtration affected by groundwater exploitation, and demonstrates the value of a comprehensive approach to understanding river–groundwater interactions. It is important to understand the effects of hydrological processes on biogeochemical activities in the riverbank filtration zone to assess the water quality in aquifers and develop a conceptual model of groundwater flow paths, which may be typical of hydrogeologically similar riverbank filtration settings (wide surface water bodies, impermeable and heterogeneous riverbed sediments, and heterogeneous aquifers). Comprehensive site knowledge provides necessary reference data for water managers and enables rational use of water resources to meet human demands for safe water.
Disclosure statement
No potential conflict of interest was reported by the authors.
Additional information
Funding
References
- Adams, S., et al., 2001. Hydrochemical characteristics of aquifers near Sutherland in the Western Karoo, South Africa. Journal of Hydrology, 241, 91–103. doi:10.1016/S0022-1694(00)00370-X
- Alley, W.M., et al., 2002. Flow and storage in groundwater systems. Science, 296, 1985–1990. doi:10.1126/science.1067123
- Bedford, A. and Drumheller, D.S., 1994. Introduction to elastic wave propagation. New York: Wiley.
- Bouwer, H., 2002. Artificial recharge of groundwater: hydrogeology and engineering. Hydrogeology Journal, 10, 121–142. doi:10.1007/s10040-001-0182-4
- Bouwer, H. and Rice, R.C., 1976. A slug test for determining hydraulic conductivity of unconfined aquifers with completely or partially penetrating wells. Water Resources Research, 12 (3), 423–428. doi:10.1029/WR012i003p00423
- Brunke, M. and Gonser, T., 1997. The ecological significance of exchange processes between rivers and groundwater. Freshwater Biology, 37, 1–33. doi:10.1046/j.1365-2427.1997.00143.x
- Burkhardt, M., et al., 2005. Surface runoff and transport of sulfonamide antibiotics and tracers on manured grassland. Journal of Environmental Quality, 34, 1363–1371. doi:10.2134/jeq2004.0261
- Chapman, T., 1999. A comparison of algorithms for stream flow recession and baseflow separation. Hydrological Processes, 13, 701–714. doi:10.1002/(ISSN)1099-1085
- Diem, S., Cirpka, O.A., and Schirmer, M., 2013. Modeling the dynamics of oxygen consumption upon riverbank filtration by a stochastic-convective approach. Journal of Hydrology, 505, 352–363. doi:10.1016/j.jhydrol.2013.10.015
- Dillon, P., 2005. Future management of aquifer recharge. Hydrogeology Journal, 13, 313–316. doi:10.1007/s10040-004-0413-6
- Dong, D., et al., 2016. Antibiotics in water and sediments from Liao River in Jilin Province, China: occurrence, distribution, and risk assessment. Environmental Earth Sciences, 75, 1202. doi:10.1007/s12665-016-6008-4
- Gandy, C.J., Smith, J.W., and Jarvis, A.P., 2007. Attenuation of mining-derived pollutants in the hyporheic zone: A review. Science of the Total Environment, 373, 435–446. doi:10.1016/j.scitotenv.2006.11.004
- Gianni, G., et al., 2016. Rapid identification of transience in streambed conductance by inversion of floodwave responses. Water Resources Research, 52, 2647–2658. doi:10.1002/2015WR017154
- Guo, W., et al., 2007. Contamination characters of polycyclic aromatic hydrocarbons in Daliao River system of China. Chinese Journal of Applied Ecology, 18 (7), 1534–1538. in Chinese.
- Han, F., Ma, X., and Liu, Y., 2009. Pollution level and source apportionment of polycyclic aromatic hydrocarbons (PAHs) in Liaohe River. Journal of Meteorology and Environment, 25 (6), 68–71. in Chinese.
- Hancock, P.J., 2002. Human impacts on the stream-groundwater exchange zone. Environmental Management, 29 (6), 763–781. doi:10.1007/s00267-001-0064-5
- Haque, S. and Johannesson, K.H., 2006. Arsenic concentrations and speciation along a groundwater flow path: the Carrizo Sand aquifer, Texas, USA. Chemical Geology, 228, 57–71. doi:10.1016/j.chemgeo.2005.11.019
- Harrar, W.G., Sonnenborg, T.O., and Henriksen, H.J., 2003. Capture zone, travel time, and solute-transport predictions using inverse modeling and different geological models. Hydrogeology Journal, 11, 536–548. doi:10.1007/s10040-003-0276-2
- Hayashi, M. and Rosenberry, D.O., 2002. Effects of ground water exchange on the hydrology and ecology of surface water. Groundwater, 40 (3), 309–316. doi:10.1111/gwat.2002.40.issue-3
- Hiscock, K.M. and Grischek, T., 2002. Attenuation of groundwater pollution by bank filtration. Journal of Hydrology, 266, 139–144. doi:10.1016/S0022-1694(02)00158-0
- Hu, J., et al., 2016. Distribution characteristics and source apportionment of polycyclic aromatic hydrocarbons (PAHs) in the Liao River drainage basin, northeast China. Environmental Monitoring and Assessment, 188, 277. doi:10.1007/s10661-016-5123-8
- Huntscha, S., et al., 2013. Degradation of polar organic micropollutants during riverbank filtration: complementary results from spatiotemporal sampling and push-pull tests. Environmental Science & Technology, 47, 11512–11521. doi:10.1021/es401802z
- Hvorslev, M.J., 1951. Time lag and soil permeability in ground-water observations. Vicksburg, MS: U.S.Army Corps of Engeneers Waterway Exp. Sta. Bulletin 36.
- Irvine, D.J., et al., 2012. Heterogeneous or homogeneous? Implications of simplifying heterogeneous streambeds in models of losing streams. Journal of Hydrology, 424–425, 16–23. doi:10.1016/j.jhydrol.2011.11.051
- Kalbus, E., Reinstorf, F., and Schirmer, M., 2006. Measuring methods for groundwater - surface water interactions: a review. Hydrology and Earth System Sciences, 10, 873–887. doi:10.5194/hess-10-873-2006
- Kármán, K., et al. 2014. Transit time determination for a riverbank filtration system using oxygen isotope data and the lumped-parameter model. Hydrological Sciences Journal, 59 (6), 1109–1116. doi:10.1080/02626667.2013.808345
- Kedziorek, M.A.M., Geoffriau, S., and Bourg, A.C.M., 2008. Organic matter and modeling redox reactions during river bank filtration in an alluvial aquifer of the Lot River, France. Environmental Science & Technology, 42, 2793–2798. doi:10.1021/es702411t
- Kinzelbach, W., et al., 2003. Sustainable groundwater management - problems and scientific tools. Episodes, 26 (4), 279–284.
- Koh, D.C., et al., 2012. Flow paths and mixing properties of groundwater using hydrogeochemistry and environmental tracers in the southwestern area of Jeju volcanic island. Journal of Hydrology, 432–433, 61–74. doi:10.1016/j.jhydrol.2012.02.030
- Lee, E., et al., 2012. Hydraulic analysis of a radial collector well for riverbank filtration near Nakdong River, South Korea. Hydrogeology Journal, 20, 575–589. doi:10.1007/s10040-011-0821-3
- Martinez, J.L., Raiber, M., and Cendón, D.I., 2017. Using 3D geological modelling and geochemical mixing models to characterise alluvial aquifer recharge sources in the upper Condamine River catchment, Queensland, Australia. Science of the Total Environment, 574, 1–18. doi:10.1016/j.scitotenv.2016.09.029
- Massmann, G., et al., 2008a. Seasonal and spatial distribution of redox zones during lake bank filtration in Berlin, Germany. Environmental Geology, 54, 53–65. doi:10.1007/s00254-007-0792-9
- Massmann, G., et al., 2008b. Investigation of groundwater residence times during bank filtration in Berlin: a multi-tracer approach. Hydrological Processes, 22, 788–801. doi:10.1002/hyp.6649
- Partington, D., et al., 2013. Interpreting streamflow generation mechanisms from integrated surface-subsurface flow models of a riparian wetland and catchment. Water Resources Research, 49, 5501–5519. doi:10.1002/wrcr.20405
- Polomčić, D., et al., 2013. Groundwater management by riverbank filtration and an infiltration channel: the case of Obrenovac, Serbia. Hydrogeology Journal, 21, 1519–1530. doi:10.1007/s10040-013-1025-9
- Postma, D., et al., 2017. Fate of arsenic during Red River water infiltration into aquifers beneath Hanoi, Vietnam. Environmental Science & Technology, 51, 838–845. doi:10.1021/acs.est.6b05065
- Qin, D., et al., 2012. Determination of groundwater recharge regime and flowpath in the Lower Heihe River basin in an arid area of Northwest China by using environmental tracers: implications for vegetation degradation in the Ejina Oasis. Applied Geochemistry, 27, 1133–1145. doi:10.1016/j.apgeochem.2012.02.031
- Qin, Y., et al., 2015. Contamination characteristics and ecological risk assessment of typical antibiotics in surface water of the Daliao River, China. Research of Environmental Sciences, 28 (3), 361–368. in Chinese.
- Refsgaard, J.C., et al., 2012. Review of strategies for handling geological uncertainty in groundwater flow and transport modeling. Advances in Water Resources, 36, 36–50. doi:10.1016/j.advwatres.2011.04.006
- Rodgers, P., et al., 2004. Groundwater–surface-water interactions in a braided river: a tracer-based assessment. Hydrological Processes, 18, 1315–1332. doi:10.1002/hyp.1404
- Selle, B., Rink, K., and Kolditz, O., 2013. Recharge and discharge controls on groundwater travel times and flow paths to production wells for the Ammer catchment in southwestern Germany. Environmental Earth Sciences, 69, 443–452. doi:10.1007/s12665-013-2333-z
- Shand, P., et al., 2007. 87Sr/86Sr as an indicator of flowpaths and weathering rates in the Plynlimon experimental catchments, Wales, U.K. Chemical Geology, 236, 247–265. doi:10.1016/j.chemgeo.2006.09.012
- Song, J., et al., 2009. Feasibility of grain-size analysis methods for determination of vertical hydraulic conductivity of streambeds. Journal of Hydrology, 375, 428–437. doi:10.1016/j.jhydrol.2009.06.043
- Sophocleous, M., 2002. Interactions between groundwater and surface water: the state of the science. Hydrogeology Journal, 10, 52–67. doi:10.1007/s10040-001-0170-8
- Soulsby, C., et al., 2011. Catchment-scale estimates of flow path partitioning and water storage based on transit time and runoff modelling. Hydrological Processes, 25, 3960–3976. doi:10.1002/hyp.8324
- Storteboom, H., et al., 2010. Identification of antibiotic-resistance-gene molecular signatures suitable as tracers of pristine river, urban, and agricultural sources. Environmental Science & Technology, 44, 1947–1953. doi:10.1021/es902893f
- Su, X., Xu, W., and Du, S., 2014. In situ infiltration test using a reclaimed abandoned river bed: managed aquifer recharge in Shijiazhuang City, China. Environmental Earth Sciences, 71 (12), 5017–5025. doi:10.1007/s12665-013-2893-y
- Touhei, T., 2011. A fast volume integral equation method for elastic wave propagation in a half space. International Journal of Solids and Structures, 48, 3194–3208. doi:10.1016/j.ijsolstr.2011.07.013
- Tufenkji, N., Ryan, J.N., and Elimelech, M., 2002. Peer Reviewed: the Promise of Bank Filtration. Environmental Science & Technology, 36 (21), 422A–428A. doi:10.1021/es022441j
- Weltje, G.J., 1997. End-member modeling of compositional data: numerical-statistical algorithms for solving the explicit mixing problem. Mathematical Geology, 29 (4), 503–549. doi:10.1007/BF02775085
- Xie, X., et al., 2013. Delineation of groundwater flow paths using hydrochemical and strontium isotope composition: A case study in high arsenic aquifer systems of the Datong basin, northern China. Journal of Hydrology, 476, 87–96. doi:10.1016/j.jhydrol.2012.10.016
- Yang, C., et al. 2012. Analysis of pollution levels of 16 antibiotics in the river water of Daliao River water system. Chinese Journal of Chromatography, 30 (8), 756–762. in Chinese. doi:10.3724/SP.J.1123.2012.03059
- Yang, Z., et al., 2014. A multi-method approach to quantify groundwater/surface water-interactions in the semi-arid Hailiutu River basin, northwest China. Hydrogeology Journal, 22, 527–541. doi:10.1007/s10040-013-1091-z
- Zhang, L., 2015. Study on pore water hydrogeochemistry evolution of riverbed sedimentation zone under condition of riverbank filtration: an example in Shenyang Huangjia Water Source. Changchun: Jilin University. in Chinese.