
ABSTRACT
This paper describes the development of the first operational seasonal hydrological forecasting service for the UK, the Hydrological Outlook UK (HOUK). Since June 2013, this service has delivered monthly forecasts of streamflow and groundwater levels, with an emphasis on forecasting hydrological conditions over the next three months, accompanied by outlooks over longer time horizons. This system is based on three complementary approaches combined to produce the outlooks: (i) national-scale modelling of streamflow and groundwater levels based on dynamic seasonal rainfall forecasts, (ii) catchment-scale modelling where streamflow and groundwater level models are driven by historical meteorological forcings (i.e. the Ensemble Streamflow Prediction, ESP, approach), and (iii) a catchment-scale statistical method based on persistence and historical analogues. This paper provides the background to the Hydrological Outlook, describes the various component methods in detail and then considers the impact and usefulness of the product. As an example of a multi-method, operational seasonal hydrological forecasting system, it is hoped that this overview provides useful information and context for other forecasting initiatives around the world.
Editor A. CastellarinAssociate editor A. Viglione
1 Introduction
Forecasting of future weather, streamflow and groundwater levels at long lead times (i.e. monthly to seasonal) has great potential for improving the management of water resources, including water supply and irrigation management (Chiew et al. Citation2003), reservoir management (Anghileri et al. Citation2016), hydropower production (Hamlet et al. Citation2002) and flood awareness (White et al. Citation2015). Future hydrological conditions are highly dependent on current hydrological status and future precipitation. At the global scale, future precipitation is influenced by long-lasting dynamic atmosphere–ocean interactions such as the El Niño South Oscillation in the tropical Pacific (Hoskins Citation2013), and the North Atlantic Oscillation (Scaife et al. Citation2014). In the UK, rainfall variability shows complex relationships with large-scale synoptic patterns (Murphy and Washington Citation2001, Lavers et al. Citation2013) and accurate rainfall forecasts at seasonal time scales have proved difficult to achieve (Weisheimer and Palmer Citation2014). As a result, seasonal hydrological forecasting in the UK has received relatively limited scientific attention to date, with studies focusing on specific catchments and seasons (e.g. Svensson and Prudhomme Citation2005, Wedgbrow et al. Citation2005, Easey et al. Citation2006) and only very few applications at the national scale (e.g. Bell et al. Citation2013). This is in contrast with countries and regions that, arguably, benefit from greater weather and hydrological predictability, and as a consequence have existing seasonal streamflow services, for example the USA (Demargne et al. Citation2014) and Australia, (Schepen and Wang Citation2015), or experimental forecasting systems, for example for Sub-Saharan Africa (Sheffield et al. Citation2014).
This paper describes the development of the first operational seasonal hydrological forecasting service for the UK, known as the Hydrological Outlook UK (HOUK). This service now delivers a monthly forecast of streamflow and groundwater levels that focuses on the next 3 months, although it also produces outlooks over longer time horizons. The project to deliver the HOUK requires the collaboration of seven research and operational organizations. These are: the four organizations charged with environmental regulation in the countries of the UK, i.e. the Environment Agency (EA), the Scottish Environment Protection Agency (SEPA), the Rivers Agency North Ireland (RANI) and Natural Resources Wales (NRW); the UK Met Office (MO); and two Natural Environment Research Council centres, the Centre for Ecology and Hydrology (CEH) and the British Geological Survey (BGS). These organizations have a long track record of cooperation, as demonstrated by the production of a monthly Hydrological Summary for the UK: a comprehensive assessment of the recent hydro-climatic conditions of the UK and analysis in a historical context, produced since 1988 (http://nrfa.ceh.ac.uk/monthly-hydrological-summary-uk).
The paper is organized as follows. Section 2 provides an overview of the development of the HOUK. The following sections give an overview of the HOUK system and its common datasets (Section 3), and describe the seasonal meteorological forecasts made available to the project (Section 4), the hydrological and hydrogeological methods, models and outputs (Sections 5–8), and the process adopted to synthesize a summary from all of the different elements (Section 9). The paper concludes with a brief commentary on the current use of the outlook (Section 10) and planned development.
2 Development history
The HOUK resulted from a concerted effort between the collaborating organizations to advance hydrological forecasting in the UK, which happened against the backdrop of a major hydrological episode, the protracted 2010–2012 drought (Kendon et al. Citation2013). In spring 2012, there had already been two dry winters, causing concern among the water supply industry and regulators, and in water-dependent sectors such as agriculture, particularly in the southeast of England where the situation in March 2012 was worse than at the equivalent time in the 1976 “drought of record”. The situation for the summer was a major concern (particularly given the occurrence of the Olympic Games in London), as was the prospect of a third dry winter. In the event, the drought broke with record April to July rainfall and the focus rapidly shifted to flooding, which continued until December (Parry et al. Citation2013). During this remarkable transformation from drought to flood, the demand from government, the public and the media for “what next” information underlined the importance of providing long-range hydrological forecasting capacity for the UK. The cooperation of these organizations during this period provided an impetus to develop the science in this area, building on existing research undertaken by the various agencies. Following a development phase, prototype hydrological forecasts were produced from January 2013, and the HOUK was launched publicly in the autumn of 2013. In parallel, the Environment Agency (in collaboration with CEH, BGS and MO) initiated routine forward-look ensemble projections within their existing Water Situation Report for England (https://www.gov.uk/government/collections/water-situation-reports-for-england) in March 2012. This collaborative, operational service has published monthly projections since October 2012, and was included within the HOUK at its launch.
3 Overview of the Hydrological Outlook system
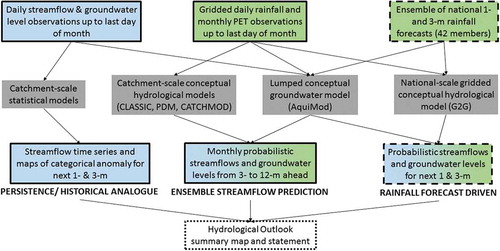
In a review of seasonal hydrological forecasting approaches, Doblas-Reyes et al. (Citation2013) drew a distinction between two complementary approaches for seasonal forecasting: process-based dynamical models and statistical–empirical methods. A third type of approach, outlined for example in a review by Yuan et al. (Citation2015b), encompasses streamflow forecasting using the predictability due to the memory of the terrestrial hydrological system, commonly known as Ensemble Streamflow Prediction (ESP). However, there is not yet one single accepted “best” seasonal hydrological forecasting method (Yuan et al. Citation2015b), despite several having proved useful in the international literature (Wilby Citation2001, Wedgbrow et al. Citation2005, Wood and Lettenmaier Citation2006, Ceron et al. Citation2010, Wang and Robertson Citation2011, Dutra et al. Citation2012, Yuan and Wood Citation2013, Yuan et al. Citation2015a). The HOUK is an operational system pioneering a multi-method seasonal hydrological forecasting approach, where three independent techniques are implemented and combined operationally to better capture uncertainty in the forecast ():
National-scale modelling based on rainfall seasonal forecasts for both streamflow and groundwater levels. This produces a probabilistic ensemble of average streamflow for the next 1 and 3 months, aggregated over 17 hydrometric regions of Great Britain (Section 5), and groundwater levels at the end of the following 1- and 3-month periods for 33 boreholes (Section 6).
Catchment-scale modelling in England and Wales where the models are driven by a historical meteorological forcings ensemble (i.e. ESP). This produces a monthly probabilistic ensemble of streamflow volume for the next 3 to 12 months for 29 river basins, and groundwater levels at the end of the next 3 to 12 months for six boreholes (Section 7).
A catchment-scale statistical method based on historical analogues and persistence, i.e. looking at historical time evolution of streamflow records to find the most likely patterns of future streamflow evolution for the next 1 and 3 months. It is applied to 93 catchments over the UK (Section 8).
Each method is run independently but relies on a common set of observational data, all updated monthly:
Daily gridded rainfall (P) and potential evapotranspiration (PET, based on MORECS (Met Office Rainfall and Evapo-transpiration Calculation System); Thompson et al. Citation1982), obtained from the National Climate Service at the Met Office. These data are aggregated in time and space as required by each model, and used to calculate the hydrological initial conditions (HIC) of the first day of the forecast.
Daily streamflow and groundwater levels time series for 93 rivers and 42 boreholes, obtained from the relevant measuring authorities through the National Hydrological Monitoring Programme (NHMP; Dixon et al. Citation2013). These data are used to bias correct the modelled groundwater initial levels and to drive the statistical method, and are also used to evaluate the performance of previous monthly Outlooks (Section 9).
Ensemble rainfall forecast (42 members) at the national scale for 1- and 3-month lead times, from the Met Office (Section 4). These data are used to drive the dynamical forecast approach after downscaling to the hydrological model scale.
Figure 1. Hydrological Outlook data, models and workflow. Blue shading represents streamflow and groundwater data, green shading represents climate data, bi-colour shading represents use of both groundwater and climate data. Solid line boxes indicate methods using observations alone, dashed boxes indicate use of dynamical seasonal forecasts. Grey boxes represent the model used. The final Hydrological Outlook UK is shown as a dotted box.
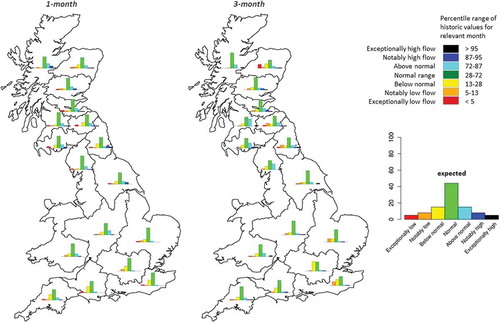
After their production, each forecast member is assigned to one of up to seven categories based on long-term historical estimates () to provide a probabilistic streamflow forecast. The categories were chosen for consistency with the Hydrological Summary produced by the NHMP and the Water Situation Report for England, and because of the operational needs of partnering organizations whose decisions are influenced by the signal associated with the tail of the streamflow distribution (extreme high or low flows), whenever this information is available. Because the system is not based on a large ensemble, results from the persistence and historical analogue methods are classified in three categories: high, normal and low. Note that, for simplification, maps from the ESP method show only five categories (see ).
Table 1. Categories and associated probabilities used to classify the Hydrological Outlook UK.
4 Rainfall and temperature seasonal forecasts based on Met Office Global Seasonal prediction system
The HOUK uses meteorological information from the Met Office long-range predictions of precipitation and temperature (http://www.metoffice.gov.uk/publicsector/contingency-planners). These are modified from the outputs of the Met Office Global Seasonal prediction system, version 5 (GloSea5; Maclachlan et al. Citation2015). Briefly, GloSea5 is a monthly to seasonal global ensemble prediction system using the Hadley Centre Global Environment Model version 3 (HadGEM3; Hewitt et al. Citation2011), a global coupled ocean–atmosphere–land–sea-ice model. In GloSea5, the model is initialized using atmospheric data from the Met Office’s operational numerical weather prediction analysis along with oceanic data from the Forecast Ocean Assimilation Model (FOAM; Blockley et al. Citation2014). The system has been shown to have skill in key climatic features relevant to UK hydrological assessment, such as the winter North Atlantic Oscillation (Scaife et al. Citation2014). Skill for UK mean rainfall is moderate overall, with correlations of about 0.25 for both monthly and seasonal timescales. As hinted at by the system’s ability to reproduce wintertime atmospheric circulation patterns, however, precipitation skill is greater in winter than in summer (Scaife et al. Citation2014, Svensson et al. Citation2015).
Two ensembles (total precipitation (P) and daily average 1.5-m air temperature (T)) of 42 equally probable members each are produced for the 1- and 3-month lead times, averaged over model UK land grid points to smooth the high level of noise, and bias corrected for time drift and errors in model variability. Around the 20th day of the current month, an expert committee is convened to consider all available evidence relevant to the long-range forecast for the UK. This includes monitoring of known global drivers of North Atlantic–European climate such as El Niño or the stratospheric polar vortex, and ensemble predictions from other leading global forecast centres (e.g. National Centre for Atmospheric Research, European Centre for Medium-range Weather Forecasts). The different sources of information and expert knowledge of the deficiencies in prediction systems are then used to suggest adjustments to the UK-mean P and T ensembles, with all changes and their motivation documented for future reference. The resulting expert-modified ensemble values of UK-mean P and T are sent to CEH and BGS before the end of the month for use in the HOUK.
5 A national-scale seasonal hydrological forecast based on rainfall forecasts
The national-scale seasonal hydrological forecast combines the long-range GloSea5 rainfall forecasts with the water-balance hydrological forecast approach developed by Bell et al. (Citation2013). A 1-km grid-based hydrological model (Grid-to-Grid or “G2G”; Bell et al. Citation2009) is driven with observed P and PET up to the day of the forecast to provide a nationwide, spatially variable estimate of the HIC. The G2G model states (saturated and unsaturated-zone storage and lateral routing stores) provide a detailed HIC that is used as input, along with rainfall forecast from GloSea5 and PET climatology, to a monthly water-balance model of storage (WBM) to estimate streamflow volumes on a 1-km grid resolution for the next 1 and 3 months (Bell et al. Citation2017). The simplicity of the monthly WBM and its reliance on the G2G initial condition (model states at the forecast time origin) removes the requirement for calibration (none has been undertaken for the national-scale HOUK), and an assessment of the WBM skill compared to G2G using observed rainfall data as input indicates that for 1-month ahead forecasts WBM simulates more than 80% of the variability in G2G flows, and more than 90% for 3-months ahead forecasts (Bell et al. Citation2017). The ensemble flow forecasts are categorized relative to the historical streamflow estimates from the WBM (1962–2010) ().
The P input to the WBM is derived from the national-scale (spatially uniform) 1- and 3-months ahead 42-member ensemble forecasts from GloSea5. It is converted to an ensemble of spatially uniform precipitation anomalies, a (mm), relative to GloSea5 estimates of climatological mean rainfall, and then spatially redistributed (downscaled) as monthly precipitation amount, P* (mm), using:
where and
are, respectively, the national and local (1-km pixel) observed monthly mean precipitation, in mm (1971–2000).
This approach to spatial downscaling using historical mean rainfall observations is similar to one used by Bell et al. (Citation2009) to downscale 25-km resolution regional climate model data to a 1-km resolution. Note that although this scheme can provide a long-term climatologically consistent national precipitation distribution, it is unable to provide an indication of regional precipitation extremes over the next 1 and 3 months.
Glosea5 can also provide an ensemble of national-scale temperature (T) forecasts in addition to precipitation. Although in theory these two variables could be used to estimate paired PET and rainfall forecasts, in practice each variable ensemble is adjusted independently, after which the formal pairing between P and T ensemble members is lost. Therefore, a historical mean PET estimate has been used instead, providing realistic estimates of water evaporated over the following months, which for most of the year will be considerably less than the precipitation. This adjustment process, together with the use of the Glosea5 anomaly only (Equation (1)) removes the requirement for bias correction of the rainfall ensemble.
The 42-member ensemble of hydrological forecasts is summarized in three ways, following the seven categories distribution of :
Set of five mean streamflow forecast maps based on rainfall quartiles (). This is similar to a box-and-whiskers summary plot of a distribution, illustrating streamflow associated with the median, the inter-quartile range (first to third quartiles) and the overall range (maximum and minimum) of the distribution of rainfall forecasts.
Regional histograms () of the distribution of streamflow forecasts.
Table of the probability (expressed as a percentage) of the mean regional flows falling into seven categories.
Figure 2. Regional streamflow forecasts for January 2017 to March 2017 for three quartiles and two members of the MO ensemble of rainfall forecasts. The observed flows could be more extreme than the flows generated by either the lowest or highest members of the rainfall ensemble. See for key details.
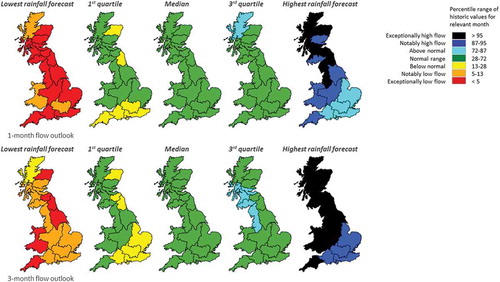
Figure 3. Regional histograms illustrating the full range of ensemble streamflow forecasts: January 2017 to March 2017.
The performance (skill) of the forecast, including its dependence on both HIC and P forecasts at different times of year, has been evaluated using GloSea5 hindcasts (Bell et al. Citation2017), with results broken down between geographical regions, seasons and lead times. Broadly, the hydrological forecasts and observed flows are in reasonable agreement, with the observed monthly mean streamflow usually falling within the ensemble forecast range. Forecast skill has also been assessed using both the whole rainfall ensemble and the ensemble mean forecast. For spring/summer months, the analysis showed little skill in the flow forecasts based on GloSea5 rainfall forecasts when large-scale rain-bearing low-pressure systems from the Atlantic are not very common, but autumn/winter flows were reasonably well forecast across Britain using ensemble mean rainfall forecasts, with mean correlations of 0.53 (significant at the 1% level) for 1-month ahead forecasts and 0.59 (significant at the 0.05% level) for 3-months ahead flow forecasts. By comparing forecast skill scores from different model configurations, the authors were able to attribute overall forecast skill to individual components of the modelling system, and found that most of the skill (64%) in the 1-month ahead seasonal flow forecasts could be attributed to the HIC, whereas for the 3-months ahead lead time, GloSea5 rainfall forecasts accounted for ~70% of the forecast skill.
6 Seasonal groundwater level forecasts based on rainfall forecasts
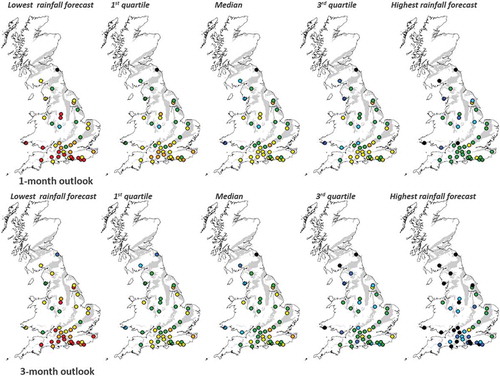
Seasonal groundwater level forecasts 1 and 3 months ahead are produced using the GloSea5 rainfall forecasts (Section 4) at 42 monitoring boreholes in the principal aquifers across Great Britain: Chalk, Jurassic and Magnesian limestone, Permo-Triassic sandstone, and limestone and sandstone aquifers within Devonian and Carboniferous sequences (). Groundwater levels are simulated using the AquiMod lumped conceptual model (Mackay et al. Citation2014), which has been shown to capture nonlinear groundwater level dynamics in a range of hydrogeological settings. Currently, 33 of the AquiMod Gmodels run on a monthly time step and nine on a daily time step, the selection of which has been made considering the degree of variability of the groundwater hydrograph and its responsiveness to rainfall, as determined through analyses of autocorrelation and cross-correlation against rainfall. The AquiMod models are calibrated using a Monte Carlo process, as described by Mackay et al. (Citation2014), within which model parameter values are sampled from user-defined ranges, and the fit to observed groundwater levels assessed using the Nash-Sutcliffe efficiency score (Nash and Sutcliffe Citation1970).
Figure 4. Groundwater level forecasts for end January and end March 2017 for the following five ensemble members: lowest, 1st quartile, median, 3rd quartile and highest. The observed levels could be more extreme than those generated by either the lowest or highest members of the rainfall ensemble.
For a given borehole, 1-month and 3-months ahead groundwater level forecasts are produced using the approach outlined by Mackay et al. (Citation2015). For each borehole, the model groundwater level condition is set to the latest observed level, and the models are run for a further 3 months to provide groundwater levels at the end of the period using the 42-member ensemble rainfall and temperature forecast from GloSea5. Prior to this, each rainfall forecast member is downscaled to the groundwater catchment using linear models defined by ordinary least squares regression between observed catchment and UK rainfall (Mackay et al. Citation2015). Forecast PET for each site is derived first nationally using the Blaney-Criddle method (Blaney and Criddle Citation1950) from the UK average temperature series, and then compared at the grid scale with MORECS. Finally, the equidistant quantile matching approach of Li et al. (Citation2010) is used to bias correct and downscale the Blaney-Criddle derived forecast UK-PET.
The 42-member ensemble of groundwater level forecasts are then assigned to one of seven categories () and maps of the median, the inter-quartile range (first to third quartiles) and the overall range (maximum and minimum) of the distribution of groundwater level forecast are produced (). (Mackay et al. Citation2015) showed the forecasts to be reliable at discriminating between below, near and above normal groundwater levels (based on historical terciles) 3 months into the future, consistently outperforming a reference persistence forecast. However, the origin of forecast skill, be it from the meteorological input, groundwater model or initial condition, is site-specific and related to the characteristic response of groundwater levels to rainfall and antecedent hydrological conditions.
7 Long-term mean streamflow and groundwater level forecasts based on historical climate
Probabilistic streamflow and groundwater level forecasts up to 12-months lead time are made following the ESP method (Day Citation1985), a hybrid approach based on conceptual hydrological modelling and historical climate data which does not rely on dynamic rainfall forecasts. Currently, the ESP method is implemented on 29 river basins and six observational boreholes in England and Wales. To deliver rapidly an operational system with as large a spatial coverage as possible, the modelling is shared between the EA, CEH and BGS, each contributing organization using their in-house catchment modelling system:
For smaller river basin catchments: (i) the Probability Distributed Model (PDM; Moore Citation2007), run by CEH, is a lumped rainfall–runoff model with three conceptual stores: a soil moisture store, and fast- and slow-flow stores. The model represents nonlinearity in the transformation from rainfall to runoff by using a probability distribution of soil moisture storage. Here, a simplified version of the full PDM is used (Kay et al. Citation2007); and (ii) Catchmod (Wilby et al. Citation1994), run by the EA, is a water balance model with three conceptual stores (soil moisture, linear and nonlinear stores, the latter producing baseflow) where the catchment is divided into a number of contributing zones defined by distinct land use, geological, hydrological or soil types. The flow generated by each zone is then aggregated to produce total runoff.
For larger river catchments: the semi-distributed model Climate and Land-use Scenario Simulation in Catchments (CLASSIC; run by CEH). CLASSIC has three main modules (soil moisture accounting, drainage and channel routing) and follows a semi-automatic calibration.
For groundwater levels at observation boreholes: the AquiMod groundwater model (Mackay et al. Citation2014), run by BGS, as used in the meteorological forecast approach (Section 6).
The parameterization of PDM and CLASSIC follows work by Crooks et al. (Citation2009) and that of AquiMod work by Mackay et al. (Citation2014). All three use the same set-up as implemented to derive the Future Flows Hydrology dataset (Prudhomme et al. Citation2013). Catchmod parameterizations are those used operationally by the Environment Agency.
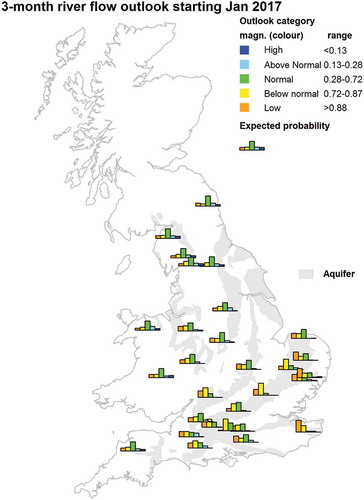
Following the estimation of the HIC, the conceptual models are run driven by paired sequences of daily observed and historically sampled P and PET time series to produce probabilistic forecasts of streamflow and groundwater levels over the next 1 to 12 months. The ensemble distribution is categorized following . Mean streamflow projections by the EA are sent by email to CEH within the first five working days of the month, and timeline plots of stacked forecasted cumulative distribution () and maps of bar plots of the forecasted distribution at given time horizon () are produced by CEH.
Figure 5. Seasonal mean streamflow outlook based on historical climate starting in January 2017. Stack diagrams of the empirical cumulative distribution for the River Avon at Bathford for forecast horizons from 1 to 12 months (x-axis). The height of each colour band for a given x-axis represents the proportion of the sample within a given flow category.
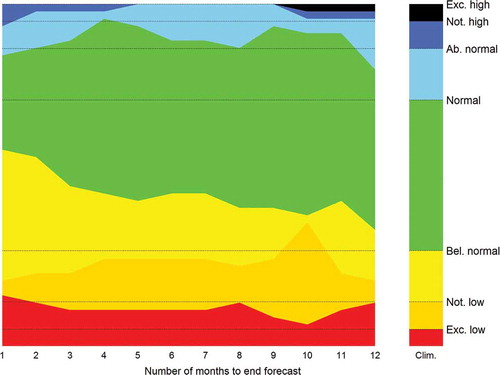
Figure 6. Bar plots of forecasted distribution at the river basin centroids. Note the bar plots only show five categories as described in .
The ESP method has been shown to be skilful in the UK, with average mean-squared-error skill scores across the year of 0.3, 0.17 and 0.11 for 1-, 3- and 6-month lead times, respectively (Harrigan et al. Citation2017), for a diverse sample of 314 catchments. Skill varies depending on forecast initialization month and is generally higher for seasonal forecasts initialized in wetter months than for dry. ESP is substantially more skilful for permeable catchments located mainly in the southeast, where skill scores of >0.6 for 6- and 12-month lead times are possible. It should be noted that, for consistency and efficiency, this skill assessment was undertaken using a single hydrological model (GR4J, which could be readily automated) not used operationally in HOUK; however, the same principles of application were applied to the hindcasts, so the conclusions are expected to be valid for HOUK.
8 Seasonal streamflow forecasts based on persistence and historical analogy
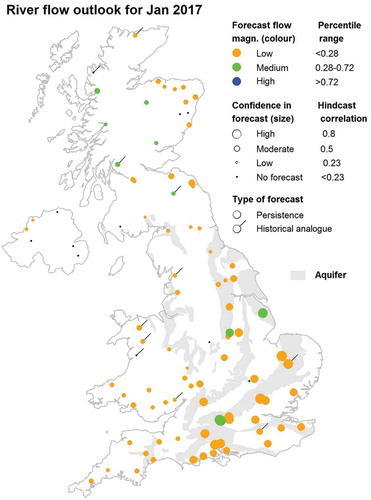
The forecasts of seasonal mean streamflow based on persistence and historical analogy are derived using statistical methods, relying solely on past streamflow observations rather than any meteorological inputs (Svensson Citation2016). Forecasts are made for the coming 1 and 3 months, individually for each of 93 catchments located throughout the United Kingdom, including Northern Ireland. The persistence forecast ( and ) is based on the assumption that the streamflow anomaly (streamflow standardized to have mean = 0 and standard deviation = 1) observed in the most recent month will continue unchanged into the coming 1 or 3 months. As the anomaly rather than the absolute streamflow is used, seasonal variations in mean and variance can be taken into account. This is important as UK streamflows often show a marked seasonal peak in winter, when variability also tends to be the largest. The historical analogues approach finds the historical streamflow anomaly sequences the most similar to the recent past (), based on the smallest root-mean-square error (RMSE). For the 1(3)-month forecast, the five most similar 6(9)-month long analogues from the past record are used, making sure that the selected analogues map exactly to the same season as the recent past. The forecast consists of a weighted mean, or a shifted weighted mean, of the five flow-anomaly sequences in the month(s) following the selected historical analogues (Svensson Citation2016). For each catchment, month and forecast duration, the most skilful method (persistence or analogy, based on correlation between hindcasts and observations for the available observed record) is selected to provide the final forecast as time series for selected catchments () and maps of categorical forecasts (). Typically, persistence forecasts work best in the permeable catchments in the southeast of England, whereas all the methods tend to perform less well in the northwest of the UK. Forecasts with significant (at the 5% level, one-sided test) correlations exceeding 0.23 can be made for 81% (70%) of station–month combinations for the 1(3)-month forecast. The bulk of these are persistence forecasts. The highest correlation is 0.98 (0.96) for the 1(3)-month forecast.
Figure 7. Time series plot for January 2017 streamflow forecast for the River Thames at Kingston showing the persistence forecast (here final forecast, red dashed line) and the five most similar historical analogues (solid thin black lines). The normal range covers the middle 44% of the empirical distribution of streamflow (see ).
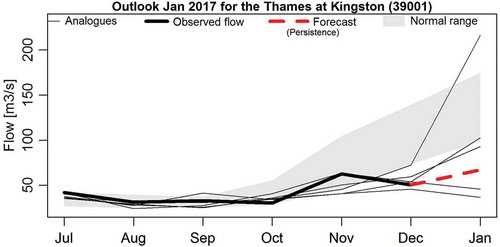
Figure 8. Categorical streamflow volume forecasts for January 2017, based on persistence and historical analogy, and associated confidence levels. Note that only three categories are used, with the notably and exceptionally wet (dry) and above (below) normal being merged into a single blue/high (orange/low) category, respectively. See key for details.
9 Forecasters’ meeting, presentation and publication of the HOUK
Once the results have been produced for the different methods, the project team meets around the eighth working day of the month for an expert committee meeting known as the “Forecasters’ Meeting” and comparable with the process adopted with the meteorological forecasts described in Section 4. The aim of the forecasters’ meeting is to agree on high-level messages emerging from the various methods’ results which are subsequently presented as a short (single-page) PDF report in a pre-formatted template, which is aimed at a wide audience. The forecasters’ meeting is normally held in the second week of the month, with the aim of publishing the outlook by the tenth day of the month. This time delay is required to accommodate the data take-on and modelling processes, and it is hoped (see Section 11) that the publication date will be brought forward in future.
The author of the HOUK gives a presentation at the meeting that summarizes previous monthly performance, the latest observations and the outputs of the different methods. This ensures that the author’s interpretation of the results can be efficiently evaluated and discussed amongst contributors. The HOUK of the previous month is compared with latest observational reports from the collaborating measuring agencies for a qualitative assessment of the last forecast performance. Seasonal climate, streamflow and groundwater forecasts (Sections 4–8) are then compared and discussed, taking into consideration the attributes of each methodology, i.e. some appraisal of the skill and limitations of each method at the given time of year. Currently, this is done qualitatively and reflects gross features of model performance (e.g. taking into account the lower skill in meteorological forecasts in summer; being aware of regional variations in the skill of the persistence/analogue forecasts) rather than using quantitative measures or through any statistical weighting of the methods, but this remains an important avenue for future work. Other relevant, and independent, sources of information are also consulted at the meeting, including the Flood Forecasting Centre (http://www.ffc-environment-agency.metoffice.gov.uk/) statement, spatial rainfall totals for the month to date (reflecting the fact that the meeting is normally held at least a week into the month; http://www.metoffice.gov.uk/hadobs/hadukp/charts/hadukp_daily_plots.html) and any other information available from partner organizations. This results in a set of key messages to be incorporated in the summary page, which consists principally of:
a summary paragraph with the key messages in relation to outlooks for rainfall, streamflow and groundwater over the 1- and 3-month timeframes;
a rainfall paragraph with the Met Office statement associated with the seasonal precipitation forecast (http://www.metoffice.gov.uk/publicsector/contingency-planners);
a streamflow paragraph beginning with a brief overview of streamflow in the previous month, followed by a more detailed account of spatial variations in projections over the next 1 and 3 months; and
a groundwater paragraph, which follows the same structure.
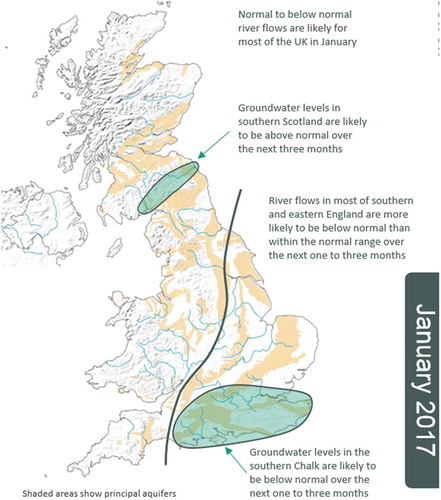
A highlights map (e.g. ) is also composed to provide a broad indication of the spatial extent of specific features (but not definite geographical limits), accompanied by annotated text as required. Because integrated multi-model skill assessment of the HOUK has yet to be completed, the outlooks describe the main headlines of the hydrological forecast as a narrative; but interested users also have access to more detailed results associated with each of the methods in the form of maps, graphs and tables.
Figure 9. Example of a Hydrological Outlook UK summary map.
The summary page is circulated by email for comment and sign-off by all project partners, with all other material made available on a web-based file sharing system. Any proposed changes are considered before finalizing the HOUK. The summary page and accompanying supplementary information are published by the tenth working day of the month.
All dissemination is via the project’s website (www.hydoutuk.net/). The summary is reproduced as a web page and also available as a PDF; the model outputs are available as “Further Information” (PDF). The website also contains an archive of Hydrological Outlooks since June 2013, and documentation giving background information about the methods and how to interpret the model outputs. Users can register on the website to receive notification when a new monthly HOUK is published.
A final item for the forecasters’ meeting is to review the accuracy of the summary of the previous month’s Hydrological Outlook. The skill behind the individual methods is to some extent understood and is being further investigated. As noted above, the summary page, however, requires expert judgement to synthesize the different model results. The “skill” of the summary is more challenging to assess, given that the product combines narrative information and a visual “highlights” map that deliberately seeks to generalize the diverse and complex statistical and ensemble model-based outputs that are behind the outlook. To date this has largely been a qualitative month-by-month review; however, a quantitative analysis of the performance is underway for the 2-year period from September 2015 to August 2016. This assessment has only been undertaken for river flows and a 1-month ahead forecast. Initial results reveal that the overall accuracy is about 70% but that there is particular difficulty in predicting above-normal flows in the summer.
10 Usefulness of the Hydrological Outlook UK
The usefulness of HOUK has been assessed from automated web statistics derived from visits to HOUK pages. These statistics indicate that there are about 300 readers of each month’s forecast, and of these slightly less than a third have registered to receive email notification of each month’s publication. To provide some sort of context for this readership, the British Hydrological Society (BHS), a national learned society embracing all aspects of hydrology founded in 1983, has a very stable membership of around 1000 individuals; while its membership clearly does not reflect the entire UK hydrological community, it provides a first approximation, and on that basis a readership of 300 represents a substantial proportion.
The HOUK has been produced operationally for less than four years, so is still a comparatively new product, which has arguably not had sufficient time to fully demonstrate its potential. Furthermore, it can be expected that interest in the HOUK will increase as conditions depart from normal. Generally speaking, from the launch of the HOUK in 2013, normal conditions prevailed until late 2016, and departures from normal were localized and short lived, and primarily reflected high flow rather than drought conditions. One example of this came in the winter of 2015/16 when a series of storms passed across northern England, bringing the most severe flooding in many decades (Barker et al. Citation2016); during this period visits to the site doubled. This no doubt reflected a demand for any information about possible future hydrological conditions, because in practice the HOUK does not provide flood forecasting, beyond indicating when saturated conditions might continue and further heavy rainfall may cause flooding. Nevertheless, the HOUK could potentially be useful in providing advanced warning of sustained periods of wetness and associated high flows and groundwater levels, which may help inform flood preparedness, e.g. entering the autumn/winter flood season. Major flood events such as 2015/16, and the previous winter floods of 2013/14 (Muchan et al. Citation2015), did prompt interest in using some components of the HOUK – in particular, the G2G Water Balance model component, which was used to indicate a “susceptibility to further rainfall” map. In 2013/14 this was consulted, alongside groundwater level forecasts, by government emergency planners, to determine how long the winter flooding was likely to be sustained. In 2015/16, the same method was consulted again by emergency planners, and as a result became embedded in a separate monthly flood outlook product produced by the Flood Forecasting Centre.
Given the larger spatial scale and slower evolution of droughts, the HOUK is expected to be of more interest for water resources assessment, and early warning of drought/low flows rather than the high-flow end of the spectrum. While there have been some short dry periods (e.g. early summer 2013), the UK has not seen sustained drought conditions since early 2012 when the nascent HOUK was being developed. However, at the time of writing (winter 2016/17 through to early summer 2017) there was an extended period of below average rainfall causing lower than normal flows. This has caused some speculation about the consequences for water resources should this pattern continue, and there has been anecdotal evidence of the HOUK being used to help inform planning and decision making as part of the wide range of evidence consulted by water resource managers in the UK. It is perhaps regrettably the case that an extended period of abnormal hydrological conditions will be required for the HOUK to properly demonstrate its utility. Should drought conditions develop, the HOUK is likely to be more widely consulted. In addition to the routine forecasts produced each month, the HOUK methods can be used to make assessments of how long current dry conditions are likely to last, and how much rainfall is required to terminate the drought (see Bell et al. Citation2013). In both these cases, this information is very useful to stakeholders. The former question is of sufficient interest to the Environment Agency that the ESP aspects of the HOUK are now routinely embedded in EA water situation reports.
Finally, it is worth remembering that while the HOUK is intuitively more useful at the extremes, even forecasts of “normal” conditions represent valuable information. Stakeholder feedback has also been received which indicates that “normal” forecasts are useful, as such forecasts can help in the scheduling of routine operational tasks, on the basis that such activities are less likely to be disrupted by extreme events.
The HOUK has been featured in national media outlets. In June 2014, Channel 4 News quoted the HOUK in an item about whether there could be a drought that summer (http://blogs.channel4.com/liam-dutton-on-weather/drought-year/6739). In January 2016 The Sunday Times referenced the HOUK in an article about the winter storms of 2015/16 mentioned above (http://www.thesundaytimes.co.uk/sto/news/uk_news/article1657026.ece). In spring 2017, a number of media articles referred to the Hydrological Outlook in their assessment of the water situation following the dry winter and spring, and potential for drought conditions in the summer (e.g. https://www.theguardian.com/uk-news/2017/may/09/uk-farmers-fear-for-crops-after-driest-april-on-record-in-the-uk).
11 Conclusion and further steps
This paper has described the motivation and the production of the Hydrological Outlook UK, which is freely available and has a regular monthly audience of several hundred located in the UK and beyond. Its emergence was possible thanks to an existing partnership of UK hydro-meteorology organizations with long experience of effective operational collaboration, such as with the Hydrological Summary for the UK. The capacity of each organization to re-use and adapt existing products and models was also instrumental in the rapid development of a prototype product, which has subsequently been improved by bespoke research and development.
The HOUK system is pioneering a multi-method approach to hydrological seasonal forecasting to better capture uncertainty and improve the robustness in the forecast compared with that relying on a single approach. However, one of its drawbacks is the difficulty of combining objectively the information derived from all three methods. Another difficulty, inherent to any operational system, is the day-to-day operational running of methods in parallel with scientific development and evaluation of new tools. While skill assessment of each of the methods has been undertaken (Svensson Citation2016, Mackay et al. Citation2015, Bell et al. Citation2017, Harrigan et al. 2017), there remains an ongoing need for research to fully understand the performance of the methods, and how this can be better incorporated into the final Hydrological Outlook product. Furthermore, work is underway aimed at evaluating the reliability of the summary page, in a multi-method skill assessment framework, and establishing how best to incorporate the knowledge gained during the skill evaluation into operational decision making. Specifically, improvements in the Hydrological Outlook UK are currently underway in four areas:
Operational system. This aims for publication as close as possible as the first working day of the month, through streamlined data transfers and faster data processing.
Scientific development. This includes (a) further quantification of reliability and skill of each method; (b) improvement of the spatial disaggregation of rainfall forecasts; (c) exploitation of GloSea5 large-scale teleconnection forecasts into the long-range ESP method; and (d) direct use of teleconnections for river flow forecasting in a statistical approach.
Impact. This aims to improve understanding and quantification of the accuracy of the summary headline message, and incorporation of skill metrics in the summary.
Outreach. Through regular stakeholder engagements, improvements in presentation and accessibility of the Hydrological Outlook to both specialist and non-specialist audiences are co-designed and tested.
Because of the scale of spatiotemporal development of floods (localized, developing over days and weeks) and droughts (regional, developing over months to seasons) in the UK compared with the scale of the HOUK (national over months), it is expected that HOUK will be most relevant to drought prediction and management. Work funded by the NERC project IMPETUS is expected to provide key research in understanding and improving current drought seasonal forecasting skill in the UK which could contribute to enhancing the Hydrological Outlook UK service, enabling it to offer timely, relevant and accurate advice to government and water managers during drought episodes.
Acknowledgements
The research and development described in this paper have only been possible because of the many pre-existing data services and modelling methodologies that have been made available by the project partners; the project gratefully acknowledges the substantial contribution that this represents. Christopher Jackson, Jonathan Mackay, Andrew McKenzie, John Bloomfield and Rob Ward publish with the permission of the Director, British Geological Survey. The views expressed in this paper are those of the authors and do not necessarily reflect those of the organizations that employ them.
Disclosure statement
No potential conflict of interest was reported by the authors.
Additional information
Funding
References
- Anghileri, D., et al., 2016. Value of long-term streamflow forecasts to reservoir operations for water supply in snow-dominated river catchments. Water Resources Research, 52, 4209–4225. doi:10.1002/2015WR017864
- Barker, L., et al., 2016. The winter 2015/2016 floods in the UK: a hydrological appraisal. Weather, 71, 324–333. doi:10.1002/wea.2016.71.issue-12
- Bell, V.A., et al., 2009. Use of soil data in a grid-based hydrological model to estimate spatial variation in changing flood risk across the UK. Journal of Hydrology, 377, 335–350. doi:10.1016/j.jhydrol.2009.08.031
- Bell, V.A., et al., 2013. Developing a large-scale water-balance approach to seasonal forecasting: application to the 2012 drought in britain. Hydrological Processes, 27, 3003–3012.
- Bell, V.A., et al., 2017. A national-scale seasonal hydrological forecast system: development and evaluation over britain. Hydrology and Earth System Sciences, 21, 4681–4691. doi:10.5194/hess-21-4681-2017.
- Blaney, H.F. and Criddle, W.D., 1950. Determining water requirements in irrigated areas from climatological and irrigation data. US Department of Agriculture Soil Conservation Service: Washington, DC, Technical paper N 96.
- Blockley, E.W., et al., 2014. Recent development of the met office operational ocean forecasting system: an overview and assessment of the new global foam forecasts. Geoscientific Model Development., 7, 2613–2638. doi:10.5194/gmd-7-2613-2014
- Ceron, J.P., et al., 2010. Hydrological seasonal forecast over france: feasibility and prospects. Atmospheric Science Letters, 11, 78–82. doi:10.1002/asl.256
- Chiew, F.H.S., Zhou, S.L., and Mcmahon, T.A., 2003. Use of seasonal streamflow forecasts in water resources management. Journal of Hydrology, 270, 135–144. doi:10.1016/S0022-1694(02)00292-5
- Crooks, S.M., Kay, A.L., and Reynard, N.S., 2009. Regionalised impacts of climate change on flood flows: hydrological models, catchments and calibration. R&D milestone report fd2020/mr1. Joint Defra/EA Flood and Coastal Erosion Risk Management R&D Programme. London: Defra.
- Day, G., 1985. Extended streamflow forecasting using nwsrfs. Journal of Water Resources Planning and Management, 111, 157–170. doi:10.1061/(ASCE)0733-9496(1985)111:2(157)
- Demargne, J., et al., 2014. The science of noaa’s operational hydrologic ensemble forecast service. Bulletin of the American Meteorological Society, 95, 79–98. doi:10.1175/BAMS-D-12-00081.1
- Dixon, H., Hannaford, J., and Fry, M.J., 2013. The effective management of national hydrometric data: experiences from the united kingdom. Hydrological Sciences Journal, 58, 1383–1399. doi:10.1080/02626667.2013.787486
- Doblas-Reyes, F.J., et al., 2013. Seasonal climate predictability and forecasting: status and prospects. Wiley Interdisciplinary Reviews: Climate Change, 4, 245–268.
- Dutra, E., et al., 2012. Seasonal forecasts of drought indices in african basins. Hydrology and Earth System Sciences Discussions, 9, 11093–11129. doi:10.5194/hessd-9-11093-2012
- Easey, J., Prudhomme, C., and Hannah, D.M., 2006. Seasonal forecasting of river flows: a review of the state-of-the-art. In: S. Demuth, et al., eds. Climate variability and change: hydrological impacts. Proceedings of the fifth FRIEND World Conference, Havana, Cuba, November, 158–162. Wallingford: IAHS Press (IAHS Publication No. 308).
- Hamlet, A.F., Huppert, D., and Lettenmaier, D.P., 2002. Economic value of long-lead streamflow forecasts for columbia river hydropower. Journal of Water Resources Planning and Management, 128, 91–101. doi:10.1061/(ASCE)0733-9496(2002)128:2(91)
- Harrigan, S., et al., 2017. Benchmarking ensemble streamflow prediction skill in the UK. Hydrology and Earth System Sciences Discussions. doi:10.5194/hess-2017-449
- Hewitt, H.T., et al., 2011. Design and implementation of the infrastructure of hadgem3: the next-generation met office climate modelling system. Geoscientific. Model Development., 4, 223–253. doi:10.5194/gmd-4-223-2011
- Hoskins, B., 2013. The potential for skill across the range of the seamless weather-climate prediction problem: a stimulus for our science. Quarterly Journal of the Royal Meteorological Society, 139, 573–584. doi:10.1002/qj.v139.672
- Kay, A.L., et al., 2007. An investigation of site-similarity approaches to generalisation of a rainfall–runoff model. Hydrology and Earth System Sciences, 11, 500–515. doi:10.5194/hess-11-500-2007
- Kendon, M., Marsh, T., and Parry, S., 2013. The 2010–2012 drought in england and wales. Weather, 68, 88–95. doi:10.1002/wea.2101
- Lavers, D., Prudhomme, C., and Hannah, D.M., 2013. European precipitation connections with large-scale mean sea-level pressure (mslp) fields. Hydrological Sciences Journal, 58, 310–327. doi:10.1080/02626667.2012.754545
- Li, H., Sheffield, J., and Wood, E.F., 2010. Bias correction of monthly precipitation and temperature fields from intergovernmental panel on climate change ar4 models using equidistant quantile matching. Journal of Geophysical Research Atmosphere, 115, D10101. doi:10.1029/2009JD012882
- Mackay, J.D., et al., 2015. Seasonal forecasting of groundwater levels in principal aquifers of the united kingdom. Journal of Hydrology, 530, 815–828. doi:10.1016/j.jhydrol.2015.10.018
- Mackay, J.D., Jackson, C.R., and Wang, L., 2014. A lumped conceptual model to simulate groundwater level time-series. Environmental Modelling & Software, 61, 229–245. doi:10.1016/j.envsoft.2014.06.003
- Maclachlan, C., et al., 2015. Global seasonal forecast system version 5 (glosea5): a high-resolution seasonal forecast system. Quarterly Journal of the Royal Meteorological Society, 141, 1072–1084. doi:10.1002/qj.2396
- Moore, R.J., 2007. The pdm rainfall-runoff model. Hydrology and Earth System Sciences, 11, 483–499. doi:10.5194/hess-11-483-2007
- Muchan, K., et al., 2015. The winter storms of 2013/2014 in the UK: hydrological responses and impacts. Weather, 70, 55–61. doi:10.1002/wea.2469
- Murphy, S.J. and Washington, R., 2001. United kingdom and ireland precipitation variability and the north atlantic sea-level pressure field. International Journal of Climatology, 21, 939–959. doi:10.1002/(ISSN)1097-0088
- Nash, J.E. and Sutcliffe, J.V., 1970. River flow forecasting through conceptual models part i – a discussion of principles. Journal of Hydrology, 10, 282–290. doi:10.1016/0022-1694(70)90255-6
- Parry, S., Marsh, T., and Kendon, M., 2013. 2012: from drought to floods in england and wales. Weather, 68, 268–274. doi:10.1002/wea.2013.68.issue-10
- Prudhomme, C., et al., 2013. Future flows hydrology: an ensemble of daily river flow and monthly groundwater levels for use for climate change impact assessment across great britain. Earth System Sciences Data, 5, 101–107. doi:10.5194/essd-5-101-2013
- Scaife, A.A., et al., 2014. Skillful long-range prediction of european and north american winters. Geophysical Research Letters, 41, 2014GL059637. doi:10.1002/2014GL059637
- Schepen, A. and Wang, Q.J., 2015. Model averaging methods to merge operational statistical and dynamic seasonal streamflow forecasts in australia. Water Resources Research, 51, 1797–1812. doi:10.1002/2014WR016163
- Sheffield, J., et al., 2014. A drought monitoring system for sub-Sahara African water resources and food security. Bulletin of the American Meteorological Society. doi:10.1175/BAMS-D-12-00124.1
- Svensson, C., 2016. Seasonal river flow forecasts for the united kingdom using persistence and historical analogues. Hydrological Sciences Journal, 61, 19–35. doi:10.1080/02626667.2014.992788
- Svensson, C., et al., 2015. Long-range forecasts of UK winter hydrology. Environmental Research Letters, 10, 064006. doi:10.1088/1748-9326/10/6/064006
- Svensson, C. and Prudhomme, C., 2005. Prediction of british summer river flows using winter predictors. Theoretical and Applied Climatology, 82, 1–15. doi:10.1007/s00704-005-0124-5
- Thompson, N., Barrie, I.A., and Ayles, M., 1982. The meteorological office rainfall and evaporation calculation system: morecs (july 1981). Bracknell, UK: Met. Office, Hydrological Memorandum N 45.
- Wang, Q.J. and Robertson, D.E., 2011. Multisite probabilistic forecasting of seasonal flows for streams with zero value occurrences. Water Resources Research, 47, W02546. doi:10.1029/2010WR009333
- Wedgbrow, C.S., Wilby, R.L., and Fox, H.R., 2005. Experimental seasonal forecasts of low summer flows in the river thames, UK, using expert systems. Climate Research, 28, 133–141. doi:10.3354/cr028133
- Weisheimer, A. and Palmer, T.N., 2014. On the reliability of seasonal climate forecasts. Journal of the Royal Society Interface, 11. doi:10.1098/rsif.2013.1162
- White, C.J., Franks, S.W., and Mcevoy, D., 2015. Using subseasonal-to-seasonal (s2s) extreme rainfall forecasts for extended-range flood prediction in australia. Proceedings of the International Association of Hydrological Sciences, 370, 229–234. doi:10.5194/piahs-370-229-2015
- Wilby, R., Greenfield, B., and Glenny, C., 1994. A coupled synoptic-hydrological model for climate change impact assessment. Journal of Hydrology, 153, 265–290. doi:10.1016/0022-1694(94)90195-3
- Wilby, R.L., 2001. Seasonal forecasting of river flows in the british isles using north atlantic pressure patterns. Journal of the Chartered Institution of Water and Environmental Management, 15, 56–63. doi:10.1111/j.1747-6593.2001.tb00305.x
- Wood, A.W. and Lettenmaier, D.P., 2006. A test bed for new seasonal hydrological forecasting approaches in the western united states. Bulletin of the American Meteorological Society, 87, 1699–1712. doi:10.1175/BAMS-87-12-1699
- Yuan, X., et al., 2015a. Seasonal forecasting of global hydrologic extremes: system development and evaluation over gewex basins. Bulletin of the American Meteorological Society. doi:10.1175/BAMS-D-14-00003.1
- Yuan, X. and Wood, E.F., 2013. Multimodel seasonal forecasting of global drought onset. Geophysical Research Letters, 40, 4900–4905. doi:10.1002/grl.50949
- Yuan, X., Wood, E.F., and Ma, Z., 2015b. A review on climate-model-based seasonal hydrologic forecasting: physical understanding and system development. Wiley Interdisciplinary Reviews: Water, 2, 523–536. doi:10.1002/wat2.2015.2.issue-5