
ABSTRACT
The standardized precipitation index (SPI) and standardized streamflow index (SSI) were used to analyse dry/wet conditions in the Logone catchment over a 50-year period (1951–2000). The SPI analysis at different time scales showed several meteorological drought events ranging from moderate to extreme; and SSI analysis showed that wetter conditions prevailed in the catchment from 1950 to 1970 interspersed with a few hydrological drought events. Overall, the results indicate that both the Sudano and Sahelian zones are equally prone to droughts and floods. However, the Sudano zone is more sensitive to drier conditions, while the Sahelian zone is sensitive to wetter conditions. Correlation analysis between SPI and SSI at multiple time scales revealed that the catchment has a low response to rainfall at short time scales, though this progressively changed as the time scale increased, with strong correlations (≥0.70) observed after 12 months. Analysis using individual monthly series showed that the response time reduced to 3 months in October.
Editor R. Woods Associate editor I. Overton
1 Introduction
Large-scale droughts are complex environmental phenomena with significant effects on agriculture, society and ecosystems. Generally, drought can be defined as a period of deficient rainfall over a long period of time, and can be grouped into four main categories (meteorological, agricultural, hydrological and socio-economic) (Wilhite and Glantz Citation1985). In semi-arid areas in developing countries, such as the Sudano-Sahel region of Africa, rainfall plays a crucial role in the socio-economic well-being of the population because they depend on it for livelihood activities, especially agriculture which is mostly rainfed. However, in recent decades, food security in the region has been threatened following drought and rainfall variability (Gautam Citation2006, Traore and Owiyo Citation2013). In this region, drought can result in the loss of assets in the form of crops, livestock and other productive capital as a result of low rainfall (meteorological droughts), which after extended periods can result in water shortages (hydrological droughts).
Despite a history of droughts, recent studies have indicated a gradual increase in rainfall in the region (Odekunle et al. Citation2008, Nkiaka et al. Citation2017), but less attention has been given to extreme rainfall events compared to droughts, probably because little information exists about floods and other damaging rainfall events in the Sudano-Sahel (Tschakert et al. Citation2010). The socio-economic impact of weather extremes, and predictions that extremes will become more frequent (Field et al. Citation2014), requires a change in paradigm so that equal attention is given to both droughts and floods in this region.
The standardized precipitation index (SPI) (Mckee et al. Citation1993) is a probability-based indicator that shows the degree to which accumulative precipitation for a specific period departs from the average state. This index is generally used to detect, monitor and assess dry and wet conditions, and identify their variability at different spatial and temporal scales. Compared to other methods for calculating drought conditions, e.g. the Palmer drought severity index (PDSI), the standardized precipitation evapotranspiration index (SPEI), the surface water supply index (SWSI) and the standardized anomaly index (SAI), the SPI offers many advantages: (a) only a single input variable (precipitation) is necessary; (b) it provides a means of analysing both wet and dry periods; (c) it can be calculated for different time scales; (d) it can allow the user to classify droughts into different categories; and (e) it is probability based and hence can be used in risk management and decision analysis. Due to its robustness and convenience, the SPI has been widely used to study droughts around the world (Roudier and Mahe Citation2010, Du et al. Citation2013, Barker Citation2016). It has also been used extensively to monitor wet conditions (Seiler et al. Citation2002, Guerreiro et al. Citation2008), and to analyse both dry and wet conditions (Machado et al. Citation2011, Du et al. Citation2013, Ionita et al. Citation2015). Furthermore, the World Meteorological Organization (WMO Citation2012) recommends the use of the SPI to assess and monitor drought conditions and identify wet periods.
Despite its wide application, the SPI has been subjected to criticism by several authors, e.g. Lloyd‐Hughes and Saunders (Citation2002). They argued that the use of the SPI for short time scale analysis (1-, 2-, 3-month) within regions characterized by low seasonal precipitation may result in overestimation or underestimation of the positive or negative SPI values. Golian et al. (Citation2015) argued that using only a single index to monitor droughts may be misleading due to the complex nature of drought phenomena in both their causation and impact. As a result of these criticisms, the multivariate standardized drought index (MSDI) (Hao and Aghakouchak Citation2013) was developed. Despite these advances, application of the SPI remains popular even though it requires a minimum of 30 years of monthly rainfall data, which may limit its application in data-scarce regions, and it has been applied in many studies across the world (Seiler et al. Citation2002, Guerreiro et al. Citation2008, Roudier and Mahe Citation2010, Machado et al. Citation2011, Cheo et al. Citation2013, Louvet et al. Citation2016).
Despite wide application of the SPI, the lack of understanding on how meteorological droughts are propagated to hydrological droughts is still a major obstacle to the development of a drought-focused monitoring and early warning system (Barker Citation2016). However, Vicente-Serrano et al. (Citation2011) developed and tested the standardized streamflow index (SSI), which can be used to obtain a hydrological drought index that is useful for making spatial and temporal comparisons over a wide variety of river regimes and flow characteristics. Many studies gaining insight on how meteorological droughts are propagated to hydrological droughts using SPI and SSI have been published (Du et al. Citation2013, López-Moreno et al. Citation2013, Zhang et al. Citation2015, Barker Citation2016). In Africa, although there are drought studies utilizing the SPI (Roudier and Mahe Citation2010, Cheo et al. Citation2013, Louvet et al. Citation2016), the use of both SPI and SSI techniques for monitoring dryness and wetness on the continent has not been reported.
Unlike the rest of the Sudano-Sahel region, studies on dry and wet conditions in the Lake Chad basin (LCB) are relatively few and largely undocumented. Insufficient research output from the basin may be attributed to limited raingauge stations in Central Africa and the steady decline in the number of existing hydro-meteorological facilities in the region (Washington et al. Citation2006). Despite this decline, a number of studies analysing dry and wet conditions in the LCB have been carried out. Okonkwo et al. (Citation2013) used the SPI to analyse monthly gridded rainfall and different satellite precipitation datasets for the period 2002–2011, and demonstrated that extreme wetness conditions prevailed in the basin in the year 2010; and Ndehedehe et al. (Citation2016) applied independent component analysis (ICA) to reveal the prevalence of wetness conditions in the LCB during the period 2012–2014 by analysing different satellite precipitation datasets.
However, previous studies were generalized for the whole LCB, covered a short time horizon and may have been misconstrued as insignificant in a particular location (i.e. at local or sub-catchment scale). The LCB covers an estimated area of 2.5 × 10⁶ km2 (with a population of about 30 million) and contains a range of ecological zones (hyper-arid, arid, semi-arid and Sudano) with a high spatiotemporal variability in rainfall. Therefore, generalizing results from such studies as representative of smaller basins may not be useful for effective and robust planning of water resources management and development of adaptation strategies in the event of droughts and floods.
Reducing the spatial scale of such analysis enables one to gain an insight into the likelihood of occurrence of extreme dry and wet conditions at sub-basin level and station locations. The Logone catchment was selected for this analysis for the following reasons: the catchment (a) covers two ecological zones (Sudano and semi-arid); (b) contributes a significant amount of inflow into Lake Chad; (c) is a transboundary catchment shared by three countries (Cameroon, Chad and Central African Republic); and (d) has extensive floodplains that contribute significantly to the livelihood of the local population.
The Logone catchment has experienced a series of floods in recent years with widespread socio-economic effects. However, even with the prevailing wetter climate, erratic rainfall means that water availability for agriculture, pastoral activities, ecosystem sustainability and inflow into Lake Chad is unpredictable. Yet there is limited detailed hydro-climatological documentation that can be used to enhance water resources management in the catchment. Analysing the characteristics of dry and wet conditions using long-term data is an important step for establishing an effective and comprehensive monitoring and early warning system in the catchment. Understanding the context-specific nature of the likelihood of dry/wet conditions will facilitate the identification of policy interventions to enhance adaptation, even in the context of climate change.
The main objectives of this study were to use the standardized precipitation index (SPI) to: (a) calculate the frequency of occurrence and spatial distribution of dry and wet conditions; (b) analyse their spatiotemporal characteristics; (c) analyse the SPI and SSI trends in the catchment using the Mann-Kendall test; and (d) use the two indicators to assess the relationship between rainfall and streamflow. This study is part of an on-going project aimed at understanding hydro-climatic variability in the Logone catchment that assesses vulnerability of the catchment to global climate change and the type of policy measures that can be put in place to improve water resources management and adaptation to climate change.
2 Study area and data
2.1 Study area
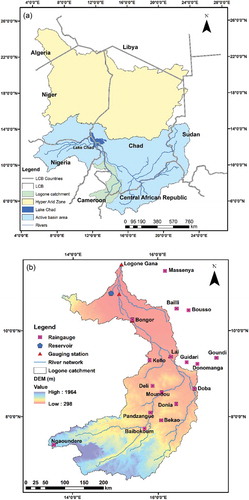
The Logone catchment is located in the southwestern part of the LCB. It covers an estimated area of 86 240 km2 at the Logone Gana hydrometric station and lies at latitude 6–12°N and longitude 13–17°E (), which is about 8% of the conventional LCB area of 1 053 455 km2 (Adenle Citation2001). The Logone is a major tributary of the Chari River, and the two rivers jointly contribute about 95% of the inflow into Lake Chad (Loth Citation2004). The Logone has its source in Cameroon, from the Mbere and Vina rivers originating from the Adamawa Plateau. In Lai, it is joined by the Pende River from Central African Republic and flows in a south–north direction. The altitude ranges from about 1200 m a.s.l. around the Adamawa Plateau in the south to 300 m a.s.l. in Ndjamena in the north. It flows through three countries, Cameroon, Central African Republic and Chad, with a flat topography (average slope of less than 1.3%). The catchment is located in a Sudano-Sahelian climatic regime controlled by the tropical continental regime air mass (the Harmattan) and the oceanic regime equatorial air mass (monsoon) (Nkiaka et al. Citation2017). It has a strong north–south rainfall gradient with a single rainy season between May and October, and an average annual rainfall varying between 500 mm/year in the north and about 1400 mm/year in the south. There is a strong spatiotemporal variability in rainfall (Nkiaka et al. Citation2017), and mean temperature in the catchment is 28°C (Loth Citation2004).
Figure 1. (a) Lake Chad basin showing the location of the Logone catchment, and (b) the Logone catchment showing the locations of raingauges. DEM: digital elevation model.
2.2 Data sources
Monthly rainfall and streamflow data were obtained from Système d’Informations Environnementales sur les Ressources en Eau et leur Modélisation (SIEREM) (Boyer et al. Citation2006). According to Boyer et al. (Citation2006), the SIEREM data were obtained using the POLLEN method adapted from the Object Modelling Technique. To increase the robustness of our results, only stations that had monthly data covering the period 1951–2000 were selected, with missing data points of not more than 10%. Given that only 11 raingauge stations located inside the catchment could fulfil these criteria, six additional raingauge stations located outside the catchment, but within its immediate surroundings, were selected to increase the number of raingauges. Stations 1–13 in lie in the Sudano ecological zone (5–10°N) and stations 14–17 are located in the Sahelian ecological zone (10–12°N). These ecological zones represent simplified climatic zones based on the Köppen-Geiger climate classification for Africa (Peel et al. Citation2007). Streamflow time series were available for the period 1955–2000. The data were quality controlled using different homogeneity tests and all the time series were found to be homogeneous (Nkiaka et al. Citation2017). Gaps in the time series were infilled using artificial neural network (ANN) and self-organizing maps (SOMs) techniques (Nkiaka et al. Citation2016).
Table 1. Overview of rainfall gauge stations and annual rainfall properties.
A limitation of the study is the absence of rainfall data after the year 2000, so the influence of recent rainfall measurements on SPI values could not be evaluated. However, for an insight into the recent characteristics of drought indices in the area covering the period 2002–2014, the reader is referred to Okonkwo et al. (Citation2013) and Ndehedehe et al. (Citation2016). A limitation of those studies is that only 10 years of satellite precipitation data were used in the SPI analysis. According to Mckee et al. (Citation1993), the application of the SPI for drought monitoring requires a minimum of 30 years of data. Another limitation of those studies is that satellite precipitation analysis depends on the quality of gauge data used for satellite calibration, and they are thus inevitably affected by the sparsity of gauge data or temporally incomplete gauge time series in the region under investigation.
3 Methodology
3.1 Standardized precipitation index (SPI)
The methodology adopted in this study involves application of the SPI software (Mckee et al. Citation1993) and fitting a gamma probability density function to a given frequency distribution of monthly precipitation totals for each station. Generally, the gamma distribution has been found to fit precipitation data quite well. The probability density function is calculated as:
where β is the scale parameter, α is the shape parameter, x is the monthly rainfall data, and Γ(α) is the gamma distribution function. The parameters of the gamma distribution function are estimated for each station for the chosen time scale (1-, 3-, 12-month, etc.). The parameters α and β are estimated using the maximum likelihood method. The gamma distribution is undefined for x = 0, but the precipitation may have zero value, so the cumulative probability distribution given a zero value is derived as follows:
where q is the probability of the zero precipitation value. The cumulative probability distribution is then transformed into the standard normal distribution to calculate SPI. A full description of the methodology on the calculation of SPI is available in Lloyd‐Hughes and Saunders (Citation2002).
According to Mckee et al. (Citation1993), the index has a normal distribution, so it can be used to estimate both dry and wet periods. A wet period according to the SPI value may be defined, for a time scale i, as the period during which the SPI is continuously positive and reaches a value of +1 or higher, and a drought period begins when the SPI value is continuously negative and reaches a value of –1.0 or lower. An SPI at different time scales, e.g. 3-month SPI of a particular month represents the deviation in precipitation totals for the same month and current plus previous 2 months. It indicates how the precipitation for a specific period compares with the complete record at a given station. In this study, analysis was conducted for multiple time scales ranging from 1 to 24 months.
When interpreting SPI, one should bear in mind that dryness and wetness are relative to the historical average rather than the total of precipitation of a particular location. For example, a given magnitude of precipitation at a dry station may produce a negative SPI value, while at a different extremely dry location within the same catchment the same precipitation magnitude may give a positive SPI value. shows the classification scheme of SPI values according to WMO standards (WMO Citation2012). The SPI analysis was carried out for time scales of 1 to 24 months successively.
Table 2. SPI values.
3.2 Standardized streamflow index (SSI)
Streamflow is an important variable used for monitoring both droughts and floods. To assess the best SPI time scale for explaining the temporal variability in the streamflow time series, a Pearson correlation analysis was performed between the monthly SSI and SPI series at time scales of 1 to 24 months. Given that streamflow is the integrated response of the catchment to rainfall from different parts of the catchment, SPI values used in the analysis were obtained by calculating the arithmetic average of SPI values from raingauge stations located upstream of each gauging station. The arithmetic average was used on the basis that, once the rainfall data from the various stations have been converted to SPI values, the influence of “areal average rainfall” no longer applies. This is because the transformation of SPI to the standard normal distribution with a mean of zero and a standard deviation of 1 makes the SPI comparable over time and space (Barker Citation2016). The comparison between SSI and SPI provides an indication of the time taken for precipitation deficits to propagate through the hydrological cycle to streamflow deficits. This technique has been applied by several researchers for meteorological and hydrological drought analysis (López-Moreno et al. Citation2013, Barker Citation2016). Note that rainfall data from six raingauge stations located outside the catchment domain were not used because they do not contribute to streamflow measured inside the catchment. is also valid for the classification of SSI.
Generally, the calculation of the SSI is mathematically similar to the SPI calculation shown in Section 3.1 and uses the same principle as the SPI, by aggregating streamflow data over selected accumulation periods. Given the heterogeneity in river and catchment characteristics (Vicente-Serrano et al. Citation2011), the most suitable probability distribution that can be used to fit individual streamflow series measured along the river may vary. Due to this variation, different probability distributions (lognormal, Pearson type III, gamma, Weibul, generalized Pareto, general extreme value) have been applied to fit streamflow data for SSI calculation (Vicente-Serrano et al. Citation2011). In this study the gamma distribution was used to fit streamflow. This distribution has been used extensively to fit global streamflow datasets in previous studies (Vogel and Wilson Citation1996, Mcmahon et al. Citation2007, Du et al. Citation2013, Zhang et al. Citation2015).
The SSI was calculated at two gauging stations along the Logone River: upstream at Bongor (estimated drainage area of 73 000 km2) and downstream at Logone Gana (outlet; estimated drainage area of 86 240 km2). These stations were selected based on available river discharge records and also because Bongor is the only reliable station located downstream of the Sudano zone of the catchment, while Logone Gana is located at the outlet in the semi-arid zone.
3.3 The Mann-Kendall trend test
The nonparametric Mann-Kendall (M-K) test was applied to the SPI time series to examine the presence of trends. This test is widely used to detect trends in hydrology and climatology because it is robust against non-normal distributions and insensitive to missing values. The null hypothesis H0 states that there is no significant trend in the examined time series. The hypothesis is rejected if the p value of the test is less than the significance level (e.g. 0.05, indicating a 95% confidence level). The M-K test has been used in several drought studies (Du et al. Citation2013, Golian et al. Citation2015, He and Gautam Citation2016). Detailed information on the application of this test is widely available in the literature. In this study the results were calculated for the 95% confidence interval.
The catchment was divided into two parts: the northern part, termed the Sahelian zone, for stations located between latitudes 10 and 12°N, and the southern part, termed the Sudano zone, for stations located between latitudes 6 and 10°N. The main difference between the two zones is an increase in annual rainfall total from stations located in the north over those in the south (Nkiaka et al. Citation2017). gives the station name, coordinates, and long-term mean, maximum and minimum of the annual rainfall time series for each station.
4 Results
4.1 Frequency of dry/wet years
A 12-month SPI analysis was used for the 17 stations in order to show the prevalence and spatial distribution of dry and wet conditions across the catchment. Using the threshold values in , a particular year was considered dry if SPI ≤ –1.0 and wet if SPI ≥ 1.0. shows the spatial distribution and frequency of occurrence of dry and wet years. For example, stations belonging to group 0.16–0.20 in ) experienced dry episodes in 16–20% of all the years used in the study, while stations belonging to group 0.18–0.20 in ) experienced wet conditions in 18–20% of all years used (1951–2000). The analysis also showed that the frequency of occurrence of drought conditions was high for stations located in the Sudano zone of the catchment. For example, stations Ngaoundere, Baibokoum, Bongor and Bekao with high annual rainfall instead experienced the highest frequency of occurrence of severe dryness.
Figure 2. Frequency of occurrence and spatial distribution of dry and wet years in the Logone catchment for the 1951–2000 period. Frequency was calculated as a percentage according to the 12-month SPI for each year: a dry year was defined when SPI ≤ −1.0 and a wet year when SPI ≥ 1.0.
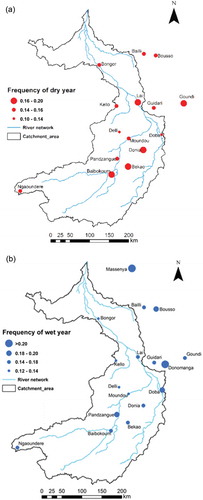
Meanwhile, no drought conditions were observed in Massenya, the most northerly station, located in the Sahelian zone of the catchment. This station instead witnessed the highest frequency of wetness conditions (35.0%), which is surprising. These results are consistent with the findings of Roudier and Mahe (Citation2010), who observed in the Bani basin (located in the same latitudinal zone as the Logone catchment) that the semi-arid northern part of the basin was less prone to droughts compared to the southern part.
Overall the results indicate that both the Sudano and Sahelian zones of the catchment are prone to both droughts and floods, as shown in , although the average frequency of occurrence of floods is slightly higher (17.60%) compared to that for droughts (13.50%). gives a detailed analysis of the results.
Table 3. Frequency of occurrence (%) of drought and flood episodes in the Logone catchment.
4.2 Analysis of dry/wet conditions at multiple time scales
Analysis of SPI at 1- and 3-month time steps showed that SPI values frequently fluctuated above and below zero, with no extended periods of dryness or wetness, but short episodes of dry and wet conditions (()). The results are consistent with the findings of Ndehedehe et al. (Citation2016) in the southern part of the LCB covering the Logone catchment. Using the effective drought index (EDI), Roudier and Mahe (Citation2010) also reported that droughts were more frequent but of shorter duration in the southern area of the Bani basin. The SPI analysis at shorter time scales is mostly useful for monitoring past dry and wet conditions. This may be useful in reconstructing the flood history of a catchment.
Figure 3. SPI time series for selected accumulated periods at different raingauge stations: (a) Ngaoundere, (b) Bailli and (c) Bekao corresponding to 1, 3 and 12 months, respectively.
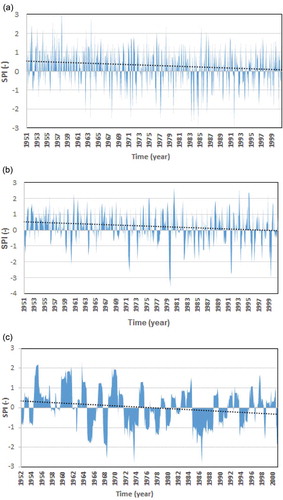
The SPI analysis at a 12-month time step demonstrated a strong variation in annual rainfall fluctuating between wet and dry years ()). Generally, the results show that drought events were frequent at shorter time scales but lasted for shorter durations at longer time scales, and droughts were less frequent but persisted for longer periods (). Furthermore, the period of occurrence and duration of dry and wet years varied from one station to another. These results are consistent with the findings of Cheo et al. (Citation2013). Using SPI analysis at a 12-month time step, Cheo et al. (Citation2013) reported that there was a significant spatial variability in drought occurrence and intensity across the northern regions of Cameroon, located adjacent to the Logone catchment.
4.2.1 Spatiotemporal variation of dry conditions
Analysis of 12-month SPI across all the stations showed that all but one station in the catchment experienced a minimum of three periods of drought. These droughts could be categorized as ranging from moderate to extreme, with different durations, beginning as early as the mid-1960s at some stations, before becoming very noticeable at most stations after 1970. Drought episodes with extended durations occurred around 1971–1973, 1981–1984 and 1991–1993. Nevertheless, the total duration, severity and period of occurrence of the drought episodes varied from one location to another.
Based on and using 12-month SPI to analyse drought categories showed that the Sahelian zone experienced extreme droughts of, on average, longer duration (20 months) compared to the Sudano zone (14 months). Meanwhile, severe droughts lasted for almost the same duration (24 months) in both parts of the catchment. Moderate droughts persisted longer in the Sudano zone, with an average duration of 52 months compared to 47 months in the Sahelian zone. The results follow the findings of Ndehedehe et al. (Citation2016), who reported that the Sudano zone of the LCB was more vulnerable to drought conditions compared to the Sahelian zone. Roudier and Mahe (Citation2010) also reported that the duration of droughts was slightly longer in the southern zone of the Bani basin compared to the extreme northern part.
Further scrutiny of 12-month SPI time series revealed that, apart from 1980 decade when most severe to extreme droughts seemed to concentrate in the middle of the decade, severe and extreme drought conditions appear to be mostly concentrated around the beginning or end of a decade, interspersed with moderate drought conditions. The results also show that moderate/severe droughts were mostly intra-annual and lasted for shorter periods, while extreme droughts were inter-annual and persisted for longer periods, e.g. September 1971–April 1972, October 1983–May 1985 and September 1999–July 2000 for Baibokoum, Ngaoundere and Bousso stations, respectively.
The temporal and spatial evolution of drought variability using a 12-month SPI further indicated that the driest months in the catchment were recorded in the 1980s and 1990s with varying degrees of severity. In the Sahelian zone the driest months were recorded in Bailli (SPI = –2.78) in April 1980 and Bongor (SPI = –3.30) in May 1985. Meanwhile, in the Sudano zone the driest months were observed in Deli (SPI = –4.38) in August 1992, Kello (SPI = –3.85) in May 1985, Baibokoum (SPI = –3.77) in June 1984 and Ngaoundere (SPI = –3.22) in August 1984. These values further indicate that droughts were more severe in the Sudano zone where the lowest SPI value was observed (–4.38) compared to the Sahelian zone (–3.30). Analysis also showed that extreme droughts prevailed during the period of the rainy season, especially around the months of July, August and September, and were generally preceded by periods of moderate to severe drought conditions. The prevalence of extreme drought conditions in the catchment during these months is consistent with the findings of Nkiaka et al. (Citation2017),who reported that there was a general decline in July, August and September rainfall in the catchment during the period 1951–2000.
4.2.2 Spatiotemporal variation of wet conditions
Analysis of 12-month SPI also revealed that all stations witnessed periods of wet conditions of different durations that can be classified as ranging from moderate to extreme (). The average duration of extreme wet conditions was slightly longer (16 months) for the Sudano zone compared to the Sahelian zone (11 months). Severe and moderate wetness persisted longer (39 and 70 months, respectively) in the Sahelian zone compared to the Sudano zone (27 and 56 months, respectively). Although the whole catchment experienced many periods of wetness of varying durations across individual station locations, wetter conditions prevailed longer in the Sahelian zone (120 months) compared to the Sudano zone (96 months). Surprisingly, Massenya station in the Sahelian zone continuously experienced repeated periods of wetness, ranging from moderate to extremely wet conditions, stretching into the year 2000. This suggests that the Sahelian zone may be more prone to floods than the Sudano zone.
Temporal analysis using 12-month SPI values showed that the wettest period in the catchment was recorded during the 1950s, with the highest SPI (3.58) observed in Moundou. A close examination of – reveals that wet conditions prevailed in most stations during the 1990s, ranging from moderate to extreme wetness of different durations across individual station locations. These results are consistent with those of other studies that reported on the prevalence of extensive floods in the region during this period (Odekunle et al. Citation2008, Tschakert et al. Citation2010, Okonkwo et al. Citation2014, Louvet et al. Citation2016).
Figure 4. SSI time series for selected accumulated periods at the outlet of the Logone Gana gauging station: (a) 1 month, (b) 6 months and (c) 12 months.
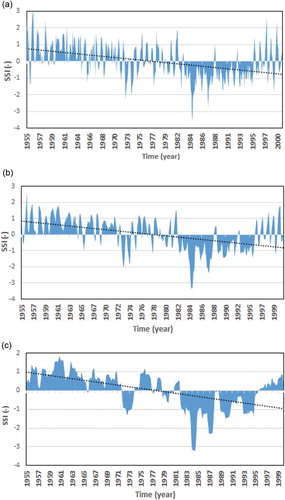
Figure 5. Correlation coefficients between the monthly SSI and the 1- to 24-month SPI.
4.3 Evaluation of hydrological droughts
The SSI results at different time scales are generally similar to those of SPI at equivalent time scales (). Unsurprisingly, more hydrological drought events were observed at shorter time scales, but, as the time scales increased, the number of drought events reduced while the duration increased. The results indicate that wet conditions prevailed in the catchment in the 1950s–1970s, though interspersed with a few episodes of hydrological drought during the 1970s.
Prolonged hydrological droughts prevailed in the catchment from 1980 to mid-1990, with the drought categories ranging from mild to severe (). Meanwhile, from mid-1990 to 2000, humid conditions dominated in the catchment. Similar observations were made using the SPI at different station locations across the catchment, which correspond to previous studies in the region, as mentioned in Section 4.2.
4.4 Results of trend analysis
The results of the M-K trend test showed that, across the catchment and at all time scales considered, negative trends in SPI were obtained with different significant levels. Therefore, the null hypothesis of no trend was rejected (). It can be observed that 7, 14 and 17 stations showed statistically significant negative trends at the 5% significance level for 1-, 3- and 12-month time scales, respectively (). These negative trends in SPI follow the general decline in rainfall over the catchment and are consistent with reported trends in the region (Odekunle et al. Citation2008, Nkiaka et al. Citation2017). Although no drought conditions were observed at Massenya station, it is worth noting that there was a significant negative trend in rainfall at this station during the period under study.
Table 4. Results of Mann-Kendall trend test for 1-, 3- and 12-month SPI and SSI time series. ZMK: Mann-Kendall test statistic. Bold values indicate that the trend is statistically significant at the 5% level as per the two-tailed test for SPI and 1% for SSI.
The results of the M-K trend analysis also show the presence of statistically significant negative trends for all SSI time series (). Our results are consistent with findings in the region, whereby a deficit in rainfall led to a corresponding drop in streamflow in most rivers across the Sudano-Sahel region (Paturel et al. Citation2003).
4.5 Relationship between SPI and SSI
The results of Pearson correlation analysis between monthly SSI and SPI at different time scales (1–24 months) showed that all correlations were positive, although strong correlations were observed only at longer time scales (). The correlations showed that the Logone River has a low response to rainfall at short time scales, from weak correlations obtained. However, this progressively changed as the time scale increased, with strong correlations (≥0.70) observed after 12 and 15 months at Bongor and Logone Gana gauging stations, respectively. López-Moreno et al. (Citation2013) observed similar strong correlations between SSI and SPI at longer time scales across catchments in southern Spain, where catchments had permeable limestone headwaters. Barker (Citation2016) also reported similar findings across several catchments underlain by major aquifers in the UK.
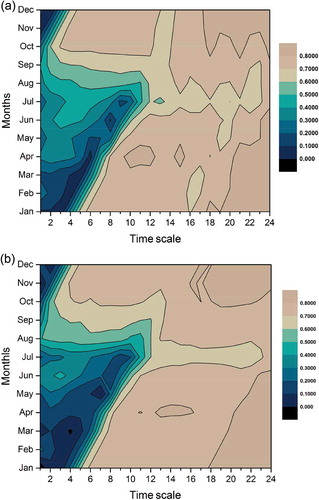
shows the results of monthly correlations between SSI and SPI for selected months. It can be observed from that the correlations changed seasonally according to SPI time scale but generally became very strong (≥0.70) after 12 months. During March, the correlation values dropped to a minimum after 4 and 5 months at Bongor and Logone Gana, respectively, before rising steadily to become very strong (≥0.70) after 8 months. The same phenomenon was observed for July, where the correlation values decreased to 0.20 after 9 months before increasing rapidly (≥0.70) within 3 months. The correlations for each month were summarized using contour plots for the two gauging stations (). From , it can be observed that the response time of the catchment is 5–6 months at the beginning of the rainy season (June/July), while towards the end of the rainy season (September/October) the response time reduces to 3 months, as indicated by very strong correlation values (≥0.70).
Figure 6. Correlation coefficients between the monthly SSI and SPI for different individual months: (a) Logone Gana and (b) Bongor. The x-axis indicates the time scale of SPI.
Figure 7. Contour plots summarizing monthly correlation coefficients for (a) Bongor and (b) Logone Gana. The x-axis indicates the time scale of SPI.
5 Discussion
The results from this study show that stations located in both parts of the catchment (Sudano and Sahelian) are prone to droughts of all categories which could last for different durations. However, stations located in the Sudano zone are more likely to experience extreme droughts of shorter duration, while those in the Sahelian zone experience droughts of slightly lower intensity but longer duration. Furthermore, the Sahelian zone of the catchment may be more prone to floods than the Sudano zone. The significant negative trends in SPI and SSI values suggest that there has been a significant change in the processes that influence rainfall and streamflow in the catchment. This indicates that the catchment is sensitive to natural climate perturbations and could thus be vulnerable to anthropogenic climate change.
The reasons why the Sudano zone may be more sensitive to extreme droughts compared to the Sahelian zone are not clear. Generally, the position and strength of the ITCZ (Inter-Tropical Convergence Zone) strongly influence the processes that generate rainfall over the region (Nicholson Citation2013).
Causes of droughts have been attributed mostly to changes in global sea-surface temperatures (SST), in particular the warming of the Pacific and Indian oceans, which led to changes in atmospheric circulation over the region (Giannini et al. Citation2008). In addition, droughts over the Sudano-Sahel have also been attributed to the occurrence of El Niño Modoki and canonical El Niño events, which are known to cause below average rainfall over the northern latitudes, especially over this region (Preethi et al. Citation2015). Furthermore, in the LCB, (Okonkwo et al. Citation2014) assert that, during the period under study, El Niño Southern Oscillation (ENSO) events may have contributed to a decrease in rainfall over the southern portion of the LCB where the Logone catchment is located.
Rainfall recovery in the region has been attributed to several effects: Giannini et al. (Citation2013) associated it with warming of the North Atlantic Ocean and asserted that, if this warming continues to exceed that of the global tropics, rainfall will intensify in the region; Dong and Sutton (Citation2015) attributed it to rising levels of greenhouse gases (GHGs) in the atmosphere; while Evan et al. (Citation2015) linked it to an upward trend in the Saharan heat low (SHL) temperature resulting from atmospheric greenhouse warming by water vapour.
The slow response of streamflow to rainfall in the Logone River could be attributed partly to the physical characteristics of the catchment, given the low surface gradient (≤1.3%) and the length of the river, which is almost 1000 km from the upper parts of catchment to the outlet at Logone Gana. The influence of topography and catchment size on the response times of river catchments has been reported in several studies (Soulsby et al. Citation2006, López-Moreno et al. Citation2013). Soulsby et al. (Citation2006) reported that small and mountainous catchments have short and steep flow paths, which are generally associated with a fast hydrological response to rainfall events. The Logone catchment is an extensive medium-sized lowland catchment; its size and gradient may significantly contribute to increase the response time from different parts of catchment after rainfall. The slow response could also be attributed to extensive wetlands in the catchment, so runoff is generated only after all depressions in the wetlands area filled.
The reasons why strong correlations occur at the outlet of the catchment (Logone Gana) after 15 months compared to 12 months upstream can be attributed to the fact that, after the Bongor gauging station, the wetland area increases significantly compared to the upstream area, thereby increasing the volume of water stored in the wetlands. Furthermore, there is a dam that captures and stores water from the Logone during peak-flow periods, further delaying the propagation of floodwater downstream. The influence of dams in delaying the response time of river catchments has also been reported in other studies (López-Moreno et al. Citation2013).
Given that the highest rainfall in the catchment was recorded in the Sudano zone located upstream, the slow response of the catchment to rainfall also suggests that most of the rainfall received upstream infiltrates into the groundwater aquifer, as observed by Nkiaka et al. (in review). Indeed, Candela et al. (Citation2014) reported that the kinds of soils found in the southern portion of the LCB covering the Sudano zone of the Logone catchment, where rainfall is high, favour aquifer recharge through rainfall infiltration and that the groundwater contribution to total streamflow in the Logone River was significant. Nkiaka et al. (in review) also observed that the groundwater contribution to streamflow was significant in the catchment. Given that these previous studies indicate a major role played by groundwater in the hydrology of the catchment, the delay in the response time of the catchment may also be attributed to groundwater storage from rainfall infiltration. Indeed, previous studies have identified groundwater storage as a major reason for delays in the response times of catchments (López-Moreno et al. Citation2013, Barker Citation2016).
The decrease in correlation values between SSI and SPI during the dry season may be attributed to the depletion of the water table due to high evapotranspiration rates in the catchment during this period. This suggests that as the water table drops, the contribution of groundwater to streamflow reduces. This can explain why the response time of the catchment increases to 5–6 months. At the onset of the rainy season, the water table starts to rise due to increased infiltration from rainfall. Towards the end of the rainy season, the water table becomes saturated and the groundwater contribution to streamflow becomes significant, thus reducing the catchment response time to about 3 months. The reduced response time towards the end of the rainy season could also be attributed to a high runoff coefficient resulting from wet antecedent soil moisture conditions as the soil moisture threshold is exceeded, which reduces the infiltration capacity of the soil (Penna et al. Citation2011). Therefore, as the water table becomes saturated and the soil moisture threshold is exceeded, any rainfall received in the catchment during this period directly contributes to runoff generation, thus reducing the catchment response time.
Although flood events typically occur in time steps of hours to days, positive SPI values at longer time scales may not necessarily translate to flood(s) but may give information on the antecedent moisture conditions of the soil. Furthermore, positive SPI in the Logone catchment in particular will not translate directly to flood events in the river, given the considerable lag between rainfall and streamflow as observed in this study. Apart from that, SPI peaks at longer time scale(s) are not suitable for detecting flood peaks because the averaging effect of long-term accumulated precipitation may obscure the signal of extreme precipitation events over a short period (Du et al. Citation2013). On the other hand, SPI at longer time scales such as 12 months are suitable for representing droughts, because these events usually take a longer time to manifest as SPI responds more slowly to short-term precipitation variation.
The aim of spatiotemporal assessment of dry/wet conditions and their duration was to provide a weighted assessment for each zone and individual station location. From the drought severity ranking, it is possible for policy makers to focus attention on localities that are very prone to droughts by creating coping strategies such as developing irrigation and water-storage infrastructure, improving soil-water conservation techniques and diverting water to ensure environmental flows for wetlands ecosystem sustainability.
Although the whole catchment experienced many periods of wet conditions with varying severity and duration across individual station locations, wetter conditions prevailed longer in in the Sahelian zone. This implies that this part of the catchment may be more prone to extreme wetness and hence floods, especially because of the low surface gradient. Policy orientation here may seek to reduce flood risk through effective implementation of building regulations, to prevent people from constructing houses on flood-prone zones and develop/improve flood control infrastructure. Government through decentralized structures could also seek to provide weather forecasting information to the local population through community radios or SMSs, given that many such radio stations exist in the area and mobile telephone network coverage is high. Meanwhile, understanding the response time of a catchment can enhance disaster preparation.
6 Conclusions
The aim of this study was to use standardized indicators to calculate the frequency of occurrence of drought/flood events and the spatial distribution of dry and wet conditions; analyse their spatiotemporal characteristics and trends; and use the standardized precipitation index (SPI) and standardized streamflow index (SSI) to assess the relationship between rainfall and streamflow.
Analysis using 12-month SPI values showed that annual rainfall was very variable in the catchment as there was a strong variation between SPI values from year to year. However, rainfall in the catchment during the period under study could be described as near stable given that near normal (–0.99 to 0.99) conditions dominated in most raingauge stations, with an average frequency of occurrence above 65%.
Analysis of SPI at different time scales showed several periods of meteorological drought ranging from moderate to extreme. SSI analysis also showed that, while wetter conditions prevailed in the catchment from the decades of the 1950s to the 1970s interspersed with episodes of hydrological drought in the 1970s, hydrological droughts persisted in the catchment from 1980 to mid-1990. Our findings also indicate that the Sudano and Sahelian zones are equally prone to drought and flood conditions, although the Sudano zone is more sensitive to drier conditions while the Sahelian zone is sensitive to wetter conditions. Rainfall and streamflow analysis showed that the catchment responded very slowly to rainfall at short time scales but the situation changed at longer time scales.
This study has permitted us to identify localities within the catchment that are prone to dry/wet conditions using available rainfall data. The results obtained can help farmers to decide which crops to cultivate in which part of the catchment, e.g. drought-resistant crops in areas prone to droughts. Furthermore, the identification of the drought/flood-prone areas can enhance management planning to improve the socio-economic conditions of the population living in these locations, e.g. through the protection of assets of small-scale farmers and herders.
However, given the considerably small number of raingauge stations used for analysis compared to the catchment size, these results should be regarded with caution as they may not represent the actual situation in the catchment, especially in the semi-arid zone where only four raingauges were used. Furthermore, given that rainfall data were not available from the year 2000 onwards, the results presented in this study may no longer represent the recent situation prevailing in the catchment, given that the time lapse is >16 years.
Analysis of SPI and SSI at longer time scales can give an idea of the duration of the wet or dry periods in the catchment, given that SPI responds more slowly as the time scale increases so the cycles of positive or negative SPI values become more visible. This can give an indication of the abundance of water resources over a given time period or shortage of water, which is usually manifested by the occurrence of droughts.
Using this study, it was possible to show that in catchments with physical, climatic and hydrological regimes that vary, the SPI and SSI can be effectively used to analyse drought and floods conditions. By using both indicators, it is possible to show how physical catchment characteristics, e.g. surface gradient, wetlands and manmade structures (e.g. dams), and soil types that influence surface and groundwater movement, can significantly affect the catchment response time.
Application of SPI and SSI can be used to enhance the understanding of the hydrological behaviour of catchments, which is indispensable for developing water management policies for adaptation in the context of climate change. This can be used for disaster preparation in remote areas where modern facilities for disaster risk preparation are often absent, thereby allowing preventative measures to be implemented, and so reducing vulnerability of the local population to climate-related disasters.
Acknowledgements
The first author is sponsored by the Commonwealth Scholarship Commission in the UK. The authors are grateful to SIEREM for making data used in this research available free on their website. The authors wish to thank two anonymous reviewers and editor(s) whose insightful comments helped to improve the quality of the manuscript.
Disclosure statement
No potential conflict of interest was reported by the authors.
References
- Adenle, D., 2001. Groundwater resources and environmental management in Niger Basin Authority and Lake Chad Basin Commission agreements. Ibadan, Nigeria: UIPO.
- Barker, L.J., 2016. From meteorological to hydrological drought using standardised indicators. Hydrology and Earth System Sciences, 20, 2483. doi:10.5194/hess-20-2483-2016
- Boyer, J.-F., et al., 2006. SIEREM: an environmental information system for water resources. IAHS Publication, 308, 19.
- Candela, L., et al., 2014. Groundwater modelling with limited data sets: the Chari–Logone area (Lake Chad Basin, Chad). Hydrological Processes, 28, 3714–3727. doi:10.1002/hyp.v28.11
- Cheo, A.E., Voigt, H.-J., and Mbua, R.L., 2013. Vulnerability of water resources in northern Cameroon in the context of climate change. Environmental Earth Sciences, 70, 1211–1217. doi:10.1007/s12665-012-2207-9
- Dong, B. and Sutton, R., 2015. Dominant role of greenhouse-gas forcing in the recovery of Sahel rainfall. Nature Climate Change, 5, 757–760. doi:10.1038/nclimate2664
- Du, J., et al., 2013. Analysis of dry/wet conditions using the standardized precipitation index and its potential usefulness for drought/flood monitoring in Hunan Province, China. Stochastic Environmental Research and Risk Assessment, 27, 377–387. doi:10.1007/s00477-012-0589-6
- Evan, A.T., et al., 2015. Water vapor–forced greenhouse warming over the Sahara Desert and the recent recovery from the Sahelian drought. Journal of Climate, 28, 108–123. doi:10.1175/JCLI-D-14-00039.1
- Field, C.B., et al., 2014. Climate change 2014: impacts, adaptation, and vulnerability. Cambridge: Cambridge University Press.
- Gautam, M., 2006. Managing drought in sub-Saharan Africa: policy perspectives. Invited paper prepared for presentation at the International Association of Agricultural Economists, 16–18 August, Gold Coast, Australia.
- Giannini, A., et al., 2008. A global perspective on African climate. Climatic Change, 90, 359–383. doi:10.1007/s10584-008-9396-y
- Giannini, A., et al., 2013. A unifying view of climate change in the Sahel linking intra-seasonal, interannual and longer time scales. Environmental Research Letters, 8, 024010. doi:10.1088/1748-9326/8/2/024010
- Golian, S., Mazdiyasni, O., and Aghakouchak, A., 2015. Trends in meteorological and agricultural droughts in Iran. Theoretical and Applied Climatology, 119, 679–688. doi:10.1007/s00704-014-1139-6
- Guerreiro, M.J., Lajinha, T., and Abreu, I., 2008. Flood analysis with the standardized precipitation index (SPI). Revista Da Faculdade De Ciência E Tecnologia, 4, 8–14.
- Hao, Z. and Aghakouchak, A., 2013. Multivariate standardized drought index: a parametric multi-index model. Advances in Water Resources, 57, 12–18. doi:10.1016/j.advwatres.2013.03.009
- He, M. and Gautam, M., 2016. Variability and trends in precipitation, temperature and drought indices in the state of California. Hydrology, 3, 14. doi:10.3390/hydrology3020014
- Ionita, M., Scholz, P., and Chelcea, S., 2015. Spatio‐temporal variability of dryness/wetness in the Danube River Basin. Hydrological Processes, 29, 4483–4497. doi:10.1002/hyp.v29.20
- Lloyd‐Hughes, B. and Saunders, M.A., 2002. A drought climatology for Europe. International Journal of Climatology, 22, 1571–1592. doi:10.1002/(ISSN)1097-0088
- López-Moreno, J., et al., 2013. Hydrological response to climate variability at different time scales: A study in the Ebro basin. Journal of Hydrology, 477, 175–188. doi:10.1016/j.jhydrol.2012.11.028
- Loth, P.E., ed., 2004. The return of the water: restoring the Waza Logone Floodplain in Cameroon. Gland: IUCN.
- Louvet, S., et al., 2016. Comparison of the spatiotemporal variability of rainfall from four different interpolation methods and impact on the result of GR2M hydrological modeling—case of Bani River in Mali, West Africa. Theoretical and Applied Climatology, 123, 303–319. doi:10.1007/s00704-014-1357-y
- Machado, M., et al., 2011. 500 years of rainfall variability and extreme hydrological events in southeastern Spain drylands. Journal of Arid Environments, 75, 1244–1253. doi:10.1016/j.jaridenv.2011.02.002
- Mckee, T.B., Doesken, N.J., and Kleist, J., 1993. The relationship of drought frequency and duration to time scales. In: Proceedings of the 8th Conference on Applied Climatology. Boston, MA: American Meteorological Society, 179–183.
- Mcmahon, T.A., et al., 2007. Global streamflows–part 1: characteristics of annual streamflows. Journal of Hydrology, 347, 243–259. doi:10.1016/j.jhydrol.2007.09.002
- Ndehedehe, C.E., et al., 2016. Spatio-temporal variability of droughts and terrestrial water storage over Lake Chad Basin using independent component analysis. Journal of Hydrology, 540, 106–128. doi:10.1016/j.jhydrol.2016.05.068
- Nicholson, S.E., 2013. The West African Sahel: A review of recent studies on the rainfall regime and its interannual variability. ISRN Meteorology, 2013, 1–32. doi:10.1155/2013/453521
- Nkiaka, E., Nawaz, N., and Lovett, J., 2016. Using self-organizing maps to infill missing data in hydro-meteorological time series from the Logone catchment, Lake Chad basin. Environmental Monitoring and Assessment, 188, 1–12. doi:10.1007/s10661-016-5385-1
- Nkiaka, E., Nawaz, N.R., and Lovett, J.C., 2017. Analysis of rainfall variability in the Logone catchment, Lake Chad basin. International Journal of Climatology, 37, 3553–3564. doi:10.1002/joc.2017.37.issue-9
- Odekunle, T.O., Andrew, O., and Aremu, S.O., 2008. Towards a wetter Sudano‐Sahelian ecological zone in twenty‐first century Nigeria. Weather, 63, 66–70. doi:10.1002/(ISSN)1477-8696
- Okonkwo, C., Demoz, B., and Gebremariam, S., 2014. Characteristics of Lake Chad level variability and links to ENSO, precipitation, and river discharge. The Scientific World Journal, 2014.
- Okonkwo, C., Demoz, B., and Onyeukwu, K., 2013. Characteristics of drought indices and rainfall in Lake Chad Basin. International Journal of Remote Sensing, 34, 7945–7961. doi:10.1080/01431161.2013.827813
- Paturel, J.-E., et al., 2003. The concept of rainfall and streamflow normals in West and Central Africa in a context of climatic variability. Hydrological Sciences Journal, 48, 125–137. doi:10.1623/hysj.48.1.125.43479
- Peel, M.C., Finlayson, B.L., and Mcmahon, T.A., 2007. Updated world map of the Köppen-Geiger climate classification. Hydrology and Earth System Sciences, 11, 1633–1644. doi:10.5194/hess-11-1633-2007
- Penna, D., et al., 2011. The influence of soil moisture on threshold runoff generation processes in an alpine headwater catchment. Hydrology and Earth System Sciences, 15, 689–702. doi:10.5194/hess-15-689-2011
- Preethi, B., et al., 2015. Impacts of the ENSO Modoki and other tropical Indo-Pacific climate-drivers on African rainfall. Scientific Reports, 5. doi:10.1038/srep16653
- Roudier, P. and Mahe, G., 2010. Study of water stress and droughts with indicators using daily data on the Bani river (Niger basin, Mali). International Journal of Climatology, 30, 1689–1705. doi:10.1002/joc.v30:11
- Seiler, R., Hayes, M., and Bressan, L., 2002. Using the standardized precipitation index for flood risk monitoring. International Journal of Climatology, 22, 1365–1376. doi:10.1002/(ISSN)1097-0088
- Soulsby, C., et al., 2006. Runoff processes, stream water residence times and controlling landscape characteristics in a mesoscale catchment: an initial evaluation. Journal of Hydrology, 325, 197–221. doi:10.1016/j.jhydrol.2005.10.024
- Traore, S. and Owiyo, T., 2013. Dirty droughts causing loss and damage in Northern Burkina Faso. International Journal of Global Warming, 5, 498–513. doi:10.1504/IJGW.2013.057288
- Tschakert, P., et al., 2010. Floods in the Sahel: an analysis of anomalies, memory, and anticipatory learning. Climatic Change, 103, 471–502. doi:10.1007/s10584-009-9776-y
- Vicente-Serrano, S.M., et al., 2011. Accurate computation of a streamflow drought index. Journal of Hydrologic Engineering, 17, 318–332. doi:10.1061/(ASCE)HE.1943-5584.0000433
- Vogel, R.M. and Wilson, I., 1996. Probability distribution of annual maximum, mean, and minimum streamflows in the United States. Journal of Hydrologic Engineering, 1, 69–76. doi:10.1061/(ASCE)1084-0699(1996)1:2(69)
- Washington, R., et al., 2006. African climate change: taking the shorter route. Bulletin of the American Meteorological Society, 87, 1355–1366. doi:10.1175/BAMS-87-10-1355
- Wilhite, D.A. and Glantz, M.H., 1985. Understanding: the drought phenomenon: the role of definitions. Water International, 10, 111–120. doi:10.1080/02508068508686328
- WMO, 2012. Standardized precipitation index user guide. M. Svoboda, M. Hayes, and D. Wood, Eds.. (WMO-No. 1090). Geneva, Switzerland: WMO.
- Zhang, Y., et al., 2015. Analysis of dry/wet conditions in the Gan River Basin, China, and their association with large-scale atmospheric circulation. Global and Planetary Change, 133, 309–317. doi:10.1016/j.gloplacha.2015.09.005