
ABSTRACT
Sediment transport from mountainous to lowland areas is considered one of the most important geomorphological processes. In the present study, variations in transported sediment loads and dissolved loads have been studied over 3 years (2008–2011) for two forested catchments located in the Lesser Himalayan region of India. Seasonal and annual suspended sediment flux was strongly influenced by amounts of rainfall and streamflow. On average, 93% of annual load was produced during the monsoon, of which 62–78% occurred in only five peak events. Sediment production by the degraded forest catchment (Bansigad) was 1.9-fold (suspended sediment load) to 5.9-fold (bedload) higher than the densely forested catchment (Arnigad). The dissolved organic matter potentially influences total dissolved solids in the stream. Heavy rainfall triggers both stream discharge and landslides, which lead to higher bedload transport. Total denudation rates for Arnigad and Bansigad were estimated at 0.68 and 1.02 mm year−1, respectively.
Editor R. Woods Associate editor C. Perrin
1 Introduction
Rivers and streams in the Himalayas carry sediment in their flows and transport it from one part of the system to another (Lupker et al. Citation2012). Sediment transport, its seasonal and inter-annual variability (Andermann et al. Citation2012a) and sediment flux (Wasson Citation2003) cause serious problems in the operation of hydropower projects, dam and river management, ecological functioning, biological diversity, reservoir siltation, channel bed modification, landslides etc. (Jain et al. Citation2001, Zokaib and Naser Citation2011, Grauso et al. Citation2008, Donohue and Molinos Citation2009, Hedrick et al. Citation2013, Sudhishri et al. Citation2014, Iwuoha et al. Citation2016). These problems in the Himalayas are continuously increasing and can interfere with human activities (e.g. erosion of topsoil greatly reduces the productivity of the land; erosion of land from beneath houses causes property damage and can even kill people). On the one hand, understanding the dynamics of sediment fluxes is a key issue in constraining current erosion rates in the Himalayas (Andermann et al. Citation2012a), while on the other hand, it is challenging to make quantitative estimates of the mass removed from the system through physical and chemical erosion (Lupker et al. Citation2012). Anthropogenic activities (e.g. overgrazing, overcropping, deforestation, road construction, mining, farmland cultivation) coupled with the natural influence of the monsoon pattern of rainfall, high rainfall intensities, fragile catchments (hydrologically sensitive) and unstable geology (landslide-prone areas; seismically active areas etc.) are responsible for soil erosion in the Himalayas (Singh et al. Citation2008, Singh Citation2011, Wulf et al. Citation2010, Citation2012). About 80–90% of the total annual rainfall has the potential to contribute to runoff generation (Andermann et al. Citation2012b, Qazi et al. Citation2017) and about 87% contributes towards sediment mobilization (Merz et al. Citation2006b). Research interests pertaining to sediment transport in the Himalayan river systems have attracted much attention; however, information concerning the sediment transport (suspended sediment concentration), deposition process (bed material deposition) and chemical process (dissolved solids) along the river/stream, especially in the case of catchments, and the impact of forest cover, is limited; this is primarily due to the remoteness and difficult access of the terrain. Several studies (Sharma et al. Citation2006, Citation2007a, Hessel et al. Citation2007a, Citation2007b, Datta and Kirchner Citation2010, Gera et al. Citation2010, Datta et al. Citation2014) have been undertaken in the Mussoorie area (India) at the catchment scale. Of these, only a few studies (e.g. Hessel et al. Citation2007a, Datta and Kirchner Citation2010, Datta et al. Citation2014) focused on sediment transport based on GIS tools with limited field-based data. Therefore, assessment of sediment transport is still underway in this region. The present study aims to contribute to a better understanding of the sediment transport of forested headwater catchments in the Lesser Himalaya of India (Mussoorie area) by comparing seasonal and inter-annual variations of sediment response to rainfall over a 3-year period for two near-adjacent contrasted catchments: a largely undisturbed oak forest and a degraded/open oak forest. Specifically, we aim to investigate the hydrological behaviour in terms of (1) water discharge, (2) erosion (sediment flux), (3) denudation rates and (4) impact of forest cover on these hydrological processes.
2 Site description
2.1 Catchment characteristics
Two small headwater catchments situated near one another (areal distance: 1.5 km) were selected for the present study, namely the well-forested Arnigad catchment (285.7 ha; 30º26.5′27.2″N, 78º5.5′ 11.4″E) and the nearby Bansigad catchment (190.5 ha; 30º26.5′42.7″N, 78º2.5′30.3″E) under variably degraded oak forest. Both catchments are located near the hill town of Mussoorie, which is about 30 km from Dehradun, Uttarakhand, India (). Land cover at Arnigad consists of dense, protected Banj oak-dominated forest (Quercus leucotrichofora) (70%, 200 ha; tree cover >70%, also called Very Dense Forest; FSI Citation2013), with scattered bits of degraded forest (13%, 37 ha), housing (12%, 35 ha) and bare land (5%, 14 ha), all concentrated on the upper slopes and ridges away from the streams. At Bansigad, 65% (124 ha) is degraded forest (<40% tree cover, also called Open Forest; FSI Citation2013), while 28% (54 ha) consists of barren and eroding land with poor tree or ground cover, with the remaining area under roadside housing (5%, 9 ha) and rainfed agriculture (2%, 4 ha) in the central part of the catchment (). Both catchments are south-facing. Minimum and maximum elevations are similar for the two areas at 1650–2230 m a.m.s.l. (Arnigad) and 1620–2170 m a.m.s.l. (Bansigad), giving a maximum relief of 580 and 550 m, respectively. Corresponding relief ratios are 0.23 and 0.35, while slopes are mostly steep (>30º). The drainage pattern is dendritic (random stream branching pattern) in both cases, with a slightly higher drainage density at Arnigad: 2050 m km−2, against 1880 m km−2 at Bansigad, and both catchments are drained by second-order streams at the gauging site. The Arnigad contributes to the Rispana River, which lies within the Ganga River basin, whereas the Bansigad contributes to the Tones River draining eventually into the Yamuna River. Note that, during the 3-year period of hydrological observations, no change in forest cover occurred in either catchment as both areas were effectively protected under private ownership and management () and (b)).
Figure 1. Location, land-cover distribution and instrumentation sites of the two study catchments. The image for land cover was downloaded from the Bhuvan website in 2008 (LISS-III satellite imagery, resolution 23.5 m). From LISS-III imagery, a land-use/land-cover map was developed using ERDAS Imagine 9.2 software.
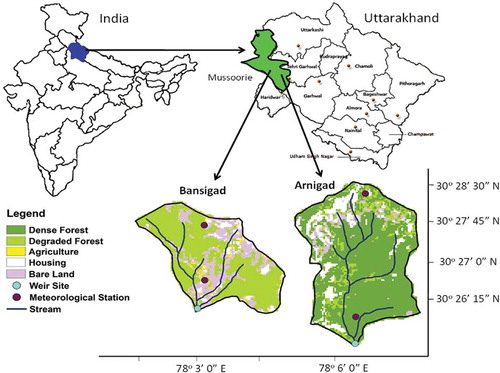
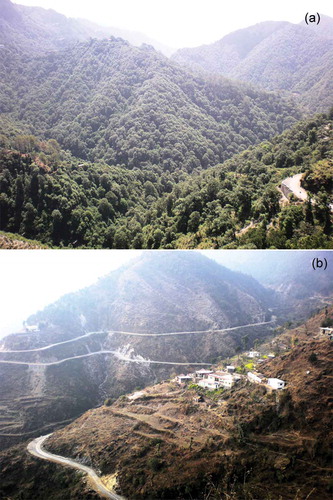
Figure 2. General impression of the forest at (a) Arnigad (largely undisturbed) and (b) Bansigad (degraded). Images were taken (a) at the top ridge (camera position south-facing) and (b) at the side ridge of the catchment (camera position north-facing). Photographs by N.Q. Qazi.
2.2 Climatology and geography of the region
The climate is warm-temperate and monsoonal. Mean annual rainfall at nearby Mussoorie (2005 m a.m.s.l.) is 2005 mm (1961–1995) of which 60–85% is received during the monsoon (June–September), while much more modest amounts (<10%) are supplied through so-called “western disturbances”, occurring during the winter months (Hanner Citation2006). Inter-annual differences in rainfall can be very large depending on the strength of the Indian Monsoon System (Hessel et al. Citation2007b). Mean annual air temperature at Mussoorie (1961–1995) is 14ºC, with June being the hottest month on average (20ºC) and January the coldest (6ºC) (Hanner Citation2006). There was no orographic rainfall distribution from Bansigad to Arnigad. Evaporation at 1700 m a.m.s.l. amounted to ~1100 mm year−1 at Arnigad (2008–2011) and was measured with the help of pan evaporation.
The study area falls in a sensitive and fragile zone of the Mussoorie hills, which is affected by landslides (Yadav and Ram Citation2014) and also by limestone quarrying. Geologically, the area refers to the litho-tectonic zone lying south of the Main Boundary Thrust (MBT) and is separated to the north by the Main Central Thrust (MCT). It predominantly consists of Proterozoic-Cambrian shelf to shallow marine sequences exposed in two main belts: the inner carbonate belt and the outer Krol belt. The stratigraphy of the Mussoorie syncline consists largely of sedimentary rocks of the Krol belt. It is separated from the Siwaliks by the MBT in the Lesser Himalaya at 1500–2500 m height (Chauhan et al. Citation2017).
3 Instrumentation and methods
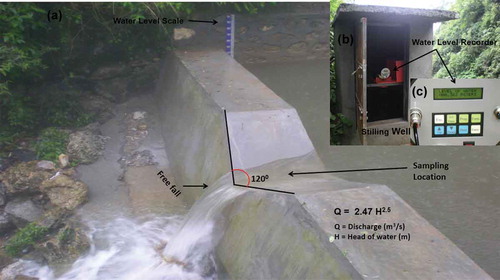
For the measurement of rainfall, two types of gauge were used: a tipping-bucket raingauge for continuous recording (Rainwise, USA; 325 cm2 orifice, 0.25 mm per tip) and an ordinary raingauge (RK Engineering, India; 2000 cm2 orifice) for backup. The data from the recording (tipping-bucket) raingauges were cross-checked with the manually read (ordinary) raingauges of 1-day temporal resolution, which were installed in the compound of the same measurement site. Both gauge types were installed at two elevations in each catchment, i.e. at approx. 1700 and 1900 m a.m.s.l. (see for locations). The manual gauges were read twice a day at 08:30 h and 17:30 h. For discharge measurements, a rectangular broad-crested weir was constructed with a sharp-crested 120º V-notch for better gauging of low flows () at both catchments. The width of the weir was 4.8 m at Arnigad and 6.6 m at Bansigad. Water levels were measured at 5 mm vertical resolution using an optical shaft encoder sensor (Virtual Ltd., India) coupled to a float placed in a stilling well (perforated pipe at Arnigad). Values were converted to a digital format by a micro-controller and stored at 15-min intervals. Daily areal rainfall totals were derived by simply averaging the two stations per catchment, since no clear relationship existed between rainfall and elevation over these catchments (own data and Hessel et al. Citation2007b).
Figure 3. (a) View of broad-crested compound weirs (120º V-notch), formula for conversion of water level into discharge, and sampling location. (b) Stilling well with water level recorder, and (c) display of water level recorder.
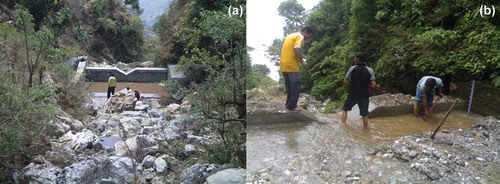
The water samples were collected from the main stream at the gauging sites. The collected samples were analysed following a grab sample method (IAEA Citation2005) to estimate the suspended sediment concentration (SSC). Suspended sediments were separated from the water samples using Watman 72 filter paper. During the monsoon (June–September), the sampling frequency was thrice a day: 08:00, 14:00 and 20:00 h, whereas during the post-monsoon (October–November), winter (December–March) and pre-monsoon (April–May), sampling was done on a daily basis (08:00 h). Monthly suspended sediment values were calculated from daily values. Bedload is certainly the most difficult fraction to measure (Wulf et al. Citation2010) and is essentially the unknown fraction (Galy and France-Lanord Citation2001). Deposited bedload (BL) was estimated in the present study following Hedrick et al. (Citation2013). The reservoirs (pond-like structures) at the gauging sites of Arnigad and Bansigad were constructed so that sediments accumulated in them. We assumed that the majority of the bedload flux was captured in these reservoirs over ~6 m × 4.8 m (Arnigad) and 12 m × 6.62 m (Bansigad) (). Sediment volumes were derived by measuring various depths/heights of deposited material at these reservoirs. These volumes were converted into mass by assuming a reservoir fill bulk density of 1.4 t m−3 (BBMB Citation1997). On the last day of every month, the accumulated bedloads were measured and then the reservoirs were mechanically cleaned (). During the monsoon, the frequency of measuring depth of bed material followed by cleaning was five or six times a month, to avoid flushing of bed material during peak events.
Figure 4. View of broad-crested compound weir (reservoir): (a) dry stream at Bansigad from March to mid-June, and (b) cleaning of bed material at a reservoir after a peak event.
Total dissolved solids (TDS) was measured by TDS tester (meter) once every 15 days. A TDS meter is basically an electrical charge (EC) meter, whereby two spaced electrodes are inserted into water and used to measure charge, with the result interpreted by the TDS meter and converted into a ppm (parts per million) value. If water contains no soluble materials and is pure, it will not conduct a charge and will therefore have a value of 0 ppm. The TDS meter was calibrated with a TDS calibration solution.
Data collection for all types of loads (SSL, BL and TDS) was from March 2008 to February 2011. Total load (TL) was calculated by summing SSL, TDS and BL (Singh et al. Citation2008).
In the Himalayas, strong relief and intense monsoonal rainfall provide favourable conditions for mass wasting (Korup and Weidinger Citation2011). Denudation rates (long-term mass wastage) were estimated by (Gregory and Walling Citation1973):
where D is the denudation rate in mm year−1, which is equivalent to m3 km−2 year−1; TL is total load in t year−1; area is in km2 and the average density of rock or soil was considered to be 2.67 g cm−3 (Lupker et al. Citation2012, Chauhan et al. Citation2017).
4 Results
4.1 Rainfall characteristics
The average annual rainfall for both catchments was 2922 mm (). The monsoon was the main contributor (June–September, 80–92%) to the annual rainfall. Winter precipitation in the form of snow was negligible at both locations. The classification or distribution of the seasons used in this study is according to Dongol et al. (Citation2005) and Merz et al. (Citation2006a). At Arnigad, the maximum monthly rainfall was recorded in September 2010 (1243 mm, 32% of annual total), while December 2008 and December 2009, as well as March and October 2010, remained rainless. The number of annual rainy days varied between 87 (2009/10) and 102 (2010/11), the majority of which (62–83%) occurred again during the monsoon. Nearly 37% of all daily rainfall was less than 10 mm, while 14 and 5% exceeded daily values of 50 and 100 mm, respectively. Absolute maximum daily values recorded in the respective hydrological years were 189 mm (July 2008), 198 mm (July 2009) and 190 mm (August 2010). Patterns observed for the nearby Bansigad catchment were very similar to those for Arnigad, and overall daily rainfall occurrence at Bansigad did not differ significantly (p < 0.05) from that at Arnigad.
Table 1. Seasonal variation of rainfall (R, mm), discharge (Q, mm), suspended sediment load (SSL, t km−2), bedload (BL, t km−2), total dissolved solids (TDS, t km−2), total load (TL, t km−2) and denudation (D, mm year−1) of Arnigad and Bansigad catchments.
4.2 Discharge characteristics
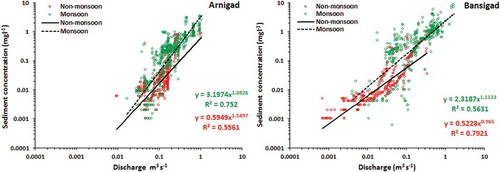
Discharge (Q) for the two catchments showed good response to rainfall. The monthly rise and fall of stream discharge were in accordance with rainfall. The monthly Q fell to 0.02 m3 s−1 in April and May (2010/11) and rose to 0.90 m3 s−1 in September (2010/11) at Arnigad, whereas at Bansigad, Q fell to 0.00 m3 s−1 from March to June (for all three studied years) and rose to 0.91 m3 s−1 in September (2010/11). Daily Q values for Arnigad and Bansigad were significantly different, but there was no significant difference on a monthly, seasonal and annual basis at the 5% level of significance. Rating curves were developed between instantaneous daily discharge and SSC. The best fit relationship between Q and SSC was a power curve, which is the most commonly used sediment rating curve (Q = aQb, where a and b are regression coefficients), and the power equation was log-transformed. The data were divided into two time scales (monsoon and non-monsoon). shows that seasonality influences the sediment rating patterns in both catchments. Different variability in discharge leads to different slopes of the relationship.
Figure 5. Rating curves between instantaneous daily discharge and suspended sediment concentration for Arnigad and Bansigad.
Seasonal and annual flow totals are summarized in , while a graphical summary representation of seasonal contrasts for the two basins is given in . Annual discharge from the well-forested catchment was about 14% lower than that from the degraded forest. As expected, the core monsoon contributed the bulk of the annual flow in both catchments, with both absolute and relative values being markedly higher for Bansigad (72–81%) compared to Arnigad (46–61%).
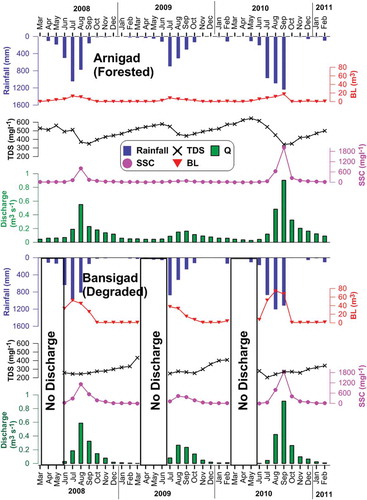
Figure 6. Temporal (monthly) variation of rainfall (R), discharge (Q), suspended sediment concentration (SSC), total dissolved solids (TDS) and bedload (BL).
4.3 Characteristics of TSS, BL and TDS
Temporal variations in total suspended sediment (TSS), bedload (BL) and total dissolved solid (TDS) had a significant effect on annual sediment transport behaviour in the catchment systems. Based on the values of TSS, BL and TDS at the sampling station, the annual sediment transport behaviour is presented in . The daily temporal variation of TSS at Arnigad for the period 2008–2011 ranged between 2 and 7910 mg L−1 (mean: 134 mg L−1), while at Bansigad, it was 0–6127 mg L−1 (mean: 207 mg L−1). However, the lowest TSS was experienced in March–May at Arnigad, whereas at Bansigad, the stream remained dry during March–June. The monsoon was the major contributor of TSS and accounted for 95% of the annual load transport of both catchments. More than 200% upsurge in total solids load was observed in the excessive rainfall year (2010). Inter-annual mean TSS was 3178 ± 3983 t and 4082 ± 4133 t at Arnigad and Bansigad, respectively.
Efforts were made to measure monthly deposited bedload. The monthly BL in the stream flowing through Arnigad was in the range 0.03–17.28 m3, whereas at Bansigad the monthly maximum volume was 74.64 m3 and no bedload material was observed (March–mid-June) in all three years because there was no discharge. The rainfall during the monsoon was found to be the major contributor of BL material (). Annually, BL accumulation varied from 13.1 to 23.4 t km−2 at Arnigad and from 73.6 to 151.4 t km−2 at Bansigad.
Total dissolved solids indicate the general nature of water quality or salinity and are usually related to conductivity. At Arnigad, TDS ranged from 340 to 645 mg L−1 and at Bansigad it was in the range 205–435 mg L−1. The TDS was consistently found to be higher than TSS in the drier months (winter, pre-monsoon). The annual sum and seasonal suspended and dissolved sediment transport is shown in . The gross chemical and physical erosion rates were, respectively, 0.26 and 0.42 mm year−1 at Arnigad and 0.18 and 0.84 mm year−1 at Bansigad. Thus, it can be concluded that the average denudation rate lies in the range 0.68–1.02 mm year−1 ().
5 Discussion
5.1 Rainfall dynamics
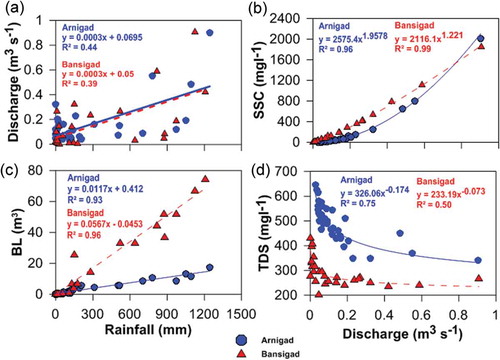
The precipitation data from the studied catchments suggest that the Indian Summer Monsoon (ISM) is responsible for 90% of average annual rainfall and the Winter Westerlies (WW) are responsible for only 10% of average annual rainfall. From the hydrological point of view, precipitation during the monsoon is the major driving factor (Singh et al. Citation2010, Nepal et al. Citation2014) for catchment functioning in the Himalayas. The hydrological year 2009/10 received the minimum rainfall, as the southwest monsoon in 2009 over the country was only 78% of its long-period average value (IMD Citation2009). More than 86% of average annual rainfall generates more than 56% (Arnigad) and 76% (Bansigad) of runoff during the monsoon; the remaining 14% is distributed throughout the year and generates 44% (Arnigad) and 24% (Bansigad) of runoff (). The annual hydrographs highlight the control of the monsoon, causing an increase in discharge of 1–2 orders of magnitude (Andermann et al. Citation2012a). We found a weak positive linear relationship between daily discharge and rainfall ()). This shows that the relationship is not only dependent on rainfall factors, but is also dependent on other factors, i.e. rainfall intensity, soil infiltration rates and the soil surface storage capacity (Qazi et al. Citation2012, Citation2017).
Figure 7. Relationships between (a) discharge (Q) and rainfall (R); (b) SSC and discharge; (c) BL and rainfall; and (d) TDS and discharge. SSC: suspended sediment concentration; TDS: total dissolved solids.
5.2 Sediment transportation dynamics
The average TSS was more than 90% during the monsoon seasons for both catchments (). The power law curve was the best fit between discharge and sediment ()). The coefficient of determination (R2) values (Arnigad: 0.96, Bansigad: 0.99) show that monthly values of SSC and Q are highly correlated and monthly relationships are stronger than those at the daily scale. However, some specific days are characterized by extraordinarily high SSC values that occurred predominantly during the peak period of the Indian monsoon. Within the 3-year period (2008–2011), we identified five events (consisting of 13 and 8 peak days) each at Arnigad and Bansigad transporting high SSC (≥2000 mg L–1). These five events were responsible for extreme SSC and contributed about 78% (5236 t) and 62% (5450 t) of average annual suspended sediment load at Arnigad and Bansigad, respectively. All these peak events occurred almost exclusively during August and September 2010 in both catchments. This means the year 2010/11 was an exceptional year () and was responsible for extraordinarily high sediment transport. Therefore, the results indicate that the contribution of just a few days (during the monsoon) represents a high proportion of the total suspended sediment yield (SSY) and this was because of high-intensity rainfall (Qazi et al. Citation2017), occurring only on a few days, generating higher discharge, which directly affects SSY. Indeed, high-intensity rainfalls frequently trigger landslides (Struck et al. Citation2015), loosened material and debris flows, which enhance sediment in stream discharge (Fuller et al. Citation2003). The high-magnitude, low-frequency events of the ISM contribute significantly to the stream discharge, providing large amounts of hillslope material to the stream. However, many rainstorms throughout the monsoon leave no elevated imprint on the SSC record (Andermann et al. Citation2012a).
Figure 8. Box plot of long-term seasonal and annual precipitation at Dehradun for 57 hydrological years (1951–2007; Aphrodite site). Boxes cover the 25th to 75th percentiles of each distribution with a central mark as the median. ○ indicates the long-term mean at Dehradun while *, + and Δ represent the 2008/09, 2009/10 and 2010/11 rainfall totals, respectively, as measured at Arnigad. ISM: Indian Summer Monsoon, MLW: Mid-Latitude Westerlies.
Suspended sediment production at Bansigad was 1.9 times higher than that of the Arnigad catchment. The lower suspended sediment values at Arnigad are presumably attributed to good forest cover available within the catchment system. The strong root system of the densely forested Arnigad catchment holds soil particles together and makes it difficult for natural forces, such as wind and water, to carry away the topmost fertile layer of the soil. Further, the forest canopy reduces the speed of high-intensity rainfall, which further retards erosion dynamics. The case at Bansigad was the reverse and rainfall leads to small landslides/erosion in the catchment. Nepal et al. (Citation2014) also supported the statement that forests generally influence local hydrology and affect ground cover through their root systems and organic humus layer, which contributes to controlling erosion dynamics. Other scientific studies confirm the crucial role of trees and forests in preventing sediment loss (Forbes and Broadhead Citation2011). Higher sediment production at Bansigad stream was due to disturbed forests and other anthropogenic activities (Tyagi et al. Citation2014). These activities (deforestation, lopping of forests, settlement, road construction, farming, mining etc.) coupled with high rainfall intensities lead to landslides that are continuously disturbing the natural system of the Himalayan environment, (Mukherjee Citation2013). The results presented in do not show any clear relationship between rate of erosion (denudation rates) and catchment elevation, but different land uses in a catchment system have drastic effects on erosion and sediment yield. In general, land covered with natural vegetation retards the rate of erosion and its dynamics (Cox et al. Citation2006, Mahmoudzadeh Citation2007, Singh et al. Citation2008, Zuazo and Pleguezuelo Citation2008, Zokaib and Naser Citation2011).
Table 2. Annual sediment yields and denudation rates in Lesser Himalayan catchments of India (after year 2000). Catchment denudation rate is based on bulk rock density of 2.65 g cm−3. HP: Himachal Pradesh; UK: Uttarakhand.
The monsoon was again the major contributor of BL (Arnigad: 84%, Bansigad: 94%). There was a positive linear relationship between BL and Q and between BL and R. The R2 value shows that discharge was, on average, 50% responsible for bedload transport in both catchments, whereas the impact of rainfall on bedload was more than 90% ()). Geologically, the study area comes under tectonically weak formations and is also affected by limestone quarrying. Unstable, steep terrains coupled with intense monsoonal rainfall lead to landslides (i.e. breaking down of rocks, boulders etc.) which directly contribute to heavy bedloads in the streams. Therefore, heavy rainfall triggers both stream discharge and landslides, which finally contribute to higher bedload transport (Fuller et al. Citation2003). Bedload at Bansigad was 5.9 times higher than that at Arnigad. This was because trees, logs, branches and forest floor form barriers for boulders, gavel, and debris etc., and bedload movement is reduced so it could not reach the stream. Heede (Citation1991) also found an inverse linear relationship between forest density and bedload movement. Further, the forest canopy reduces the speed of high-intensity rainfall, which further reduces landslide occurrence.
5.3 Dissolved solids dynamics
It was observed that changing levels of TDS usually showed a similar pattern of behaviour throughout the study period. The dissolved solids load at Arnigad was 1.4 times higher than that at Bansigad. As the two catchments are located very close to each other (areal distance: ~1.5 km), the rock types and their erodibility are presumed to be the same. The impact of the land use (forest) is the obvious element to account for higher dissolved solids at Arnigad. Higher organic matter in the soil of Arnigad (Tyagi et al. Citation2013) leaches through the forest floor with the help of rainwater. Large quantities of dissolved organic matter (DOM) (more than 95% of dissolved organic carbon and nitrogen),are generated in the forest floor (Quails and Haines Citation1992), and are directly related to the leaching process (Gergel et al. Citation1999, Michalzik and Matzner Citation1999, Creed et al. Citation2013) that circulates in the hydrological pathways, and organic matter is transported through streams (Schroth et al. Citation2001, Markewitz et al. Citation2004, Andrade et al. Citation2011, Costa et al. Citation2017). Therefore, the DOM leached from the soil can potentially influence TDS in the stream. The best fit curve between TDS and Q was the inverse power curve function ()), which means that with an increase in discharge, TDS decreases. This further explains that TDS becomes more dilute with increase in Q (Tipper et al. Citation2006, Calmels et al. Citation2011). The coefficient of determination (R2) shows that Arnigad had a stronger relationship between TDS and Q compared to Bansigad. This was because of the continuous baseflow during the summer seasons at Arnigad, which helped in maintaining such a relationship, whereas baseflow during summer at Bansigad was absent, breaking its continuity or losing its relationship with TDS. Therefore, the impact of forest cover has a wide impact on TDS through the hydrological processes of a system.
5.4 Sediment flux dynamics
The sediment flux of the study catchments showed alternately rising and falling trends during different seasons. Moreover, the sediment flux not only revealed temporal variation in different seasons, but also showed spatial variation during the same season. The elevated transport of sediment load during the monsoon was due to higher discharge rates coupled with nonpoint sources of SSC in the surface runoff. The mean annual contribution of sediment flux (TSS, BL and TDS) was, respectively, 61, 1 and 38% of TL at Arnigad, and 78, 4 and 18% of TL at Bansigad. Bedload transport in most cases remains less than the suspended load (Xiaoping Citation2003) in the lesser Himalayan range (Burtin et al. Citation2008, Chauhan et al. Citation2017).
The ratio of dissolved, Ds (chemical), to suspended, Ss (physical), solids (Ds/Ss) observed at the sampling sites was 2–8 (Arnigad) and 0.2–1.0 (Bansigad) for the monsoon and post-monsoon period (Wet season), indicating the overall dominance of TSS over TDS. However, the dry season Ds/Ss ratio increased to 113 and 587 at Arnigad and Bansigad streams, respectively, which suggests that the chemical process is more active in the winter and post-monsoon period (Dry season). However, the differences in Ds/Ss ratio at the two catchments are mainly due to the differences in hydrological pathways through which the water flows. For the Lesser Himalayan region, the Ds/Ss ratio is low (<1) during monsoon months and higher (1–7) during the dry period (Chauhan et al. Citation2017).
Based on previous studies (), sediment flux and denudation rate are highly variable in the Lesser Himalayan catchments. These studies showed that ISM has a significant contribution to annual sediment flux in the Lesser Himalaya. Our results show higher sediment flux and denudation rate as compared to other studies, as presented in . Sediment flux is linked directly to water discharge flux, which in turn is linked to the amount of annual rainfall. In order to check the precipitation conditions, we compared the long-term mean precipitation dataFootnote1 (1951–2007) of a grid (30.45°N; 78.08°E) with annual precipitation of Arnigad in the hydrological years 2008/09, 2009/10 and 2010/11. Annual precipitation (1984 mm) for 2009/10 was slightly lower (9%), whereas annual precipitation (2008/09: 2829 mm and 2010/11: 3832 mm) was much higher (23 and 43%, respectively) than mean annual precipitation over the 1951–2007 period. In conclusion, the years 2008/09 and 2010/11 were not normal hydrological years and the extremely high annual precipitation was responsible for the extremely high annual sediment load. Similar annual precipitation conditions prevailed at Bansigad. Therefore, precipitation totals measured in the study catchments exceeded those for Mussoorie during the study period (2008–2011) by 33%, which led to higher sediment flux and denudation rate.
6 Conclusions
The understanding of the hydrological processes of a catchment is crucial for its management and sustainable exploitation of the water resource. In this study, the response of a Lesser Himalayan catchment in terms of discharge, sediment flux and denudation was estimated in three different hydrological years. The rate of denudation for two second-order streams of the Lesser Himalayan catchment ranged between 0.69 and 1.04 mm year−1 and the results apply to the massive bedrock but not the actual surface.
Seasonal and annual suspended sediment flux was strongly influenced by rainfall and streamflow amounts. The station data demonstrate that the region is clearly under the influence of the Indian Monsoon System. Of the annual load, approx. 93% was produced during the monsoon (June–September) and contributed in both catchments. The results indicate that events on just a few days (five peak events during the monsoon) were responsible for extreme SSC and contributed about 78% (Arnigad) and 62% (Bansigad) of average annual suspended sediment load. Sediment production by the degraded forested catchment was 1.9-fold (suspended sediment) to 5.9-fold (bedload) higher than that for the densely forested catchment. Suspended sediment concentration increased rapidly over several orders of magnitude with rising discharge, whereas dissolved concentrations were more stable through time, and generally decreased due to dilution during peak discharge. The dissolved organic matter leached from the soil through rainwater can potentially influence TDS in the stream. Heavy rainfall triggers both stream discharge and landslides, which finally contribute to higher bedload transport.
Our results allowed meaningful comparisons to be made between the two forested catchments and the results show that the monsoon plays an important role in their hydrological functioning. Such types of investigation will support decision making and design of the mechanical and engineering structures required for catchment management in the Himalayan region. Further, the outcomes of this study will also be useful in understanding the geographical conditions and hydrological behaviour (discharge and sediment flux) of the basin in the context of setting up small hydropower plants in the region. The study will also act as a valuable reference for hydropower station management and governmental oversight.
Acknowledgements
This work was part of the PhD thesis research undertaken by Nuzhat-Ul-Qayoom Qazi at FRI Deemed University, Dehradun, India. The authors are indebted to many individuals, including Dr R.K. Tiwari (Department of Forests, Jammu & Kashmir), Professor L. Adrian Bruijnzeel (Department of Geography, King’s College London), Mr M.P. Singh (Climate Change & Forest Influence Division, Forest Research Institute, Dehradun), Mr Tarachand and Mrs Sunita (field assistants) and Mrs Bharti Bandari (computer operator, Forest Research Institute, Dehradun).
Disclosure statement
No potential conflict of interest was reported by the authors.
Additional information
Funding
Notes
1 Data downloaded from the Aphrodite site: http://iridl.ldeo.Columbia.edu/SOURCES/.RIHN/. aphrodite/.V1003R1/.APHROME025eg/.precip/.
References
- Andermann, C., et al., 2012a. Connecting source and transport: suspended sediments in the Nepal Himalayas. Earth and Planetary Science Letters, 351–352, 158–170. doi:10.1016/j.epsl.2012.06.059
- Andermann, C., et al., 2012b. Impact of transient groundwater storage on the discharge of Himalayan rivers. Nature Geoscience, 5 (2), 127–132. doi:10.1038/ngeo1356
- Andrade, T.M.B., et al., 2011. Dynamics of dissolved forms of carbon and inorganic nitrogen in small watersheds of the coastal Atlantic forest in Southeast Brazil. Water, Air and Soil Pollution, 214, 393–408. doi:10.1007/s11270-010-0431-z
- BBMB (Bhakra Beas Management Board), 1997. Sedimentation Survey Report. Nangal, India: BBMB, Bhakra Dam Circle.
- Burtin, A., et al., 2008. Spectral analysis of seismic noise induced by rivers: A new tool to monitor spatiotemporal changes in stream hydrodynamics. Journal of Geophysical. Research, 113, B05301. doi:10.1029/2007JB005034
- Calmels, D., et al., 2011. Contribution of deep groundwater to the weathering budget in a rapidly eroding mountain belt, Taiwan. Earth and Planetary Science Letters, 303, 48–58. doi:10.1016/j.epsl.2010.12.032
- Chakrapani, G. and Saini, R.K., 2009. Temporal and spatial variations in water discharge and sediment load in the Alaknanda and Bhagirathi Rivers in Himalaya, India. Journal of Asian Earth Sciences, 35 (6), 545–553. doi:10.1016/j.jseaes.2009.04.002
- Chauhan, P., et al., 2017. Differential behaviour of a Lesser Himalayan watershed in extreme rainfall regimes. Journal of Earth System Science, 126, 22. doi:10.1007/s12040-017-0796-0
- Costa, E.N.D., et al., 2017. Influence of hydrological pathways on dissolved organic carbon fluxes in tropical streams. Ecology and Evolution, Ecology and Evolution, 7, 228–239. doi:10.1002/ece3.2543
- Cox, C.A., Sarangi, A., and Madramootoo, C.A., 2006. Effect of land management on runoff and soil losses from two small watersheds in St. Lucia. Land Degradation and Development, 17, 55–72. doi:10.1002/ldr.694
- Creed, I.F., et al., 2013. Topographically regulated traps of dissolved organic carbon create hotspots of soil carbon dioxide efflux in forests. Biogeochemistry, 112, 149–164. doi:10.1007/s10533-012-9713-4
- Datta, P.S. and Kirchner, S.H., 2010. Erosion relevant topographical parameters derived from different DEMs-a comparative study from the Indian lesser Himalayas. Remote Sensing, 2 (8), 1941–1961. doi:10.3390/rs2081941
- Datta, P.S., Schack-Kirchner, H., and Hildebrand, E., 2014. Parametrization of soil erodibility in a lesser Himalayan watershed using pedotransfer functions and mixed effects modeling. In: D. Arrouays, N. McKenzie, and J. Hempel, eds. Global soil map: basis of the global spatial soil information system. London: Taylor & Francis Group, 245–251.
- Dongol, B.S., et al., 2005. Shallow groundwater in a middle mountain catchment of Nepal: quantity and quality issues. Environmental Geology, 49 (2), 219–229. doi:10.1007/s00254-005-0064-5
- Donohue, I. and Molinos, J.G., 2009. Impacts of increased sediment loads on the ecology of lakes. Biological Reviews, Cambridge Philosophical Society, 1–15. doi:10.1111/j.1469-185X.2009.00081
- Forbes, K. and Broadhead, J., 2011. Forests and landslides: the role of forests and forestry in the prevention of landslides and rehabilitation of landslide-affected areas in Asia. Bangkok: FAO.
- FSI (Forest Survey of India), 2013. India state of forest report. Dehradun: Forest Survey of India (Ministry of Environment and Forest), 11–32.
- Fuller, C.W., et al., 2003. Erosion rates for Taiwan Mountain Basins: new determinations from suspended sediment records and a stochastic model of their temporal variation. Journal of Geology, 111 (1), 71–87. doi:10.1086/344665
- Galy, A. and France-Lanord, C., 2001. Higher erosion rates in the Himalaya: geochemical constraints on riverine fluxes. Geology, 29 (1), 23. doi:10.1130/0091-7613
- Gera, M., et al., 2010. A systems approach for analyzing vegetative and soil degradation in arnigad micro-watershed of Indian Himalayan region. Journal of Mountain Science, 7, 315–326. doi:10.1007/s11629-010-1009-3
- Gergel, S.E., Turner, M.G., and Kratz, T.K., 1999. Dissolved organic carbon as an indicator of the scale of watershed influence on lakes and rivers. Ecological Applications, 9, 1377–1390. doi:10.1890/1051-0761(1999)009[1377:DOCAAI]2.0.CO;2
- Grauso, S., et al., 2008. Estimating the suspended sediment yield in a river network by means of geomorphic parameters and regression relationships. Hydrology and Earth System Sciences, 12, 177–191. doi:10.5194/hess-12-177-2008
- Gregory, K.J. and Walling, D.E., 1973. Drainage basin form and process: a geomorphological approach. London: Edward Arnold Ltd.
- Hanner, P., 2006. A report on “Soils and soil properties under different ecotypes in a study area of the Lesser Himalayas (India)”. Wageningen, The Netherlands: Alterra.
- Hedrick, L.B., et al., 2013. Sedimentation in mountain streams: A review of methods of measurement. Natural Resources, 4, 92–104. doi:10.4236/nr.2013.41011
- Heede, B.H., 1991. Influence of forest density on bedload movement in a small mountain stream. Hydrology and Water Resources in Arizona and the Southwest, 7, 103–107.
- Hessel, R., et al., 2007a. Application of the LISEM soil erosion model to a forested catchment in the Indian Himalayas. International Journal of Ecology and Environmental Sciences, 33, 129–142.
- Hessel, R., et al., 2007b. Rainfall, soil moisture content and runoff in a small catchment in the Indian himalayas. International Journal of Ecology and Environmental Sciences, 33 (2–3), 115–128.
- IAEA (International Atomic Energy Agency), 2005. Fluvial sediment transport: analytical techniques for measuring sediment load. IAEA-TECDOC-1461, ISBN 92-0-107605-3, ISSN 1011-4289. Vienna, Austria: IAEA.
- IMD (Indian Meteorological Department), 2009. Annual Report 2009. Indian Meteorological Department. New Delhi, India: Ministry of Earth Sciences, Govt. of India, Mausam Bhawan.
- Iwuoha, P.O., et al., 2016. Sediment source and transport in river channels: implications for river structures. The International Journal of Engineering and Science, 5 (5), 19–26.
- Jain, S.K., et al., 2003. Estimation of sediment yield for a rain, snow and glacier fed river in the Western Himalayan region. Water Resources Management, 17 (5), 377–393. doi:10.1023/A:1025804419958
- Jain, S.K., Kumar, S., and Varghese, J., 2001. Estimation of soil erosion for Himalayan watershed using GSI technique. Water Resources Management, 15, 41–54. doi:10.1023/A:1012246029263
- Korup, O. and Weidinger, J.T., 2011. Rock type, precipitation, and the steepness of Himalayan threshold hillslopes. Geological Society, London, Special Publications, 353 (1), 235–249. doi:10.1144/SP353.12
- Lupker, M., et al., 2012. 10Be-derived Himalayan denudation rates and sediment budgets in the Ganga basin. Earth Planetary Science Letters, 333–334, 146–156. doi:10.1016/j.epsl.2012.04.020
- Mahmoudzadeh, A., 2007. Vegetation cover plays the most important role in soil erosion control. Pakistan Journal of Biological Science, 10 (3), 388–392.
- Markewitz, D., Davidson, E., and Moutinho, P., 2004. Nutrient loss and redistribution after clearing on a highly weathered soil in Amazonia. Ecological Applications, 14, 77–99. doi:10.1890/01-6016
- Merz, J., et al., 2006a. Rainfall amount and intensity in a rural catchment of Nepal’s middle mountains. Hydrological Sciences Journal, 51 (1), 127–143. doi:10.1623/hysj.51.1.127
- Merz, J., et al., 2006b. Rainfall-runoff events in a middle mountain catchment of Nepal. Journal of Hydrology, 331, 446–458. doi:10.1016/j.jhydrol.2006.05.030
- Michalzik, B. and Matzner, E., 1999. Dynamics of dissolved organic nitrogen and carbon in a Central European Norway spruce ecosystem. European Journal of Soil Science, 50, 579–590. doi:10.1046/j.1365-2389.1999.00267.x
- Mukherjee, D., 2013. Critical analysis of challenges of Darjeeling Himalaya: water, natural recourses, hazards and the implication of climate change. International Journal of Agriculture Innovations and Research, 2, 2319–1473.
- Nepal, S., Flugel, W.-A., and Shrestha, A.B., 2014. Upstream-downstream linkages of hydrological processes in the Himalayan region. Ecological Processes, 3, 19. doi:10.1186/s13717-014-0019-4
- Qazi, N., et al., 2017. Impact of forest degradation on streamflow regime and runoff response to rainfall in the Garhwal Himalaya, Northwest India. Hydrological Sciences Journal, 2150–3435. doi:10.1080/02626667.2017.1308637
- Qazi, N., et al., 2012. Infiltration modelling for forested micro-watersheds in Mussoorie region of lower Himalayas. In: S. Kumar, et al., eds. Proceedings National Symposium on Water Resources Management in Changing Environment, 8–9 February 2012 Roorkee, India. Roorkee, Indian Association of Hydrologists, 101–110.
- Quails, R.G. and Haines, B.L., 1992. Biodegradability of dissolved organic matter in forest throughfall, soil-solution, and stream water. Soil Science Society of America Journal, 56, 578–586. doi:10.2136/sssaj1992.03615995005600020038x
- Rawat, J.S., 2010. Data base management system for Khulgad watershed, Kumaun Lesser Himalaya, Uttarakhand, India. Current Science, 98 (10), 1340–1348.
- Rawat, M.S., 2011. Environmental geomorphology and watershed management. New delhi: Concept Publishing Company Pvt. Ltd., 279.
- Schroth, A.G., et al., 2001. Nutrient fluxes in rainfall, throughfall and stemflow tree‐based land use systems and spontaneous tree vegetation of central Amazonia. Agriculture, Ecosystems and Environment, 87, 37–49. doi:10.1016/S0167-8809(00)00294-2
- Sharma, S.D., et al., 2006. Influence of land cover on soil properties in a watershed in lesser Himalayas. Annals of Forestry, 14 (1), 16–34.
- Sharma, S.D., Sitaula, B., and Singh, B.R, 2007a. Soil properties and quality index in relation to land cover in arnigad watershed of Garhwal Himalayas, India. International Journal of Ecology and Environmental Sciences, 33 (2–3), 159–169.
- Sharma, E., et al., 2007b. Land use change and its impact on hydro-ecological linkages in Himalayan watersheds. Tropical Ecology, 48 (2), 151–161.
- Singh, O., et al., 2008. Spatial and temporal variability of sediment and dissolved loads from two alpine watersheds of the Lesser Himalayas. Catena, 76 (1), 27–35. doi:10.1016/j.catena.2008.08.003
- Singh, O., 2011. Rainfall, runoff and sediment transport from a forested Lesser Himalayan watershed in Himachal Pradesh. Journal of Indian Geophysical Union, 15 (4), 207–220.
- Singh, V., Jain, S.K., and Shukla, S., 2010. Response of hydrological factors and relationships between runoff and sediment yield in the Sub Basin of Satluj River, Western Himalaya, India. International Journal of Civil and Structural Engineering, 2, 1.
- Struck, M., et al., 2015. Monsoonal hillslope processes determine grain size-specific suspended sediment fluxes in a trans-Himalayan river. Geophysical Research Letters, 2302–2308. doi:10.1002/2015GL063360
- Sudhishri, S., et al., 2014. Erosion Tolerance Index under different land use units for sustainable resource conservation in a Himalayan watershed using remote sensing and geographic information system (GIS). African Journal of Agricultural Research, 9 (41), 3098–3110. doi:10.5897/AJAR2013.7933
- Tipper, E.T., et al., 2006. The short term climatic sensitivity of carbonate and silicate weathering fluxes: insight from seasonal variations in river chemistry. Geochimica et Cosmochimica Acta, 70, 2737–2754. doi:10.1016/j.gca.2006.03.005
- Tyagi, J.V., et al., 2013. Analysis of soil moisture variation by forest cover structure in lower western Himalayas, India. Journal of Forestry Research. 24 (2), 317–324. doi:10.1007/s11676-013-0355-8
- Tyagi, J.V., et al., 2014. Assessment of discharge and sediment transport from different forest cover types in lower Himalaya using Soil and Water Assessment Tool (SWAT). International Journal of Water Resources and Environmental Engineering, 6 (1), 49–66. doi:10.5897/IJWREE2013.0448
- Wasson, R.J., 2003. A sediment budget for the Ganga–brahmaputra catchment. Current Science, 84 (8), 1041–1047.
- Wulf, H., Bookhagen, B., and Scherler, D., 2010. Seasonal precipitation gradients and their impact on fluvial sediment flux in the Northwest Himalaya. Geomorphology, 118, 13–21. doi:10.1016/j.geomorph.2009.12.003
- Wulf, H., Bookhagen, B., and Scherler, D., 2012. Climatic and geologic controls on suspended sediment flux in the Sutlej River Valley, western Himalaya. Hydrology and Earth System Sciences, 16, 2193–2217. doi:10.5194/hess-16-2193
- Xiaoping, Y., 2003. Manual of sediment management and measurement. Geneva, Switzerland: Secretariat of World Meteorological Organization, WMO Operational Hydrology Report no. 47.
- Yadav, R. and Ram, S., 2014. Landslides and its remedial measures in Mussoorie hilly sections. International Journal for Scientific Research & Development, 2 (10), 2321–2613.
- Zokaib, S. and Naser, G.H., 2011. Impacts of land uses on runoff and soil erosion: A case study in Hilkot watershed Pakistan. International Journal of Sediment Research, 26 (3), 343–352. doi:10.1016/S1001-6279(11)60098-X
- Zuazo, V.H.D. and Pleguezuelo, C.R.R., 2008. Soil-erosion and runoff prevention by plant covers. A review. Agronomy for Sustainable Development, 28, 65–86. doi:10.1051/agro:2007062