
ABSTRACT
The spatial and temporal variation of moisture distribution, overall water balance and quantity of infiltrated water in the vadose zone of the Sidi Bouzid Plain (Tunisia) during successive flooding events is quantified in this study. The variation in water content in response to environmental factors such as evaporation and water root uptake is also highlighted. One-dimensional flow simulations in the deep vadose zone were conducted at three spreading perimeters located near Wadi El Fekka. The hydraulic boundary conditions of a time-dependent water blade applied to the soil surface were determined from measured flood hydrographs. For the chosen wet year, the successive flooding events contributed to a significant artificial recharge of the natural groundwater. Although the soil hydraulic parameters did not vary strongly in space, flow simulations showed significant differences in the overall water balance of approximately 9–16% for the various spreading perimeters.
Editor R. Woods Associate editor A. Fiori
1 Introduction
Groundwater is a life-sustaining resource that provides water to billions of people (Gleeson et al. Citation2012). In semi-arid regions, where surface waters are scarce or absent, groundwater is the only water supply source for human activities and, mostly, for crop irrigation (Giordano Citation2009, Gleeson et al. Citation2010, Wada et al. Citation2010, Shang et al. Citation2016). With population growth and economic development, the disparity between the supply and demand for water resources is becoming increasingly serious, and people are exploiting aquifer areas to meet local water demands (Jun and Chen Citation2001; Sha et al. Citation2003, Jun and Yongyong Citation2008). Deepening of the water table and the continuous depletion of groundwater reserves are the main consequences of such intensive exploitation (Gleeson et al. Citation2010, Custodio et al. Citation2016). Thus, understanding the distribution of regional groundwater recharge is extremely important for more sustainable management of these vulnerable aquifers (Scanlon et al. Citation2006).
Groundwater recharge is the process whereby surface water reaches the water table in the phreatic zone of an aquifer (Martínez-Santos and Andreu Citation2010). Estimating groundwater recharge is one of the challenging tasks in the field of hydrology, as it depends on a wide range of factors such as rainfall, evapotranspiration, thickness of the vadose zone, topography and root water uptake. Groundwater recharge is generally quantified using water balance modelling (Jackson Citation2002), the computation of flow rate in the unsaturated zone using Darcy’s law (Butterworth et al. Citation1999, Healy and Cook Citation2002), tracer techniques (Leaney and Herczeg Citation1995, Marei et al. Citation2010), unsaturated flow modelling, in which the Richards equation is solved numerically (Botors et al. Citation2012, Kim and Jackson Citation2012, Turkeltaub et al. Citation2014) or groundwater inverse modelling (Poeter and Hill Citation1997, Flint et al. Citation2002, Sonnenborg et al. Citation2003, Dahan et al. Citation2004, Hendricks et al. Citation2009, Karlsen et al. Citation2012). However, each method has its own limitations considering the available data, space and time scales, and the range and reliability of recharge estimates (Zhu Citation2000). The inverse modelling approach may be a good tool for total recharge evaluation, but it does not help in identifying the contribution of each particular source to the total recharge (Vázquez-Suñé et al. Citation2010).
Vertical water flux is the key hydrological process that connects precipitation and groundwater. In semi-arid regions, it is influenced not only by the characteristics of the vadose zone (Nimmo et al. Citation2002, Lu and Jin Citation2007, Mattern and Vanclooster Citation2010, Lu et al. Citation2011, Kong et al. Citation2015) but also by root water uptake (Vrugt et al. Citation2001, Hupet et al. Citation2003) and high water evaporation rates at the soil surface. As a buffer zone between the land surface and the water table below, the unsaturated zone is a controlling segment of the aquifer in the transmission of aquifer-recharging water. The soil lithology, soil texture and particularly the depth of water table play critical roles in groundwater recharge (Zhang et al. Citation2007, Huo et al. Citation2014, Min et al. Citation2015). In the North China Plain, Cao et al. (Citation2016) evaluated the spatiotemporal variability of recharge in response to the thickness of the unsaturated zone by linking a soil water balance model. The model results indicated the effects of unsaturated zone thickening on both the temporal distribution and magnitude of recharge. The thickening of the unsaturated zone can result in an average recharge reduction of up to 70% in loam soils, with water table declines higher than 30 m. However, the study of Ounaïes et al. (Citation2013), conducted in the Upper Rhine Valley, showed that in the case of shallow alluvial aquifers with highly permeable sediments, the annual recharge of the groundwater due to floodwater infiltration may be up to three times higher than rainfall. They quantified vertical water fluxes in the unsaturated zone as a function of soil heterogeneities during a 5-day-long flooding event using three approaches of estimating soil hydraulic parameters.
Water uptake by root systems and their spatial distribution may exert a large impact on water fluxes to the atmosphere and groundwater (Canadell et al. Citation1996) and has a strong effect on the soil water balance (Camargo and Kemanian Citation2016). Numerous approaches for modelling root water uptake have been suggested, differing in spatial dimensionality and complexity of the sink term description (Javaux et al. Citation2013, Peters Citation2016). In the vadose zone, though transient soil water is often simulated in one, two and three spatial dimensions, root water uptake is generally considered to be simply a function of the vertical dimension only (Vrugt et al. Citation2001). Such simplified models for root water uptake combined with the Richards equation, as described in Raats (Citation1974), Feddes et al. (Citation1978) or Šimůnek and Hopmans (Citation2009), have been tested in various practical cases. As they can easily be implemented in existing numerical tools via an open user-defined interface, the root water uptake model developed by Raats (Citation1974) is used in our study.
The Sidi Bouzid Plain, located in central Tunisia, is a typical example of a semi-arid climate region. Precipitation occurs irregularly and briefly, with high-intensity events causing strong floods, mainly in Wadi El Fekka. The resulting surface runoffs are generally lost via evaporation and cannot contribute to groundwater recharge. Therefore, to favour groundwater recharge, different gabion structures, constructed across the wadi with channels that collect and then discharge parts of the runoff into nearby fields (Genin et al. Citation2006), were realized in the upstream bed of the main watercourse of Wadi El Fekka. The role of wadi floods in arid zones on groundwater recharge has been tested and observed in various regions worldwide (e.g. Izbicki Citation2002, Nazoumou Citation2002, Besbes et al. Citation2006, Dahan et al. Citation2007).
Several previous modelling studies have been conducted focusing on artificial groundwater recharge on the Sidi Bouzid Plain (Lafforgue Bouzaine Citation1981, Bouraoui Citation1984, Amouri Citation1994, Simonot Citation1996). However, the impact of floodwater spreading remains largely unknown because of the climate aridity and the lack of quantitative data regarding effective infiltration rates at the water table of the aquifer and pumping rates applied to the groundwater. Furthermore, the water balance of the deep vadose zone is less understood. Most of the previous studies only used surface hydrological models to describe percolation beneath the wadi and propagation of the wetting front towards the water table in the aquifer. Thus, the dynamic process of groundwater recharge across the deep vadose zone could not be studied as a function of the hydraulic parameters of soil in this zone.
This study aims to quantify vertical water flux and the water volume infiltrated in the unsaturated zone during flooding events in the Sidi Bouzid Plain. One-dimensional numerical studies are conducted at three study areas based on measured soil profiles. The measured flood hydrographs are used to derive the hydraulic boundary conditions, such as the time-dependent water blade and water uptake by evaporation, at the soil surface of the spreading perimeters. The main objective is to quantify the travel time of floodwater through the unsaturated zone and the time required to return to the initial state of soil water pressure equilibrium. This study is essential for implementing a future three-dimensional (3D) unsaturated–saturated flow model of the entire area of the Sidi Bouzid Plain to quantify the groundwater recharge at the regional scale. Indeed, analysing differences in the quantity of infiltrated locations is useful to later consider the spatial soil heterogeneities at the Sidi Bouzid Plain. Particular attention is paid to assessing the influence of plant root systems on the moisture distribution, the water flux and the total infiltrated water volume.
2 Materials and methods
2.1 Study area
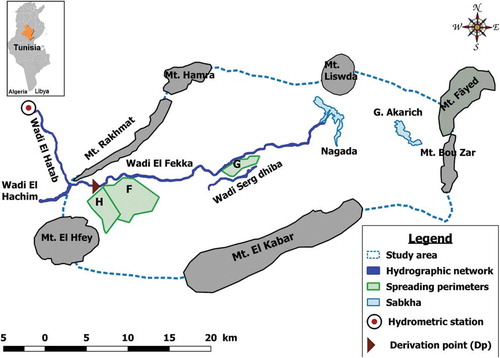
The Sidi Bouzid Plain is one of the main synclinal basins of central Tunisia, whose main outcrops are formed by Upper Cretaceous deposits (Zouaghi Citation2008). It is bordered by the mountains of Hamra and Rakhmat to the northwest, El Hfey to the southwest, El Kabar to the south, Fâyed and Bou Zar to the east and Liswda to the northeast (Fig. 1).
The aquifer system of the Sidi Bouzid Plain is an 800-m Mio-Plio-Quaternary system. The sedimentary series consists of deposits going from the Lower Cretaceous to Quaternary, affected by important tectonic features occasionally associated with salt Triassic activities. The aquifer is essentially composed of sand (with varying grain sizes), inter-bedded with layers of clay and sandy clay as well as gravels, pebbles and gypsum. The aquifer system may be considered a single multilayer aquifer, represented by three major lithologic sections: (i) 0–100 m (clay and sand), (ii) 100–400 m (sand and clayey sand), and (iii) 400–800 m (clay and sandy clay) (Koschel Citation1980, Bouraoui Citation1984, Amouri Citation1994, Simonot Citation1996).
The Sidi Bouzid Plain is characterized by a low and irregular rainfall of approximately 276 mm/year and an intense annual potential evaporation rate estimated to be 1600 mm. The Sidi Bouzid Plain is a typical example of a semi-arid climate region where groundwater resources are intensively exploited for human needs due to agricultural and demographic development. In 2015, the renewable water resources in the region were estimated at 19.5 Mm3 per year, with annual exploitation in the order of 30.7 Mm3 (DGRE Citation2015), which equalled an overexploitation rate of 157%.
In the study area, Wadi El Fekka constitutes the main watercourse. It crosses the plain from west to east, to then discharge into the large evaporation area of Sebkha Nagada in the northeast. The supply of surface water on the Sidi Bouzid Plain results mainly from floods of Wadi El Hatab, with an average of the order of 36.3 Mm3/year.
2.2 Spreading perimeters
To control the flow rate of surface waters, different spreading perimeters were constructed between 1983 and 1994 on both banks of the main watercourse of the Sidi Bouzid Plain. The objective of these structures was to apply an artificial spreading of Wadi El Fekka floodwaters, primarily for irrigation purposes and for an artificial recharge of the groundwater. Our study focuses on three spreading perimeters: El Hachim (H) and El Fekka (F) are located at the upstream of the wadi, while Guedera (G) is downstream (). Each perimeter was assigned to three soil profiles receiving floodwater and a control plot. These soil profiles, where grain-size distribution analysis has been performed, are situated 10, 200 and 400 m away from the distribution point of floodwater to the spreading perimeter.
Figure 1. Location of the study area. Mt.: mountain; H: Hachim; F: Fekka; G: Guedera.
The flow rate at the Hachim and Fekka spreading perimeters, Qsp, was determined from the calculated streamflow rate, QSF, at the distribution point derived from the observed flow rate, QHS, at the hydrometric station Khanguet Zazia, located on Wadi El Hatab (). Note that the flow rate coming from Wadi El Hachim was neglected in our approach, as this is very low compared to that of Wadi El Hatab.
2.3 Numerical flow model of the vadose zone
2.3.1 Governing flow equation
To address the characteristics of the study site of Sidi Bouzid, the commercial finite element model FEFLOW 5.3 (Diersch Citation2005) was used. The one-dimensional (1D) vertical water flow in variably saturated porous media, including the effects of specific storage, is given by the Richards equation, which is a combination of Darcy’s law and the mass conservation equation (Diersch and Kolditz Citation1998):
where S0 [L−1] is the specific storage due to fluid and medium compressibility, [L] is the pressure head, S [-] is the water saturation, ε [-] is the porosity,
[L T−1] is the relative hydraulic conductivity, K [L T−1] is the tensor of hydraulic conductivity for the saturated medium,
[L] is the elevation above a reference datum, and
[T−1] is the sink or source term.
The sink or source term reflects the local increase or decrease of water content according to the inflows or outflows of water to the modelled domain, respectively. In our study, Q = −(Qup + Qevap), where Qup and Qevap denote the root water uptake rate and evaporation rate, respectively. The root water uptake rate was taken into account via the user-specified interface of FEFLOW (Section 2.3.2). The water uptake by evaporation was modelled by a second-order (flux) boundary condition at the soil surface (Section 2.5.3.2).
The governing flow equation was solved by applying the prescribed water heads at the top and bottom of the soil profiles. For each of the 12 soil profiles, the elevation datum of the water table was the reference datum (z = 0 m). The hydraulic head was set to zero as an initial condition for the entire column. The relative hydraulic conductivity and water content were calculated at each finite element based on the constitutive relationships given for each soil horizon.
The standard van Genuchten (Citation1980) model was used to describe the capillary pressure–saturation relationship as follows:
where [L] is the capillary pressure head knowing that
=
and
,
[L−1] is a van Genuchten curve-fitting parameter (
); n [-] is the pore-size distribution index, which is a van Genuchten curve-fitting exponent reflecting the uniformity of the pore-size distribution with n > 1, and Se [-] is the effective water saturation defined as follows:
where [-] is the residual water saturation,
[-] is the volumetric moisture content, and
and
[-] are the residual and saturated volumetric water contents, respectively.
The Mualem model (1976) was used for the relative hydraulic conductivity relationship as follows:
2.3.2 Root water uptake model
The 1D root water uptake model proposed by Vrugt et al. (Citation2001) was used. It is based on the exponential model by Raats (Citation1974) as follows:
where denotes the dimensionless spatial root distribution with depth
,
[L] is the maximum rooting depth, and a [-] and b [L] are empirical parameters.
The normalized root water uptake [T−1], expressing the volume of water extracted per unit volume of soil with time, is then quantified by the following:
where [L T−1] is the potential transpiration:
where Kc [-] is the crop coefficient, [L T−1] is the reference evapotranspiration, and
[L T−1] denotes soil evaporation.
To model root water uptake under water-stressed conditions, a soil water stress response function was included (van Genuchten Citation1987):
where [L] is the soil water pressure head at spatial location
,
[L] is the soil water pressure head at which root water uptake rate is reduced by 50%, and c [-] is a fitting parameter. The parameter c is usually assumed to be 3 (van Genuchten and Gupta Citation1993).
Finally, based on Equations (6) and (8), the root water uptake rate at any particular vertical location can be calculated as follows:
where [T−1] is the actual water uptake at different depths
.
2.4 Spatial moment analysis
Spatial moments allow a simple, physically meaningful description of overall plume behaviour, and moments can be predicted with less uncertainty than in state-variable models. The moisture plume can be characterized by its zeroth, first and second moments in the principal direction of flow (Gee and Ward Citation2001). The zeroth moment M0 is related to the total volume applied to the domain. The first moment M1 leads to the vertical location of the centre of the plume, and the second moment represents the amount of spreading around the mean position of the plume.
The 1D spatial moments for a moisture plume distribution M can be defined from the 3D spatial moments given by (Yeh et al. Citation2005):
where θdiff (z,t) = θ(z,t) – θinit(z,0) is the spatial distribution of the water content variation at time t and at an elevation compared to the initial water content θinit(z,0). The zeroth, first and second spatial moments correspond to i = 0, 1 and 2, respectively.
The centre of mass of the moisture plume is located at zc [L], given by:
The spreading of the moisture plume around its centre is described by the spatial variance in the z-direction σz2 [L2] as follows:
2.5 Numerical case studies
2.5.1 Spatial and temporal discretization
To estimate the spatial and temporal variation of vertical water fluxes within the vadose zone of the Sidi Bouzid aquifer, a partially saturated 1D finite-element flow model was set up using FEFLOW. Twelve columns of porous media with a transverse section of 1 × 0.01 m2 were modelled to represent the characteristics of the different sampling locations.
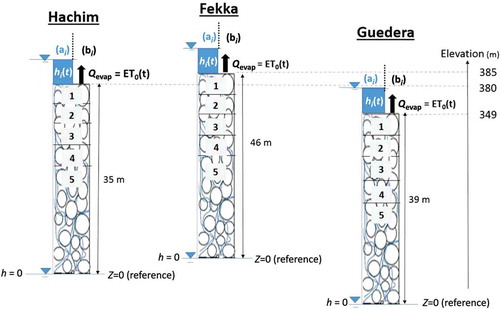
The modelled soil columns were vertically discretized with a spacing of 0.01 m. The overall thickness of the modelled vadose zone is specific to each perimeter (El Hachim: 35 m, El Fekka: 46 m, and Guedera: 39 m), as the elevation of the soil surface and the water table depend on their location within the study site (Fig. 3).
For all sampling locations, the vertical soil heterogeneity was modelled with five layers representing the soil horizons. The last Layer 5 of each profile has the same characteristics as Layer 4.
A self-adjusting numerical time-stepping scheme, with a minimum and maximum time step of 10–8 days and 0.1 days, respectively, was used during the simulations. The relative fine spatial discretization and the self-adjusting numerical time-stepping scheme should ensure the numerical convergence and water balance (tolerance error = 1E-06) during simulations in this study. The simulation covered a 365-day period (1 September 2013 to 31 August 2014). The date 13 September was used for known (initial) soil moisture throughout all numerical simulations.
The initial conditions of the flow model were based on the hydrostatic conditions of the soil water profile. As the pressure head was chosen as a primary variable, hydraulic heads h (h = Ψ + z) at time t = 0 d were defined to be zero throughout the column of porous medium, with z as the elevation above the reference datum of the soil profile-specific water table (see ). Boundary conditions of the soil columns are discussed in Section 2.5.3.
Figure 2. Flood hydrograph measured at the Khanguet Zazia hydrometric station during hydrological year 2013/14, and the schematic representation of the water distribution between floodwater and irrigation water on the El Hachim (H) and El Fekka (F) spreading perimeters.
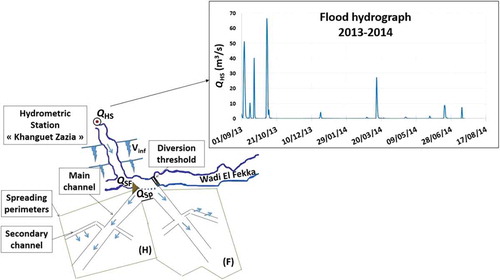
Figure 3. Characteristics of the three sampling locations, and temporal variation in the upper boundary conditions at the soil surface: (a) the prescribed head boundary (h(t)) during flooding periods, and (b) the prescribed flux boundary (Qevap(t)) during periods without flooding.
2.5.2 Estimation of soil parameters
The hydrodynamic properties of each model layer were built using the soil parameters given in . To determine these soil parameters, a grain-size distribution method based on a neural network was used. This method involves the particle-size distribution of soil samples taken at the study site. The soil profiles were analysed to obtain the weight percentages of sand, silt and clay for each sampling point. The code used was the neural network theory available in the Rosetta program used in the Hydrus tool (Schaap et al. Citation2001). The Rosetta program implements five hierarchical pedotransfer functions for the estimation of water retention, as well as the saturated and unsaturated hydraulic conductivities. The hierarchy in these functions permits the estimation of van Genuchten water retention parameters, residual water content, saturated water content and the saturated hydraulic conductivity (see ). also contains the average values of and K, which are arithmetic averages in the case of
, whereas harmonic values are used for K.
Table 1. Soil parameters obtained with neural network theory based on the particle-size distribution of the soil layers at the Hachim (H), Guedera (G) and Fekka (F) spreading perimeters used in the numerical studies.
2.5.3 Boundary conditions
The boundary at the bottom of each porous medium was modelled with a prescribed head boundary (h = 0). It was set to zero at all times. The upper boundary was chosen as a type-variable boundary depending on the atmospheric data and the characteristics of the flood hydrograph (2013/14). It was implemented as either a prescribed head boundary or a prescribed water flux boundary (see ).
2.5.3.1 Prescribed head at upper boundary
The hydraulic head (hi) at the soil surface is calculated for each flooding event during a time period as constant head and at the end of the flooding event using a linear decreasing head as follows:
where Z [L] is the elevation above the reference datum of the soil profile-specific water table, i [-] is the flooding event number during the hydrological year, [L] is the corresponding water blade at spreading perimeters,
[T] is the infiltration time of the water blade after the end of flooding event i,
[L T−1] is the constant water infiltration flux of 0.63 m/d estimated using local in situ measurements performed in the sediments of perimeter Hachim (Zinsou Citation1998), and
[T] and
[T] are the times of beginning and ending of flooding event i, respectively. The value of
can be calculated by:
where [L3 T−1] is the flow rate at the Hachim and Fekka spreading perimeters,
[T] is the base time of the flooding event (
,
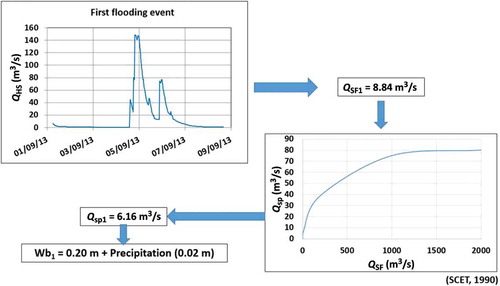
[L] is the water volume due to precipitation per square metre, and A [L] is the total area of the Hachim and Fekka spreading perimeters. The flow rate
was estimated by using the experimentally based relationship between flow rate at Wadi El Fekka,
, and flow rate at the derivation point,
(SCET Citation1990):
().
The flow rate is calculated at Wadi El Fekka by subtracting the infiltrated water volume
along Wadi El Hatab from the storm flow rate derived from each flood hydrograph event measured at the hydrometric station as follows:
where [L3 T−1] is the streamflow rate at Wadi El Fekka,
[L3] is the water volume of storm flow, and
[L3] is the infiltrated water along Wadi El Hatab.
Neglecting the evaporation and transpiration of water volume along the wadi, the infiltrated water volume can be estimated by (Coes and Pool Citation2005):
where is the base time of the flooding event,
[L] is the length of the wadi,
[L] is the wetted width of the wadi, and
[L T−1] is the constant water infiltration flux. The infiltration flux of 0.79 m/d was estimated using local in situ measurements performed in the sediments of Wadi El Hatab (Zinsou Citation1998).
The wetted width of Wadi El Hatab during the various flooding events was estimated using the modelling approach of Ezeddine and Besbes (1991):
where [L] is the maximum width of Wadi El Hatab (200 m), and
[L] is the adjustment constant, obtained from previous studies to be equal to 20 m (Zinsou Citation1998).
shows the methodology of calculating the water blade in the Hachim and Fekka spreading perimeters used for each flooding event. In our study, we assumed that the water blade in the downstream Guedera spreading perimeter is sensibly the same as those calculated at the Hachim and Fekka spreading perimeters.
Figure 4. Schematic procedure of estimating the water blade in the spreading perimeters: example of the first flooding event.
2.5.3.2 Prescribed water flux at upper boundary
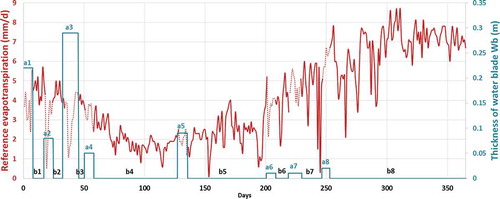
Daily reference evapotranspiration (ET0) data were determined by the software ET0 calculator tool developed by the Land and Water Division of the FAO. The ET0 calculator assesses ET0 from meteorological data by means of the FAO Penman-Monteith equation recommended in Allen et al. (Citation1998). These meteorological data were provided by the Institute of Meteorology for Sidi Bouzid. Water extraction due to evapotranspiration was incorporated in the numerical model as the Neumann condition after subtracting the height of precipitation during the considered time period. Prescribed water flux expressed as a sink term was only set between two consecutive flooding events (ai) (). It is presented as continuous lines during periods without water flooding (bi).
2.5.4 Root water uptake
To evaluate the impact of water extraction by roots on the water infiltration process, profile H1 of the El Hachim site has been chosen. In our numerical studies, we implemented the root water uptake given by Equation (9) in addition to the sink term due to evaporation applied at the soil surface. The obtained results are discussed in Section 3.5.
In our approach, a carrot crop was chosen to study the root extraction term because it is characterized by a high demand for water and it is an abundant crop in the Sidi Bouzid Plain. For the sink term, the root model requires estimates of the potential transpiration (Tpot) and soil evaporation (Es). Carrot potential (ETcarrot) was calculated from ET0 and the corresponding crop coefficient (Kc). The values of crop coefficients depend on different growing stages. The Kc of typical crops can be found in Allen et al. (Citation1998). The potential transpiration of the carrot crop (Tcarrot) was obtained by subtracting Es from ET0 × Kc (Equation (7)). presents the variation of Tpot as a function of the periods without flooding (bi), which were used in our numerical studies. Note that the growth of carrot crops is limited to periods b1, b2, b3, b4 and b5. The root water uptake for periods b6, b7 and b8 is set equal to zero.
Figure 5. Soil surface boundary conditions during the simulation period (time 0 corresponds to 1 September 2013).
The maximum root depth is known a priori to be equal to 0.75 m. The root water uptake model and the soil water stress response function described by Equations (5) and (8), respectively, contain three unknown parameters: a, b and
. Based on data from the literature, the corresponding parameter values were chosen as 1, 0.20 and −0.2 m, respectively.
3 Results and discussion
3.1 Variation of the wetting front and soil water pressure profile
The profiles of soil water content and soil water pressure in the vadose zone during wet and dry periods are illustrated in . Initially, at t = 0 d, the water content and the water pressure at the soil surface correspond to θinit and the hydrostatic pressure, respectively. Water infiltrates into the soil and migrates downward under the effect of both gravity and the gradient of capillary pressure. The initial water content increases gradually until reaching saturation at the level of the water table. The discontinuous distribution of water content observed in the first two metres is due to the textural heterogeneity of the four different soil layers. Following the arrival of the first flooding event from t = 0.25 d to t = 8.02 d, the soil reaches saturation at up to 4.1 m of depth. Hence, soil water pressure has positive values in this upper part of the soil. After the first flood event, the water moisture is redistributed within the soil: the water content decreases at the soil surface and reaches a minimum value of approximately 0.29 at 15 days. In addition, the wetting front, defined as the region with a sharp decrease in water content, continues to percolate and reaches a depth of 6.7 m. However, negative water pressure values reflect dry periods at the soil surface. Each flooding event contributes to increasing the relative hydraulic conductivity of the soil within the wetted zone and promoting the advancement of the wetting front. The response to the third flooding event at 40 d contributes to the complete water saturation near the soil surface and to the percolation of the wetting front up to a depth of 11.5 m. At 180 days, the wetting front has already reached the water table, and the water pressure is constant over the whole depth and close to zero.
The calculated water balance of the four soil profiles for each site is summarized in after 365 days. The total surface specified volume of infiltrated water, exfiltrated water (due to evaporation and groundwater recharge) as well as the stored water quantity significantly vary at the scale of each site. Comparing the average values of the three sites, one may conclude that the stored water volume per square metre varies from 4.16, 7.12 and 5.75 m3/m2 for the Hachim, Fekka and Guedera sites, respectively. For the Hachim site, 41% of the infiltrated water is still stored at the soil column after 365 days. This is clearly shown in , which shows that the water content profile at t = 365 d did not reach the initial water content profile. The calculated recharge of groundwater is discussed in Section 3.4.
Table 2. Water balance at t = 365 d for the four soil profiles at the Hachim, Fekka and Guedera sites.
Figure 6. Variation in potential transpiration of carrot crops with crop coefficients.
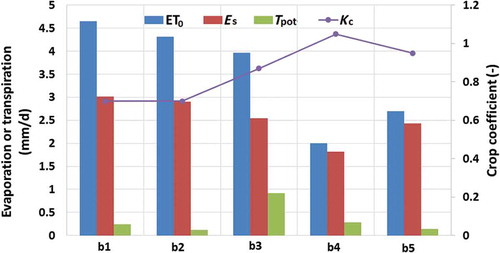
Figure 7. Calculated water content and water pressure profiles as a function of time and elevation at the soil profile H1 at the Hachim site.
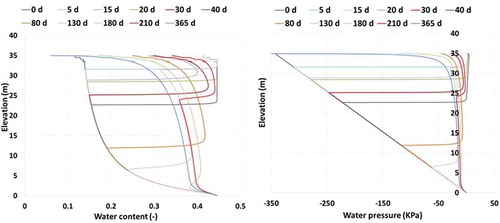
Figure 8. Calculated water content profiles considering evaporation at the soil surface compared to those calculated without evaporation of the first 5 m of soil profile H1 of the Hachim site.
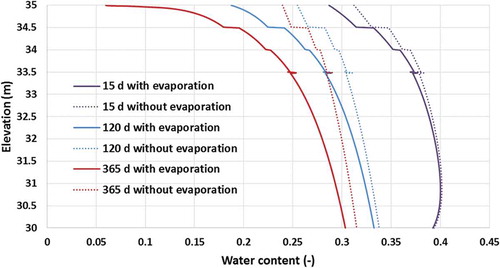
Figure 9. Calculated zeroth spatial moments M0 as functions of time for the H1, F1 and G1 soil profiles.
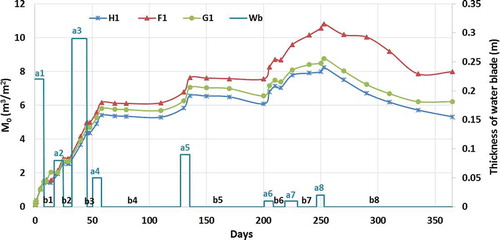
Figure 10. Calculated vertical locations of the centre of mass zc as functions of time for the (a) Hachim, (b) Fekka and (c) Guedera sites.
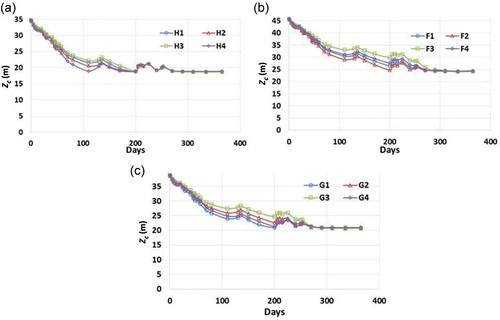
Figure 11. Differences in water content calculated at t = 80 d as functions of elevation for the four profiles of the Hachim site.
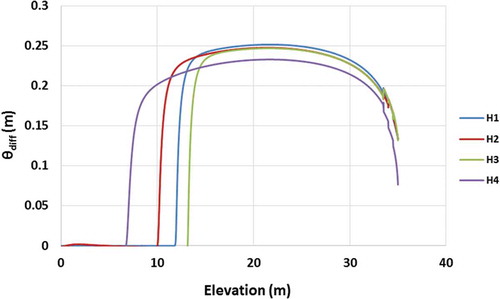
Figure 12. Standard deviation of moisture content for the (a) Hachim, (b) Fekka and (c) Guedera sites.
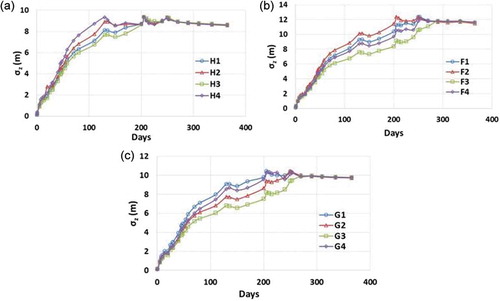
Figure 13. Water discharge at the water table for the (a) Hachim, (b) Fekka and (c) Guedera sites.
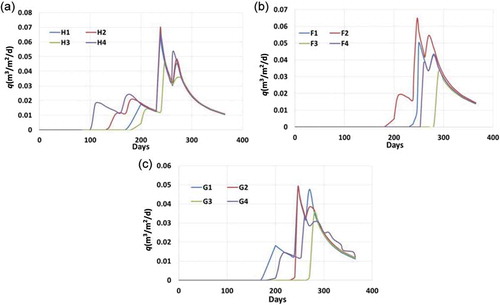
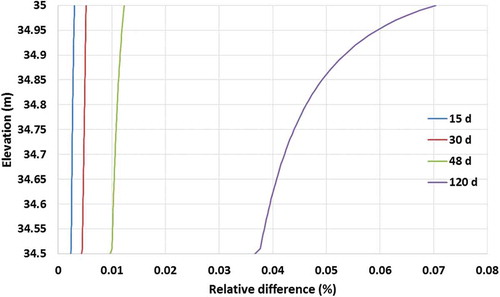
Figure 14. Relative difference of water content calculated under evaporation and root water uptake conditions (B) compared to that calculated under evaporation and without root water uptake conditions (A) of the first 5 m for profile H1 of the Hachim site.
3.2 Effect of evaporation at the soil surface
The variation of soil moisture under the combined influence of precipitation and evaporation is rather complex. shows the calculated distribution of soil water content during various periods of soil surface conditions, considering or not considering the evaporation at the soil surface at the three chosen times. Near the soil surface, soil moisture varies strongly due to the high evaporation rate. Note that the annual applied evapotranspiration rate was approximately 1300 mm during the hydrological year 2013/14. At t = 15 d, once the flooding event had stopped, soil water content changed slightly due to evaporation by no more than 0.02 in volumetric content. The effect of evaporation on soil moisture profile increases with time: at t = 120 d, the water content at the soil surface decreased from 0.25 to 0.18. However, at the end of the year, the calculated water content at the soil surface and at the depth of 5 m decreased by 75 and 3.5%, respectively. The applied evaporation rate at the soil surface results in a water content decrease in the topsoil and contributes to producing matric suction gradients that may induce significant upward water flow in the soil. The stored water volume per square metre calculated after 365 days decreased from 5.12 to 4.14 m3/m2 for soil profile H1 calculated without evaporation and taking evaporation into account, respectively. This difference is attributed to the applied evaporation at the soil surface. In fact, this evaporation strongly reduced the quantity of groundwater recharge. The calculated recharge near the water table decreased by 6% (see Section 3.4).
3.3 Spatial moments of soil moisture distribution
shows the calculated zeroth spatial moment M0 of the moisture content distribution at the H1, F1 and G1 soil profiles as functions of time. Following the arrival of the first flooding event, M0 increases rapidly. The infiltrated water rapidly enters the unsaturated zone and saturates the porous medium. After the fourth event (a4), M0 reaches a steady peak of approximately 6.17 m3/m2. Once the inundation event stops (b4), M0 continuously decreases due to the high rate of evaporation. Note that during period b4 the wetting front has not yet reached the water table and water has not left the soil profile across the lower boundary. Moment M0 has several sudden and abrupt increases, which can be attributed to high flood and rainfall events. However, it gradually reduces once water infiltration at the soil surface has stopped.
At soil profile F1, the calculated volumes of infiltrated water per unit surface area of the soil column are higher than those of H1 and G1. The lowest value of M0 is found at H1. It reaches a maximum peak of 8.49 m3/m2, whereas at soil profile F1, the highest value of M0 is approximately 10.81 m3/m2. These differences can be clearly attributed to the differences in hydraulic soil properties of the soil horizons near the soil surface, such as the hydraulic conductivity at saturation and the total length of the different porous columns. Note that the average value of the saturated hydraulic conductivity (K) of soil profile H1 is lower than that of F1 (see ).
The vertical location of the centre of mass of the moisture distribution (zc) for the four soil profiles of each site during the total hydrological year is presented in . As time progresses, the centre of mass is displaced from the soil surface to deeper zones of the soil profile. During the first flooding events, zc moves downwards quickly. After several hours, the displacement velocity becomes nearly constant. Beyond 250 days, after the last flood event, the location of the centre of mass reaches a steady state for all soil profiles of each site. It achieves an elevation of approximately 18.7, 24.3 and 20.8 m for the Hachim, Fekka and Guedera sites, respectively. The differences in final depth are principally due to the differences of retention capacities of the given soil profiles expressed by the van Genuchten parameters (, n) and residual water content of the various soils (see ). For example, at the Hachim site, as soil profile H3 has the highest retention capacity (
), zc is the shallowest. Conversely, profile H4 has the lowest retention capacity and therefore the centre of mass is located at the deepest zc.
After five days of simulation, the centre of mass of soil profile H3 is still at the first layer, which is at 0.5 m of depth. However, it reaches the second layer of soil profile H4. The rapid advance is, first, due to the estimated van Genuchten parameter, which is high at Layer 1 of soil profile H4 compared with that of soil profile H3. Second, it is the result of the highest value of saturated hydraulic conductivity, which is 1.4 times higher than that of Layer 1 of soil profile H3. Note that the first layer of soil profile H3 is characterized by fine texture, as it contains a silt percentage higher than 50%. Consequently, it has the highest retention capacity.
Beyond 5 days of simulation, the vertical location of the centre of mass of soil profile F4 exceeds that of soil profile F2 by approximately 0.3 m. This difference is due to the effect of soil texture. In fact, for the first two metres below the soil surface, the average percentage of clay decreases by 4.6% from soil profile F2 to that of F4.
At t = 80 d, the differences in water content θdiff calculated for the Hachim site at different elevations are shown in . The moisture content distributions calculated at that time show a significant difference among the four profiles. The vertical location of the centre of mass at that time is 23.28, 22.43, 23.83 and 20.98 m for H1, H2, H3 and H4, respectively. Additionally, the calculated zeroth moment of the moisture content decreased by 16% from H4 to H3. These differences are mainly caused by the hydraulic conductivities at water saturation varying from one soil profile to another. For example, the harmonic average of the estimated hydraulic conductivity for soil profile H3 is lower than that of soil profile H4. However, at the end of the hydrological year, the differences in the centre of mass are rather small: 18.68, 18.75, 18.65 and 18.89 m for H1, H2, H3 and H4, respectively.
The vertical spread of a moisture plume around its centre of mass is presented by the standard deviation σz. illustrates the temporal variation of the standard deviation for the four soil profiles of each site quantified for the total flow simulation time of 365 days. The spatial variance in the vertical direction increases with time, reaching a maximum value after the first three flooding events. After approximately 300 days, the standard deviation in the vertical direction reaches a constant value of approximately 8.50, 11.50 and 9.74 m for the Hachim, Fekka and Guedera sites, respectively. For all soil profiles of each site, the vertical locations of the centre of mass, as well as the standard deviations, are nearly the same. However, the water content stored in each profile is quite different at the end of flow simulation (see ). For example, at the Hachim site, the stored water volume varied approximately 21% between H3 and H4.
3.4 Quantification of groundwater recharge
The groundwater recharge rate near the water table was calculated by applying the fluid flux analyser of FEFLOW 5.3. presents the variation of the water discharge at the top of water table for the four soil profiles of each site. At the Hachim site, the first water particles arrive at the water table after 170, 135, 180 and 100 days for H1, H2, H3 and H4, respectively. These non-uniform, first arrival times are mainly caused by the hydraulic conductivities at water saturation varying significantly from one soil profile to another. For example, the average saturated hydraulic conductivity of H4 is 1.3 times higher than that of H3 (see ). The peak flux of discharge of the Fekka and Hachim sites is higher compared to the other site. It reaches 0.065 m3/m2 per day for the Fekka and Hachim sites, whereas for the Guedera site, a maximum flux of 0.049 m3/m2 per day was quantified. Integrating the individual breakthrough curves of water discharge over time shows that the average estimated annual recharge per square metre for the Hachim, Fekka and Guedera sites is 4727, 3227 and 3067 mm, respectively. Note that this artificial recharge of groundwater is high compared to the natural recharge of groundwater estimated as 248 mm based on guidelines from the Tunisian water authority (DGRE Citation2013). However, it is consistent with the increase of water head of approximately 0.3 m observed in March 2014 at monitoring well Pz 17 located near the Fekka spreading perimeter. Furthermore, at the end of the hydrological year, given that the water content profile is in a transient condition (see ), water may migrate towards the groundwater. Hence, in the following second hydrological year, artificial recharge of the groundwater could even be increased.
Moreover, the results calculated for all soil profiles are significantly different. For example, the recharges calculated at the Guedera site are 4042, 3159, 1839 and 3228 mm for G1, G2, G3 and G4, respectively. For the Fekka site, the highest calculated groundwater recharge is estimated at soil profile F2 of approximately 4884 mm, and the lowest recharge is at soil profile F3 with a value of 1726 mm. These values are consistent with the calculated harmonic averages of hydraulic conductivities: the highest value is 2.11 × 10⁻⁶ m s−1 at soil profile F2, and the lowest value estimated is approximately 1.86 × 10⁻⁶ m s−1, calculated at soil profile F3.
Comparing the average values of groundwater recharge of the three sites and the average values of the soil profiles at the same site, one may conclude that the groundwater recharge differs strongly from one spreading perimeter to another, and from one soil profile to another at the same site, due to the spatial heterogeneity of the vadose zone in the study area.
3.5 Impact of root water uptake
This part of the study was performed to investigate the combined effect of evaporation and root water uptake on the overall water balance of the study site. summarizes the water balance calculated for the first soil profile of the Hachim site after 365 days by considering the extraction of water by carrot crops (B) compared to the case of simulation (see Section 3.1) without root water uptake (A). The small difference in water volume per square section due to outflux is attributed to the root water uptake, which is equal to 0.017 m3/m2. This corresponds to 0.2% of the total volume of water infiltrated. This impact is also revealed in the value of stored water, which is higher at the soil profile when considering only the evaporation than when considering the combined effect of evaporation and root water uptake.
Table 3. Influence of root water uptake on the water balance for profile H1 of the Hachim site.
shows the influence of root water uptake on the distribution of water content. At t = 30 d, the relative difference between the water content calculated with root water uptake and calculated without root water uptake is 0.005%. This relative difference at the soil surface increases by 0.007% after 48 d of simulation. At 120 d, the decrease in water content is higher. Its relative difference reaches approximately 0.07%. This means that the water content at the soil surface is moderately influenced by root water uptake.
4 Conclusion
The Sidi Bouzid Plain is a typical example of a semi-arid region where the problem of sustainability of water resources is particularly acute because of the spatial and temporal variability of rainfall coupled with high evaporation intensity. The overexploitation of groundwater resources leads to a deep vadose zone that reaches 46 m in depth.
This study focused on the quantification of the water volume infiltrated across the vadose zone towards a deep water table under successive flooding events. Vertical groundwater recharge and transient moisture distribution were calculated in the unsaturated zone at three sites (Hachim, Fekka and Guedera) in the Sidi Bouzid Plain using a numerical flow model and monitored hydraulic boundary conditions at the soil surface.
It was shown that successive flooding events contribute to artificial recharge of the groundwater of Sidi Bouzid. At profile H1 of the Hachim site, a large amount of water (approx. 9800 mm) infiltrated the soil surface, caused by flooding events. At the end of the hydrological year, 42% of this quantity is stored in the vadose zone, 44% is infiltrated to the groundwater, approximately 13.8% is evaporated at the soil surface, and only 0.2% is extracted by plant roots. During the hydrological year 2013/14, the wetting front moved down from the soil surface deeper into the soil profile, depicted well by several sudden increases of the calculated zeroth spatial moment of moisture content and the behaviour of the movement of the centre of mass.
Despite the small differences in hydraulic parameters estimated by the Rosetta program for 12 soil profiles, there is a significant impact of these parameters on vertical recharge. First, the calculated water quantity stored on the three sites decreased by 42% from the Hachim site to the Fekka site, and the differences between the soil profiles of each site reached more than 15%. Overall, the van Genuchten parameters (,n) and the residual water content were found to strongly influence the variation in the centres of mass of the moisture content distribution, as well as the variation in water volume infiltrated to the groundwater. In all case studies, significant differences in infiltrated water volume were found between the four profiles of each site, which reached approximately 20% for the three spreading perimeters. This is mainly due to the variation in harmonic averages of calculated hydraulic conductivities of the different soil profiles. The thickness of the vadose zone of each site also influences the groundwater recharge. For a given saturated hydraulic conductivity of the soil and a fixed water blade applied to the soil surface, the thicker the vadose zone is, the lower the groundwater recharge.
Note that the average value of recharge calculated for the three sites is approximately 3672 mm, which is very high compared to the annual rainfall for the Sidi Bouzid Plain of approximately 276 mm. Further steps based on in situ measurements of hydraulic conductivities may be necessary to assess the high value of artificial recharge and to validate the soil parameters estimated by Rosetta.
The numerical study also highlighted that the distribution of soil moisture is controlled not only by the infiltration rate of water at the soil surface, but also by the high evaporation rate and the low root water uptake. Near the soil surface, soil moisture varies strongly due to the high evaporation rate. The time-variable evaporation rate applied during the hydrological year strongly reduced the water quantity stored in the vadose zone, as well as the water discharge at the water table. It was shown that the root water uptake exerted a moderate influence on the variation in water content beneath the root zone.
The present study provides useful insights into the evaluation of the influence of soil heterogeneity on the overall water balance in the vadose zone of semi-arid regions. The conclusions drawn might provide valuable information about how to build a future 3D unsaturated–saturated flow model for the entire area of the Sidi Bouzid Plain that considers the variation in hydraulic parameters in both the vertical and horizontal directions. This 3D hydrogeological model would thus be useful for quantifying groundwater recharge at a regional scale. A pilot study might be necessary to estimate additional model parameters and validate the numerical flow model. Finally, the 3D model would provide a tool for groundwater authorities in developing more efficient strategies to manage the spreading perimeters along Wadi El Fekka.
Disclosure statement
No potential conflict of interest was reported by the authors.
References
- Allen, R.G., et al., 1998. Crop evapotranspiration-Guidelines for computing crop water requirements. Rome: Italy: FAO, 1–300.
- Amouri, M., 1994. Etude hydrogéologique du système aquifère de Sidi Bouzid. Tunisie: Direction Générale des Ressources en Eaux.
- Besbes, M., et al. 2006. Recharge des aquifères par les crues d’oueds. In: I. Tchiguirinskaia, eds. Frontiers in flood research. Wallingford, UK: International Association of Hydrological Sciences, IAHS Publ. 305, 43–72.
- Botors, E., et al. 2012. Richards equation-based modeling to estimate flow and nitrate transport in a deep vadose zone. Vadose Zone Journal, 11, 4.
- Bouraoui, S., 1984. Impact des eaux des rejets de l’usine de cellulose de Kasserine (Tunisie) sur l’environnement. Thesis (PhD). University of Pierre et Marie Curie, Paris 6, France.
- Butterworth, A., et al. 1999. Hydrological processes and water resources management in a dryland environment III: groundwater recharge and recession in a shallow weathered aquifer. Hydrology and Earth System Sciences, 3, 345–351. doi:10.5194/hess-3-345-1999
- Camargo, G.G.T. and Kemanian, A.R., 2016. Six crop models differ in their simulation of water uptake. Agricultural and Forest Meteorology, 220, 116–129. doi:10.1016/j.agrformet.2016.01.013
- Canadell, J., et al. 1996. Maximum rooting depth of vegetation types at the global scale. Oecologia, 108, 583–595. doi:10.1007/BF00329030
- Cao, G., et al. 2016. Impacts of thickening unsaturated zone on groundwater recharge in the North China Plain. Journal of Hydrology, 537, 260–270. doi:10.1016/j.jhydrol.2016.03.049
- Coes, A.L. and Pool, D.R., 2005. Ephemeral-Stream Channel and basin-floor infiltration and recharge in the Sierra Vista subwatershed of the upper san Pedro basin Southeastern Arizona. (US Geological Survey: USGS Open-File Report 2005.1023, 67).
- Custodio, E., et al. 2016. Groundwater intensive exploitation and mining in Gran Canaria and Tenerife, Canary Islands, Spain: hydrogeological, environmental, economic and social aspects. Science of the Total Environment, 557–558, 425–437. doi:10.1016/j.scitotenv.2016.03.038
- Dahan, O., et al. 2004. Multi-variable mixing cell model as a calibration and validation tool for hydrogeologic groundwater modeling. Journal of Hydrology, 293, 115–136. doi:10.1016/j.jhydrol.2004.01.019
- Dahan, O., et al. 2007. Direct measurements of floodwater infiltration into shallow alluvial aquifers. Journal of Hydrology, 344, 157–170. doi:10.1016/j.jhydrol.2007.06.033
- DGRE (Direction Générale des Ressources en Eau), 2013. Annuaire de l’exploitation des nappes profondes de la Tunisie. Tunis, Tunisie: Publication de la direction générale des ressources en eau, indice d’archivage 10227.
- DGRE (Direction Générale des Ressources en Eau), 2015. Annuaire de l’exploitation des nappes profondes de la Tunisie. Tunis, Tunisie: Publication de la direction générale des ressources en eau, indice d’archivage 10227.
- Diersch, H.J. and Kolditz, O., 1998. Coupled groundwater flow and transport: 2. Thermohaline and 3D convection systems. Advances in Water Resources, 21 (5), 401–425. doi:10.1016/S0309-1708(97)00003-1
- Diersch, H.-J.G., 2005. FEFLOW Finite Element Subsurface Flow and Transport Simulation System. Volmerstraße, Berlin: Wasy GmbH Institute for Water Resources Planning and Systems Research, Reference Manual WASY, Release 5.3.
- Ezzeddine, S. and Besbes, M., 1991. Un modèle hydrologique à réservoirs pour la simulation des épandages des crues. Les Annales Maghrébines de l’ingénieur, 5 (2), 105–126.
- Feddes, R.A., Kowalik, P.J., and Zaradny, H., 1978. Simulation of field water use and crop yield. Simulation monograph. Wageningen, The Netherlands: Pudoc, 188.
- Flint, A., et al. 2002. Estimating recharge at Yucca Mountain, Nevada, USA: comparison of methods. Hydrogeology Journal, 10 (1), 180–204. doi:10.1007/s10040-001-0169-1
- Gee, G.W. and Ward, A.L., 2001. Vadose zone field study: fy 2001 Plan. Status report, PNNL-13451, Rev.1. Richland: Pacific Northwest National Laboratory.
- Genin, D., et al. 2006. Entre la désertification et développement: la Jeffara Tunisienne. Ouvrage, IRD Editions, Cérès. ISBN 9973-19-683-5.
- Giordano, M., 2009. Global Groundwater-Issues and Solutions. Annual Review of Environment and Resources, 34, 153–178. doi:10.1146/annurev.environ.030308.100251
- Gleeson, T., et al. 2010. Commentary: groundwater sustainability strategies. Nature Geoscience, (6), 378–379. doi:10.1038/ngeo881
- Gleeson, T., et al. 2012. Water balance of global aquifers revealed by groundwater footprint. Nature, 488, 197–200. doi:10.1038/nature11295
- Healy, R. and Cook, P., 2002. Using groundwater levels to estimate recharge. Hydrogeology Journal, 10, 91–109. doi:10.1007/s10040-001-0178-0
- Hendricks, F.H.J., et al. 2009. A comparison of seven methods for the inverse modelling of groundwater flow, Application to the characterisation of well catchments. Advances in Water Resources, 32, 851–872. doi:10.1016/j.advwatres.2009.02.011
- Huo, S.Y., et al. 2014. Changes of vertical groundwater recharge with increase in thickness of vadose zone simulated by one-dimensional variably saturated flow model. Journal of Earth Science, 25 (6), 1043–1050. doi:10.1007/s12583-014-0486-7
- Hupet, F., et al. 2003. Estimation of root water uptake parameters by inverse modeling with soil water content data. Water Resources Research, 39 (11), 1312. doi:10.1029/2003WR002046
- Izbicki, J.A., 2002. Geologic and hydrologic controls on the movement of water through a thick, heterogeneous unsaturated zone underlying an intermittent stream in the western Mojave Desert, southern California. Water Resources Research, 38 (3), 2–14. doi:10.1029/2000WR000197
- Jackson, T.J., 2002. Remote sensing of soil moisture: implications for groundwater recharge. Hydrogeology Journal, 10 (1), 40–51. doi:10.1007/s10040-001-0168-2
- Javaux, M., et al. 2013. Root water uptake: from three dimensional biophysical processes to macroscopic modeling approaches. Vadose Zone Journal, 12 (4), 16. doi:10.2136/vzj2013.02.0042
- Jun, X. and Chen, Y.D., 2001. Water problems and opportunities in the hydrological sciences in China. Hydrological Sciences Journal, 46 (6), 907–921. doi:10.1080/02626660109492885
- Jun, X. and Yongyong, Z., 2008. Water security in north China and countermeasure to climate change and human activity. Physics and Chemistry of the Earth, Parts A/B/C, 33 (5), 359–363. doi:10.1016/j.pce.2008.02.009
- Karlsen, R.H., et al. 2012. A post audit and inverse modeling in reactive transport: 50 years of artificial recharge in the Amsterdam Water Supply Dunes. Journal of Hydrology, 454–455, 7–25. doi:10.1016/j.jhydrol.2012.05.019
- Kim, J.H. and Jackson, R.B., 2012. A global analysis of groundwater recharge for vegetation, climate and soils. Vadose Zone Journal, 11. doi:10.2136/vzj2011.0021RA
- Kong, J., et al. 2015. Effects of vadose zone on groundwater table fluctuations in unconfined aquifers. Journal of Hydrology, 528, 397–407. doi:10.1016/j.jhydrol.2015.06.045
- Koschel, R., 1980. Etude hydrogéologique de la nappe de Hajeb Layoun-Jilma-Ouled Askar. Tunis: DRES, Ministère de l’Agriculture, Projet de coopération technique Tuniso-Allemande No. 6520/7.
- Lafforgue Bouzaine, A., 1981. Etude hydrologique de l’oued Negada à la station de Bled Lessouda. Tunisie: DRES. ORSTOM, 01–145.
- Leaney, F.W. and Herczeg, A.L., 1995. Regional recharge to a karst aquifer estimated from chemical and isotopic composition of diffuse and localised recharge, South Australia. Journal of Hydrology, 164 (1–4), 363–387. doi:10.1016/0022-1694(94)02488-W
- Lu, X.H., et al. 2011. Groundwater recharge at five representative sites in the Hebei Plain, China. Ground Water, 49 (2), 286–294. doi:10.1111/j.1745-6584.2009.00667.x
- Lu, X.H. and Jin, M.G., 2007. One-dimensional unsaturated flow modeling in luan representative zone of the north china plain. Journal of China University of Geosciences, 18, 59–61.
- Marei, A., et al. 2010. Estimating groundwater recharge using the chloride mass-balance method in the West Bank, Palestine. Hydrological Sciences Journal, 55 (5), 780–791. doi:10.1080/02626667.2010.491987
- Martínez-Santos, P. and Andreu, J.M., 2010. Lumped and distributed approaches to model natural recharge in semiarid karst aquifers. Journal of Hydrology, 388, 389–398. doi:10.1016/j.jhydrol.2010.05.018
- Mattern, S. and Vanclooster, M., 2010. Estimating travel time of recharge water through a deep vadose zone using a transfer function model. Environmental Fluid Mechanics, 10 (1–2), 121–135. doi:10.1007/s10652-009-9148-1
- Min, L., Yanjun, S., and Hongwei, P., 2015. Estimating groundwater recharge using deep vadose zone data under typical irrigated cropland in the piedmont region of the North China Plain. Journal of Hydrology, 527, 305–315. doi:10.1016/j.jhydrol.2015.04.064
- Mualem, Y., 1976. A new model for predicting the hydraulic conductivity of unsaturated porous media. Water Resources Research, 12, 513–522. doi:10.1029/WR012i003p00513
- Nazoumou, Y., 2002. Impact des barrages sur la recharge des nappes en zone aride: Etude par modélisation numérique sur le cas de Kairouan (Tunisie centrale). Thesis (PhD). ENIT, Tunisie, 264.
- Nimmo, J.R., et al. 2002. Evaluation of unsaturated zone water fluxes in heterogeneous alluvium at a Mojave Basin Site. Water Resources Research, 38 (10), 33–13. doi:10.1029/2001WR000735
- Ounaïes, S., Schäfer, G., and Trémolières, M., 2013. Quantification of vertical water fluxes in the vadose zone using particle-size distribution and pedology-based approaches to model soil heterogeneities. Hydrological Processes, 27, 2306–2324. doi:10.1002/hyp.9365
- Peters, A., 2016. Modified conceptual model for compensated root water uptake- A simulation study. Journal of Hydrology, 534, 1–10. doi:10.1016/j.jhydrol.2015.12.047
- Poeter, E.P. and Hill, M.C., 1997. Inverse models: A necessary next step in ground-water modeling. Ground Water, 35, 250–260. doi:10.1111/j.1745-6584.1997.tb00082.x
- Raats, P.A.C., 1974. Steady flows of water and salt in uniform soil profiles with plant roots1. Soil Science Society of America Journal, 38, 717–722. doi:10.2136/sssaj1974.03615995003800050012x
- Scanlon, B.R., et al. 2006. Global synthesis of groundwater recharge in semiarid and arid regions. Hydrological Processes, 20, 3335–3370. doi:10.1002/hyp.6335
- SCET, 1990. Etude de facitbilité de l’irrigation par épandage des eaux des crues de l’oued El Fekka et recharge de la nappe de Sidi Bouzid. Phase 1: identification de sites. Phase 2: etude de faisabilité. Tunisie: Rapport interne, SCET.
- Schaap, M.G., Leij, F.J., and Van Genuchten, M.T., 2001. ROSETTA: a computer program for estimating soil hydraulic parameters with hierarchical pedotransfer functions. Journal of Hydrology, 251 (3–4), 163–176. doi:10.1016/S0022-1694(01)00466-8
- Sha, T., et al. 2003. Sustaining Asia’s groundwater boom: an overview of issues and evidence. Natural Resources Forum, 27, 130–141. doi:10.1111/1477-8947.00048
- Shang, H., et al. 2016. An ecology-oriented exploitation mode of groundwater resources in the northern Tianshan Mountains, China. Journal of Hydrology, 543, 386–394. doi:10.1016/j.jhydrol.2016.10.012
- Simonot, M., 1996. Plaine de Sidi Bouzid: etude de l’impact de l’épandage des crues sur la recharge de la nappe phréatique. Final rapport. DGRE. Tunisia. Rome, Italy: FIDA, 01–40.
- Šimůnek, J. and Hopmans, J.W., 2009. Modeling compensated root water and nutrient uptake. Ecological Modelling, 220 (4), 505–521. doi:10.1016/j.ecolmodel.2008.11.004
- Sonnenborg, T.O., et al. 2003. Transient modeling of regional groundwater flow using parameter estimates from steady-state automatic calibration. Journal of Hydrology, 273, 188–204. doi:10.1016/S0022-1694(02)00389-X
- Turkeltaub, T., Dahan, O., and Kurtzman, D., 2014. Investigation of groundwater recharge under agricultural fields using transient deep vadose zone data. Vadose Zone Journal, 13, 4. doi:10.2136/vzj2013.10.0176
- Van Genuchten, M.T., 1980. A closed-form equation for predicting the hydraulic conductivity of unsaturated soils. Soil Science Society of America Journal, 44, 892–898. doi:10.2136/sssaj1980.03615995004400050002x
- Van Genuchten, M.T., 1987. A numerical model for water and solute movement in and below the root zone. Research Report 121. US Salinity Lab. Riverside. CA: ARS USDA.
- Van Genuchten, M.T. and Gupta, S.K., 1993. A reassessment of the crop tolerance response function. Indian Society of Soil Science, 41 (4), 730–737.
- Vázquez-Suñé, E., et al. 2010. An approach to identify urban groundwater recharge. Hydrology and Earth System Sciences, 14, 2085–2097. doi:10.5194/hess-14-2085-2010
- Vrugt, J.A., Hopmans, J.W., and Šimunek, J., 2001. Calibration of a two-dimensional root water uptake model for a sprinkler-irrigated almond tree. Soil Science Society of America Journal, 65 (4), 1027–1037. doi:10.2136/sssaj2001.6541027x
- Wada, Y., et al. 2010. Global depletion of groundwater resources. Geophysical Research Letters, 37, 20. doi:10.1029/2010GL044571
- Yeh, T.C.J., Ye, M., and Khaleel, R., 2005. Estimation of effective unsaturated hydraulic conductivity tensor using spatial moments of observed moisture plume. Water Resources Research, 41 (3), W03014. doi:10.1029/2004WR003736
- Zhang, G.H., et al. 2007. Influence of unsaturated zone thickness on precipitation infiltration for recharge of groundwater. Journal of Hydraulic Engineering, 38 (5), 611–617.
- Zhu, C., 2000. Estimate of recharge from radiocarbon dating of groundwater and numerical flow and transport modeling. Water Resources Research, 36, 2607–2620. doi:10.1029/2000WR900172
- Zinsou, D.S., 1998. Impact de l’épandage des eaux des crues de l’Oued Fekka sur la recharge de la nappe de Sidi Bouzid. Tunisie: DEA, ENIT, 109.
- Zouaghi, T., 2008. Distribution des séquences de dépôt du Crétacé (Aptien—Maastrichtien) en subsurface: rôle de la déformation tectonique, l’halocinèse et évolution géodynamique (Atlas Central Tunisien). Thesis (PhD). University Tunis El Manar. Tunisie.