
ABSTRACT
The grain size distribution (GSD) of sediment in comparison with the original soil GSD is discussed under different slopes (5, 15 and 25%) and rainfall intensities (30, 60 and 90 mm h–1 with respective duration of 30, 15 and 10 min) but identical runoff (15 mm). The sediment quantification was carried out by raindrop-induced flow transport (RIFT) or/and transport by flow (FT) using a rainfall simulator and a 6 × 1 m2 erosion plot and a silt loam. The results show a high degree of enrichment for size classes of 2–4 and 4–8 μm and a high degree of depletion for size classes of >63 μm under different slopes and rainfall intensities. In addition, the results show that the experimental enrichment ratio (ER) for particle size <16 μm under different slopes and rainfall intensities was greater than 1, while the ER for particle size >32 μm was less than 1.
Editor A. Castellarin
Associate editor Y. Gyasi-Agyei
1 Introduction
Soil is an essential part of the environment (García-Ruiz et al. Citation2015), and is indispensable for the production of food and other crops. Soil erosion by water has been recognized as one of the most important worldwide environmental problems. Nearly one-third of the world’s arable land has been lost due to soil erosion at a rate of more than 10 million ha per year (Wang et al. Citation2016, Zhang et al. Citation2017). Water erosion results from the expenditure of energy by falling raindrops and runoff when these two agents act either individually or together (Fernández-Raga et al. Citation2017). Thus, two detachment and transport systems can be identified when these two agents act together: detachment by raindrop (DR), and transport by raindrop-induced flow transport (RIFT) and by flow (FT) (Kinnell Citation2005, Citation2016).
Simultaneously, soil erosion is due to a continuous process of particle detachment, entrainment, transport and deposition. Detachment and entrainment processes occur when the erosive forces due to raindrop impact and runoff exceed the soil resistance to erosion (Kinnell Citation2005, Fu et al. Citation2011). Transport of detached material takes place by raindrop splash and runoff. Ultimately, deposition of detached material occurs when sediment load of the runoff exceeds its transport capacity (Foster Citation1982). The transportability and potential for subsequent deposition of sediment by runoff depends on its size distribution, roughness, local slopes, vegetation cover and stone cover (Seeger Citation2007, Rodrigo Comino et al. Citation2016a).
Elucidating the grain size distribution (GSD) of sediment can provide basic information on different processes of soil erosion. A better understanding of the dynamics of the GSD will therefore improve understanding of both erosion and sedimentation processes and consequently erosion modelling. It can also provide an appropriate basis for understanding of the transfer of nutrients and contaminants from agricultural areas and rangelands to waterways, and the ability to better model these fluxes (Teixeira and Misra Citation1997, Asadi et al. Citation2011). In this regard, inter-rill and rill erosion processes have an important role in moving surface material due to runoff that is rich in organic matter and contaminants, resulting in sediment entering rivers and negatively affecting water quality (Rodrigo-Comino et al. Citation2017b). Several studies (e.g. Di Stefano et al. Citation2000, Citation2005, Walling et al. Citation2000, Shi et al. Citation2013, Thompson et al. Citation2016) have investigated the temporal and spatial variation of fine sediment, including physical and chemical characteristics of the particle size distribution, nutrient and organic matter, pollutants and trace elements.
Although the influence of soil aggregation and breakdown mechanisms on soil particle transportability is well documented, most of the available results on GSD for soils and sediments were obtained using materials fully dispersed into their absolute particles (Di Stefano and Ferro, Citation2002). Slattery and Burt (Citation1997) compared the effective GSD (without dispersing soil/sediments into their primary particles) and the ultimate distribution of sediments collected during 11 storms events. They showed that most of the clay moves as absolute particles with increasing discharge because flow turbulence influences the aggregate breakdown, and sediment load becomes finer and less aggregated (Rodrigo Comino et al. Citation2017a).
The sediment size characteristics might also be expected to vary depending on which erosion process is dominant (Kinnell Citation2005, Asadi et al. Citation2011). Laboratory studies undertaken by Young and Onstad (Citation1978) showed that sediment of inter-rill erosion was enriched in sand rather than in clay, while sediment of rill erosion was enriched in clay and not sand. These findings conflict with the conclusions of Schiettecatte et al. (Citation2008), Shi et al. (Citation2012) and Wang and Shi (Citation2015) suggesting that the particles transported from inter-rill erosion are smaller than sediment particles from rill erosion.
According to Wang and Shi (Citation2015), inter-rill erosion results in the selective removal of particles of <63 μm, while rill erosion is less selective than inter-rill erosion and becomes nonselective after rill flow shear stress exceeds its critical value. The high transport capacity of rill flow decreases the selectivity of the erosion process as large particles are transported (Ghadiri and Rose Citation1991, Schiettecatte et al. Citation2008, Hao et al. Citation2016).
Some studies (Asadi et al. Citation2007, Shi et al. Citation2012, Wang and Shi Citation2015, Kinnell Citation2016, Thompson et al. Citation2016) have shown that, when the main erosion process is rainfall detachment, the difference between sediment and original soil GSDs is due to the selectivity in the detachment process. Additionally, several studies also found that inter-rill erosion is selective with respect to the eroded sediment size classes, compared to the source material size classes (Sutherland et al. Citation1996, Thompson et al. Citation2016). Other studies further showed that the selectivity can be explained entirely in terms of selectivity in entrainment, or that it is due to different transport mechanisms. Coarse particles are transported by rill erosion, rather than by inter-rill erosion, due to differences in detachment and transport mechanisms (Schiettecatte et al. Citation2008, Shi et al. Citation2012, Wang and Shi Citation2015) and high slopes, and depend on environmental plot characteristics such as parent material (Cerdà Citation1999, Mohammadkhan et al. Citation2011).
To date, the variability of sediment size distribution has been investigated under different conditions of slope and rainfall intensity. Martinez-Mena et al. (Citation2002) measured GSDs of two lemon orchard soils in a semi-arid Mediterranean area of southeastern Spain using simulated rainfall. Their results confirmed that the erosion process depended on the rainfall intensity, with a prevailing detachment-limited condition and time-dependent sediment GSDs in high and medium rainfall intensities, while time-independent sediment GSDs indicated transport-limited erosion. Besides, they also found that the effective sediments were enriched with particles of <20 μm for both conditions tested, indicating transport selectivity by both the rainfall detachment and transport was limited when they were the main process. Asadi et al. (Citation2007) investigated soil erosion processes under a flume for low runoff power values and established that the sediment GSD was bimodal. They reported that the bimodal distribution of the particles eroded resulted from two different transport mechanisms, acting dominantly on sediment GSD, which include suspension/saltation and rolling mechanisms. Asadi et al. (Citation2011) also measured the dynamic changes in the GSD under an erosion flume at a range of low to modest runoff powers for two contrasting soil samples. The results suggested that the suspension/saltation was the only erosion mechanism that worked for both samples at very low runoff power, affecting mainly fine to very fine GSD. However, with increasing runoff power, the observed sediment GSD indicated that some mechanisms in addition to suspension/saltation were gradually activated, enhancing the transport of medium to larger grain size material. Such enhancement required a threshold runoff power to be exceeded, when bedload transport by rolling was observed to occur.
An experiment conducted by Shi et al. (Citation2012) showed that the sediment GSDs are associated with transport mechanisms on steep slopes. These authors observed that large sediment size materials were easily transported on steep slopes due to the intense gravity and forces of inertia in the direction of the slopes; rolling transport increased with increasing slope gradient. Therefore, the sediment selectivity was less important during erosion processes on steep slopes (all particles) than on gentle slopes when considering rolling transport mechanisms.
Wang and Shi (Citation2015) studied erosion processes and sediment selectivity for four uniquely textured soils under simulated rainfall and confirmed that, for the investigated soils, sediments before rill development were finer than after rill development, due to the capacity of the rill flow to transport larger particles. Moreover, coarse particle content increased with decreasing rill width/depth ratios. Hao et al. (Citation2016) collected the runoff and sediments eroded from three soils under nine natural rainfalls, and analysed their GSDs. The results indicated that sediments were generally finer compared to the original soil. Thompson et al. (Citation2016) also quantified both parent soil and total suspended sediment GSD by fitting each dataset to a lognormal distribution.
The analysis of the available literature underlines the need to study sediment GSD for a better understanding of the soil erosion processes, as well as pollutant and nutrient transportation mechanisms. However, few studies have documented the dependence of sediment GSD on rainfall intensity and slope steepness, and also quantification of transportability and potential for subsequent deposition of sediment GSD by raindrop-induced flow transport (RIFT) and transport by flow (FT). Therefore, this study was accomplished under laboratory conditions to (a) evaluate the impact of different local slope and rainfall intensity values on the sediment GSD on a silt loam soil collected from the Kojour watershed in Hyrcanian Region, Iran; (b) compare characteristic diameters (i.e. D10, D20, D50, D84 and D90) of sediment GSD and the original soil GSD under the studied conditions; and (c) compare enrichment and depletion of various grain size classes of sediment and original soil to different rainfall intensities and slope values.
2 Materials and methods
2.1 Experimental plots
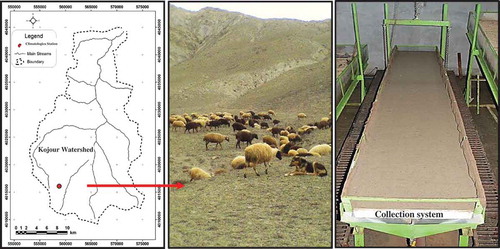
The entire study was formulated and conducted in Iran. Land degradation caused by soil erosion is serious in Iran (Sarmadian et al. Citation2010, Hosseini and Ashraf Citation2015) and has high priority. In some parts of the country, it is greatly influenced by land use and management (Sadeghi et al. Citation2017b). Additionally, degradation might be due to changes in potential erosive driving forces or erodible conditions (Sadeghi and Hazbavi Citation2015). Soil is eroded by two important factors: water and wind. Water erosion generally occurs only on steep slopes, and its severity increases with the steepness of the slope (Vaezi et al. Citation2016). To achieve the objectives of this study, laboratory experiments were conducted using a rainfall simulator and sets of 6 m × 1 m erosion plots on a silt loam soil collected from the Kojour watershed in the degrading Hyrcanian Region of northern Iran.
The experimental runs were carried out using 6 m × 1 m erosion plots with a depth of 0.5 m and slopes of 5, 15 and 25% set up at in the Faculty of Natural Resources of Tarbiat Modares University, Noor, Iran. The soil was collected from the top surface layer (0–20 cm) of rangeland in the Kojour watershed, with silt loam texture (Kiani Harchegani et al. Citation2016, Kiani-Harchegani et al. Citation2017a). A general view of the original area of the soil and an experimental plot is shown in . The original soil characteristics used in this investigation are listed in .
Table 1. Characteristics of the soil used in the present study.
Figure 1. Experimental set-up of rainfall simulation (right), field condition of original site (middle) and schematic of the study watershed (left).
The collected soil was transported to the laboratory and air dried until a moderate moisture content was reached (not measured, not dry and not wet) to maintain the relative stability of the soil aggregates (Kukal and Sarkar Citation2011). To create the greatest similarity with the soil under natural conditions, plant residues and pebbles were removed from the soil by passing it through an 8-mm sieve. A 15-cm-thick mineral pumice layer was placed at the bottom of the plot as a filter to simulate a drainage system (Darboux et al. Citation2001, Khaledi Darvishan et al. Citation2014). Then a 15-cm-thick soil layer was placed on top of the mineral pumice layer, separated from it by a porous jute sheet. The soil was ultimately compacted by a PVC (polyvinylchloride) hand roller filled with concrete to achieve an appropriate bulk density and roughness of 1.46 g cm−3 (Defersha et al. Citation2011, Khaledi Darvishan et al. Citation2014), which is almost equal to that of the soil under natural conditions. Each soil layer was lightly raked before adding the next layer to reduce any discontinuities between the layers. The moisture content of the soil was also set at about 12 ± 3%, similar to that reported (Kiani Harchegani et al. Citation2016, Sadeghi et al. Citation2017a) for the soil in the research area (Kojour watershed). After each experiment, the surface soil in each plot was changed to create maximum similarity among experimental runs.
2.2 Rainfall simulation
The rainfall simulator used for the experimental runs consists of a 4000 L water tank with seven nozzles (BEX: 3/8 S24W), in a line (Sadeghi et al. Citation2013), able to simulate raindrops having sizes ranging from 1.5 to 1.58 mm for rainfall intensities of 30, 60 and 90 mm h−1 and uniformity coefficient of 95.15% (Abdollahi et al. Citation2013), and with a height of some 6 m above the soil surface in a plot with slope of 0% (in a horizontal position). The three rainfall intensities (30, 60 and 90 mm h−1), with durations of 30, 15 and 10 min, were considered to correspond to climatological conditions at the location of the original soil. These conditions were obtained through intensity–duration–frequency (IDF) curve analysis for data recorded for the nearest synoptic station (Kojour; longitude 51°44′; latitude 36°24′; elevation 1550 m a.m.s.l.) () with a return period of 25 years.
2.3 Measurements
2.3.1 Components of runoff and sediment
To compare the GSD of sediment transmitted by RIFT and FT with that of the original soil, the sediment samples were taken at the onset of runoff commencement and reach the plot outlet. For each storm event, the runoff was sampled and measured volumetrically at 1 min intervals. The time to runoff initiation was recorded as the elapsed time between the start of rainfall and the time at which surface runoff began entering the runoff collection container at the lower end of the plot (). The collected samples were deposited, separated from the water, and oven-dried at 105ºC for 24 h (Walling et al. Citation2000) until sediment mass was achieved. The sediment concentration was obtained as the ratio between dry sediment mass and sampled runoff volume (Sadeghi and Kiani Harchegani Citation2012). Soil loss was calculated as the total sediment load present in runoff water from the plot area. The number of samples was 23–25 for the rainfall intensity of 30 mm h−1, 12–13 for 60 mm h−1 and 8–9 for 90 mm h−1 in three replicates. These differences in sample number are due to inter-storm variability in detachment, transport and deposition processes of eroded soil particles sampled at short intervals (1 min), as well as time of runoff initiation (Kiani-Harchegani et al. Citation2017b).
2.3.2 Kinetic energy of rainfall and runoff
The median diameter and mean raindrop velocities were measured by image processing techniques (). Raindrop sizes were captured using a digital camera (Canon 550D, 18.7 megapixel) capable of recording 4000 frames per second (Sadeghi et al. Citation2013). In addition, the uniformity of spatial distribution of rainfall was calculated in each experimental run using the water collected over 15 min in six sharp-edged cylindrical vessels, with diameters of 10 cm, distributed along the study plot at a spacing of 1 m (Dunkerley Citation2008, Abdollahi et al. Citation2013). The spatial distribution of rainfall intensities of 30, 60 and 90 mm h−1 was then obtained with ±2.5 mm h−1 of variation (Kiani-Harchegani and Sadeghi Citation2017, Kiani-Harchegani et al. Citation2017b). The kinetic energy (KE) of simulated rainfall was calculated using the following equations (Angulo-Martínez et al. Citation2016):
Table 2. Summary of simulated rainfall and runoff characteristics.
in which KE is the kinetic energy per mm of rainfall (J m−2), s and n are photography surface and number of raindrops, ei is the kinetic energy (J) of drop i having mass mi and terminal velocity vi.
Rain power R (W m−2), as the time derivative of the kinetic energy per unit area (Gabet and Dunne Citation2003), was calculated as follows:
where ρ is the density of water (assumed to have a constant value of 1000 kg m–3 at 25°C), I, v and θ are the rainfall intensity (m s–1), raindrop velocity (m s–1) and plot slope (°), respectively (Shi et al. Citation2012). The plot slopes were considered as 3, 9 and 15º (or 5, 15 and 25%) according to the highest percentage of slope classes in the Kojour watershed, with respective equivalent cosθ values of 0.99, 0.98 and 0.96. This verified nonsignificant variability in R for the study plot slopes.
Runoff power ω (W m–2), representing the energy of runoff water flowing over the soil surface (Teixeira and Misra Citation1997), was also calculated using:
where ρ is the same as in Equation (3), and g, S, Q and W are the gravitational acceleration (9.8 m s−2), the sin of the erosion surface slope, the discharge rate (m3 s−1) and the plot or rill width (m), respectively (Shi et al. Citation2012). The rainfall and runoff characteristics are summarized in .
2.3.3 Effective sediment and original soil GSDs
A single mixed soil sample was analysed for GSD using a Malvern Mastersizer 2000 laser diffraction device (http://www.malvern.com). Samples of runoff (water and sediments), each having a volume of 1000 mL, were also collected in a beaker, at 1 min intervals, to measure the effective sediment GSD of the sediment with the same equipment. The GSD data were also determined without any dispersion treatment to allow the effective sediment GSD to be measured (Walling et al. Citation2000, Martinez-Mena et al. Citation2002). The main characteristics of sediments and original soil GSD, namely particle sizes of <2, 2–4, 4–8, 8–16, 16–32, 32–63 and >63 μm (i.e. clay, very fine silt, fine silt, medium silt, coarse silt, very coarse silt and sand, respectively) and the characteristic diameters of the GSD (D10, D20, D50, D84 and D90) were computed using the GRADISTAT software package (Blott and Pye Citation2001). The enrichment ratio of the sediments with respect to the original soil was also calculated.
2.3.4 GSD enrichment ratio
Foster et al. (Citation1985) derived some relationships to predict the effective GSD of sediment using the texture of the matrix soil. These equations, which are based on experimental data from 28 soils, take into account five sediment particle sizes (primarily of clay, silt and sand, small and large aggregate) (Di Stefano and Ferro Citation2002). In this study, the experimental enrichment ratios were calculated as the proportion of effective sediment GSD to original soil GSD variables (Ghadiri and Rose Citation1991, Martinez-Mena et al. Citation2002, Schiettecatte et al. Citation2008). The enrichment ratios were calculated as the ratios between the percentages of clay, very fine silt, fine silt, medium silt, coarse silt, very coarse silt and sand of the sediment and of the corresponding values of the original soil. The enrichment ratio of clay, as an example, is defined as:
where GSDsed is the percentage of GSD variables in the sediment and GSDsoil is the corresponding percentage in the original soil. The relationships between EGSD obtained for GSDs variables were ultimately regressed to slope steepness of the plots and rainfall intensities using multiple regression.
2.3.5 Data analyses
The statistical analysis adopted was two-factorial (i.e. a three slope steepness and three rainfall intensity factorial experiment) and had a complete randomized design with three replications for each treatment. The entire data for each individual component, i.e. time to runoff initiation (s), runoff volume (mm3) and soil loss (g m−2 min−1), were statistically grouped with the help of the TukeyHSD test at 0.05 probability level in the Agricola package because the experimental design was factorial (3 × 3) (Mangiafico Citation2015) and the characteristic diameters of GSDs of sediment and original soil were compared by the t-test using Rstudio software. In addition, different components of original soil GSDs were compared with those obtained for sediment collected for each study treatment.
3 Results and discussion
3.1 Runoff and soil loss
The results of the Tukey test groupings for different variables achieved from rainfall simulation experiments under different slopes and rainfall intensities are shown in . Time to runoff initiation had very significant differences among the three rainfall intensities (i.e. 30, 60 and 90 mm h−1) for different slopes, most likely due to the effects of rainfall intensities and durations. The time to runoff initiation was significantly shorter for the high-intensity rainfall compared to the low- and medium-intensity rainfalls (Boix-Fayos et al. Citation2005, Yan et al. Citation2008). Also, there was no significant difference at slopes of 5 or 15% at different rainfall intensities, which agrees with Armstrong et al. (Citation2011), who stated there was no statistically significant relationship between soil loss and low slope during inter-rill erosion processes on a silt loam soil. However, there was a significant difference (P < 0.05) between slopes of 25% at different rainfall intensities, which agrees with Chaplot and Le Bissonnais (Citation2000), who reported that, under simulated rainfall, the increase in soil loss with slope was greater for higher rainfall intensities. The lowest and highest values of time to runoff initiation were at rainfall intensities of 90 and 30 mm h−1 for a slope of 25%. The results listed in also indicate that the runoff initiation time was mainly influenced by rainfall intensity. In addition, shows that, for plot slope values ≥15%, the highest volume of runoff was observed for high rainfall intensity (90 mm h−1).
Table 3. Result of Tukey test groupings for different variables from rainfall simulation experiments.
It is also inferred from the results that the soil loss increased as slope steepness increased, particularly when the slope steepness exceeded 15%. This last result agrees with Kinnell (Citation2000), who reported increased soil loss with increase in slope steepness. It is also understood that, as the plot slope increases, the soil cohesiveness decreases (Rodrigo Comino et al. Citation2016b).
3.2 Characteristic diameters of sediment and original soil GSDs
The characteristic diameters of sediment and original soil GSDs were determined for each experimental run and the results are summarized in . These results also establish a significant difference between characteristic diameters of original soil GSD and those corresponding to effective sediment GSD (D10, D20, D84 and D90) under different slope and rainfall intensity, with the exception of D50 for the high slope (25%) and high rainfall intensity (90 mm h−1). In this last condition the formation of a rill occurred.
Table 4. Result of the t-test for characteristic diameters of sediment and original soil GSDs under different rainfall intensities and slopes.
The results of show that the lowest sediment diameter sizes were recorded for a slope of 5% and at a rainfall intensity of 30 mm h−1 (with rainfall and runoff power of 0.19 and 0.017 W m−2, respectively). This result can be justified by taking into account that, for low values of slope and rainfall intensity, the flow transport capacity is low and the flow is able to transport only the smallest size particles. However, the highest sediment diameter sizes at the plot outlet were for high slope and high rainfall intensity (with rainfall and runoff power of 0.54 and 0.047 W m−2, respectively). In other words, when the slope and rainfall intensity increase, the flow tends to transport preferentially the largest size particles. These results are supported by Asadi et al. (Citation2007, Citation2011), who demonstrated that suspension/saltation was the only transport mechanism that acts for samples at very low runoff power, affecting mainly very fine to fine grain size particles. However, the medium to larger grain size particles will subsequently be transported as runoff power increases.
3.3 Comparison between the original soil and sediment GSDs
shows the comparison between the GSD of the original soil and of the eroded sediment on slope steepness (5, 15 and 25%) and rainfall intensity values (30, 60 and 90 mm h−1). The two GSD overlap for the highest values of rainfall intensity (60 and 90 mm h−1) and slope steepness (25%). Therefore, for the highest rainfall intensity and slope steepness values, an equimobility condition of the eroded soil particles occurs, or, in other words, the sediment transport is not selective.
Figure 2. Original soil and effective sediment GSDs under different slopes and rainfall intensities.
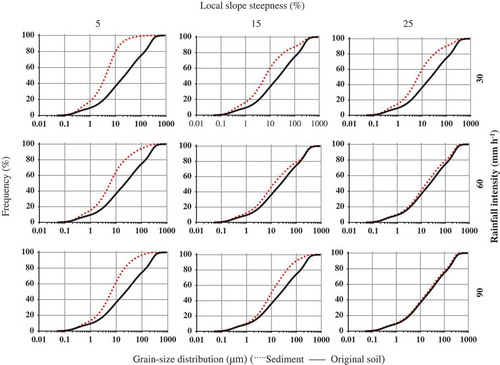
For the minimum investigated slope steepness (5%) for any rainfall intensity, the GSD of the eroded soil shows that these particles are always finer than those of the original soil. This result can be justified by taking into account that there is a high level of selective removal of soil particles and a predominance of the inter-rill erosion processes (Asadi et al. Citation2007).
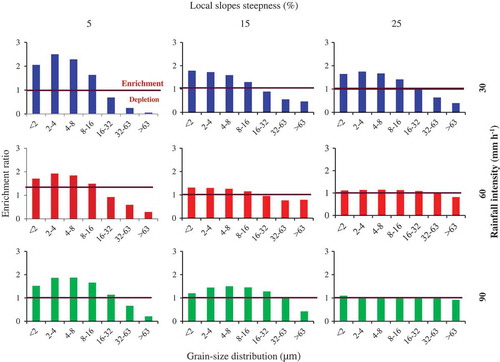
These results () are due to the circumstance that under inter-rill erosion there was selective removal of particles of clay (<2 μm) and silt (2–63 μm) for low slopes and rainfall intensity values, while rill erosion was less selective and became nonselective when the shear stress of the rill flow exceeded the critical value (slope: 25%, rainfall intensity: 90 mm h−1). When rill erosion occurred, the high rate of sediment transport decreased the selectivity of the erosion process and large particles and aggregates were also transported. These results are also supported by previous studies which showed that the inter-rill erosion preferentially transports finer particles from the original soil (Martinez-Mena et al. Citation2002, Schiettecatte et al. Citation2008, Wang and Shi Citation2015, Hao et al. Citation2016). In this regard, the results in show the high degree of enrichment for size classes of 2–4 and 4–8 μm and the high degree of depletion for size classes of >63 μm under different slopes and rainfall intensities.
Figure 3. Comparison of sediment GSD enrichment or depletion in various size classes under different slopes and rainfall intensities.
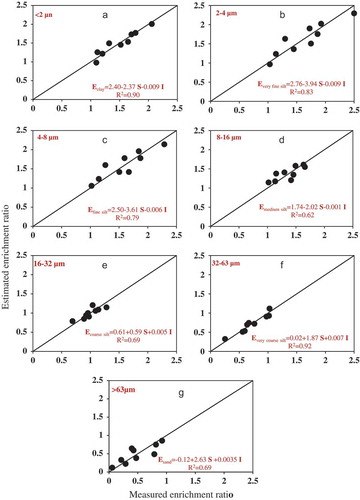
The relationship between the experimental enrichment ratio values of the sediment GSD variables calculated for the investigated rainfall intensity and slope values is plotted in . The scatter plot () shows a significant relationship between measured and enrichment ratios for various grain size classes () under different slopes and rainfall intensities. The analysis established a good linear relationship in the scatter plots () for clay and very coarse silt under different slopes and rainfall intensities. In addition, the results ( and ) show that the enrichment ratio of particles smaller than 16 μm was >1 and that of particles >32 μm was <1 under different slopes and rainfall intensities. This result agrees with the findings of Martinez-Mena et al. (Citation2002), who determined average enrichment ratios for all the events of >1 for clay and silt fine fractions and <1 for sand fractions. The results also indicate that the sediment exhibited a larger proportion of fine-grained material (<63 μm) than the original soil, although preferential deposition of coarser material (>63 μm) could be expected to occur during the process of sediment delivery (Peart and Walling Citation1982). These results are in agreement with Lal (Citation1976), who demonstrated significant contrasts between the sediment and the original soil GSDs, with the former commonly exhibiting enrichment in both clay and silt particles. The scatter plots for clay and very coarse silt () also demonstrate a relatively good correlation (R2 > 90) between enrichment ratios of GSD study variables and different slopes and rainfall intensities. The results also indicate that the different variables, except Eclay, Ecoarse silt and Every coarse silt (beta= –0.72, 0.78 and 0.72) were mainly influenced by slope.
Figure 4. Correlation between measured and estimated enrichment ratios of sediment and original soil GSD variables.
4 Conclusions
The sediment GSD is important in understanding, characterizing and modelling the transport behaviour of eroded soil and sediment-associated contamination. An improved understanding of the GSD characteristics of effective sediment clearly necessitates an appreciation of the detailed interaction of runoff generation and the processes of erosion and sediment delivery. The present study was therefore designed to evaluate the impacts of three different slopes and three different rainfall intensities with different durations but similar runoff depth on the characteristic diameters, enrichment and depletion GSDs of original soil and sediment in raindrop-induced flow transport (RIFT) and transport by flow (FT). The results represent selective removal of clay-sized (<2 μm) and silt-sized (2–63 μm) particles by the inter-rill erosion in contrast to the less selective behaviour of rill erosion. It was also shown that enrichment ratio of particles of <16 μm was >1 but depletion occurred for particles of >32 μm under different slopes and rainfall intensities. The results also verified that the greater the rainfall intensity and the steeper the slope, the more agreement would exist between granulometric curves of original soil and eroded sediment. The results of the present study under simplified laboratory conditions indicate the need for consideration of all the essential variables of sediment dynamics for better understanding of governing conditions leading to sound management of watershed resources. However, more insight, and comprehensive and detailed experimental studies at different scales are needed, particularly under realities, before drawing comprehensive conclusions.
Acknowledgements
The authors wish to thank Professor Vito Ferro and Professor Vincenzo Bagarello (Dipartimento di Scienze Agrarie e Forestali, Università degli Studi di Palermo, Italy) for their guidance and for hosting the first author during her stay at their university.
Disclosure statement
No potential conflict of interest was reported by the authors.
References
- Abdollahi, Z., Sadeghi, S.H.R., and Khaledi Darvishan, A., 2013. Designing, manufacturing and testing rainfall simulator nozzles. Iranian Journal of Water and Soil Conservation, 20 (6), 67–86. (In Persian).
- Angulo-Martínez, M., Beguería, S., and Kyselý, J., 2016. Use of disdrometer data to evaluate the relationship of rainfall kinetic energy and intensity (KE-I). Science of the Total Environment, 568, 83–94. doi:10.1016/j.scitotenv.2016.05.223
- Armstrong, A., et al., 2011. Variability of inter-rill erosion at low slopes. Earth Surface Processes and Landforms, 36 (1), 97–106. doi:10.1002/esp.v36.1
- Asadi, H., et al., 2007. An investigation of flow-driven soil erosion processes at low streampowers. Journal of Hydrology, 342 (1), 134–142. doi:10.1016/j.jhydrol.2007.05.019
- Asadi, H., et al., 2011. Flow-driven soil erosion processes and the size selectivity of sediment. Journal of Hydrology, 406 (1), 73–81. doi:10.1016/j.jhydrol.2011.06.010
- Blott, S.J. and Pye, K., 2001. GRADISTAT: a grain size distribution and statistics package for the analysis of unconsolidated sediments. Earth Surface Processes and Landforms, 26 (11), 1237–1248. doi:10.1002/esp.v26:11
- Boix-Fayos, C., et al., 2005. Concise review of inter-rill erosion studies in SE Spain (Alicante and Murcia): erosion rates and progress of knowledge from the 1980s. Land Degradation & Development, 16 (6), 517–528. doi:10.1002/ldr.706
- Cerdà, A., 1999. Parent material and vegetation affect soil erosion in Eastern Spain. Soil Science Society of America Journal, 63 (2), 362–368. doi:10.2136/sssaj1999.03615995006300020014x
- Chaplot, V. and Le Bissonnais, Y., 2000. Field measurements of inter-rill erosion under different slopes and plot sizes. Earth Surface Processes and Landforms, 25 (2), 145–153. doi:10.1002/(ISSN)1096-9837
- Darboux, F., et al. 2001. Evolution of soil surface roughness and flowpath connectivity in overland flow experiments. Catena, 46, 125–139.
- Defersha, M.B., Quraishi, S., and Melesse, A., 2011. The effect of slope steepness and antecedent moisture content on inter-rill erosion, runoff and sediment size distribution in the highlands of Ethiopia. Hydrology and Earth System Sciences, 15 (7), 2367–2375. doi:10.5194/hess-15-2367-2011
- Di Stefano, C., et al., 2000. Sediment delivery processes and agricultural non-point pollution in a Sicilian Basin. Journal of Agricultural Engineering Research, 77 (1), 103–112. doi:10.1006/jaer.2000.0567
- Di Stefano, C., et al., 2005. Sediment delivery processes and chemical transport in a small forested basin/Processus de production sédimentaire et transport chimique dans un petit bassin versant forestier. Hydrological Sciences Journal, 50 (4), 697–712. doi:10.1623/hysj.2005.50.4.697
- Di Stefano, C. and Ferro, V., 2002. SW—soil and Water: linking Clay Enrichment and Sediment Delivery Processes. Biosystems Engineering, 81 (4), 465–479. doi:10.1006/bioe.2001.0034
- Dunkerley, D., 2008. Rain event properties in nature and in rainfall simulation experiments a comparative review with recommendations for increasingly systematic study and reporting. Hydrological Processes Journal, 22, 4415–4435. doi:10.1002/hyp.7045
- Fernández-Raga, M., et al., 2017. Splash erosion: a review with unanswered questions. Earth Science Reviews, 171, 463–477. doi:10.1016/j.earscirev.2017.06.009
- Foster, G.R., Young. R.A., and Neibling, W.H., 1985. Sediment composition for nonpoint source pollution analyses. Transactions of the ASAE, 28, 133–139.
- Foster, G.R., 1982. Modeling the soil erosion process. In: C.T. Hann, H.P. Johnson, and D.L. Brakensiek, eds. Hydrologic model- ling of Small Watersheds. St, Joseph, MI: ASAE, 297–382. Chapter 8.
- Fu, S., et al., 2011. The effect of slope on inter-rill erosion at short slopes. Catena, 84, 29–34. doi:10.1016/j.catena.2010.08.013
- Gabet, E.J. and Dunne, T., 2003. Sediment detachment by rain power. Water Resources Research, 39 (1), 1–12. doi:10.1029/2001WR000656
- García-Ruiz, J.M., et al., 2015. A meta-analysis of soil erosion rates across the world. Geomorphology, 239, 160–173. doi:10.1016/j.geomorph.2015.03.008
- Ghadiri, H. and Rose, C.W., 1991. Sorbed chemical transport in overland flow: II. Enrichment ratio variation with erosion processes. Journal of Environmental Quality, 20 (3), 634–641. doi:10.2134/jeq1991.00472425002000030021x
- Hao, Y., et al., 2016. Size characteristics of sediments eroded from three soils in China under natural rainfall. Journal of Soil and Sediment, 16 (8), 2153–2165.
- Hosseini, M. and Ashraf, M.A., 2015. Effect of land use changes on water balance and sediment yield in Iran. Chapter 2. In: Application of the SWAT model for water components separation in Iran. Springer Hydrogeology. Tokyo: Springer Japan, pp. 33–61. doi:10.1007/978-4-431-55564-3_2.
- Khaledi Darvishan, A., et al., 2014. Measuring sheet erosion using synthetic color contrast aggregates. Hydrological Processes, 28 (15), 4463–4471. doi:10.1002/hyp.v28.15
- Kiani Harchegani, M., Sadeghi, S.H.R., and Asadi, H., 2016. Comparative analysis of the effects of rainfall intensity and experimental plot slope on Raindrop Impact Induced Erosion (RIIE). Iranian Journal of Water and Soil Research, 46 (4), 631–640. (In Persian).
- Kiani-Harchegani, M. and Sadeghi, S.H.R., 2017. Effects of consecutive storms on splash erosion components for two different rainfall intensities under laboratory conditions. Iranian Journal of Ecohydrology, 4 (3), 837–846. (In Persian).
- Kiani-Harchegani, M., Sadeghi, S.H.R., and Asadi, H., 2017a. Changeability of concentration and particle size distribution of effective sediment in initial and mature flow generation conditions under different slops and rainfall intensities. Iranian Journal of Watershed Engineering and Management, 9 (2), 205–216. (In Persian).
- Kiani-Harchegani, M., Sadeghi, S.H.R., and Asadi., H., 2017b. Inter-storm variability of coefficient of variation of runoff volume and soil loss during rainfall and erosion simulation replicates. Iranian Journal of Ecohydrology, 4 (1), 191–199. (In Persian).
- Kinnell, P.I.A., 2000. The effect of slope length on sediment concentrations associated with side-slope erosion. Soil Science Society of American Journal, 64 (3), 1004–1008. doi:10.2136/sssaj2000.6431004x
- Kinnell, P.I.A., 2005. Raindrop-impact-induced erosion processes and prediction: a review. Hydrological Processes, 19, 2815–2844. doi:10.1002/(ISSN)1099-1085
- Kinnell, P.I.A., 2016. A review of the design and operation of runoff and soil loss plots. Catena, 145, 257–265. doi:10.1016/j.catena.2016.06.013
- Kukal, S.S. and Sarkar, M., 2011. Laboratory simulation studies on splash erosion and crusting in relation to surface roughness and raindrop size. Journal of Indian Society of Soil Science, 59 (1), 87–93.
- Lal, R., 1976. Soil erosion problems on alfisols in western Nigeria and their control. IITA Monograph, 1. Ibadan, Nigeria: IITA.
- Mangiafico, S.S., 2015. An R companion for the handbook of biological statistics, version 1.09c. New Brunswick, NJ: Rutgers Cooperative Extension, 274 p. Available from: http://rcompanion.org/documents/RCompanionBioStatistics.pdf
- Martinez-Mena, M., Castillo, V., and Albaladejo, J., 2002. Relations between inter-rill erosion processes and sediment particle size distribution in a semiarid Mediterranean area of SE of Spain. Geomorphology, 45 (3–4), 261–275. doi:10.1016/S0169-555X(01)00158-1
- Mohammadkhan, S., Ahmadi, H., and Jafari, M., 2011. Relationship between soil erosion, slope, parent material, and distance to road (Case study: latian Watershed, Iran). Arabian Journal of Geosciences, 4, 331–338. doi:10.1007/s12517-010-0197-z
- Peart, M.R. and Walling, D.E., 1982. Particle size characteristics of fluvial suspended sediment. In: D.E. Walling, ed. Recent developments in the explanation and prediction of erosion and sediment yield. Wallingford, Oxford, UK: IAHS Press, Institute of Hydrology, pp. 397–407, IAHS Publ. No. 137.
- Rodrigo Comino, J., et al., 2016a. Quantitative comparison of initial soil erosion processes and runoff generation in Spanish and German vineyards. Science of the Total Environmet, 565, 1165–1174. doi:10.1016/j.scitotenv.2016.05.163
- Rodrigo Comino, J., et al., 2016b. Quantitative comparison of initial soil erosion processes and runoff generation in Spanish and German vineyards. Science of the Total Environment, 565, 1165–1174. doi:10.1016/j.scitotenv.2016.05.163
- Rodrigo Comino, J., et al., 2017a. Understanding soil erosion processes in Mediterranean sloping vineyards (Montes de Málaga, Spain). Geoderma, 296, 47–59. doi:10.1016/j.geoderma.2017.02.021
- Rodrigo-Comino, J., et al., 2017b. Assessment of agri-spillways as a soil erosion protection measure in Mediterranean sloping vineyards. Journal of Mountain Science, 14 (6), 1009–1022. doi:10.1007/s11629-016-4269-8
- Sadeghi, S.H.R., et al., 2017b. Non-Point source contribution and dynamics of soluble and particulate phosphorus from main tributaries of the Zarivar Lake Watershed, Iran. Environmental Monitoring and Assessment, 189 (238), 1–13. doi:10.1007/s10661-017-5937-z
- Sadeghi, S.H.R., Abdollahi, Z., and Khaledi Darvishan, A., 2013. Experimental comparison of some techniques for estimating natural raindrop size distribution on the south coast of the Caspian Sea, Iran. Hydrological Sciences Journal, 58 (6), 1374–1382. doi:10.1080/02626667.2013.814917
- Sadeghi, S.H.R. and Hazbavi, Z., 2015. Trend analysis of the rainfall erosivity index at different time scales in Iran. Natural Hazards, 77, 383–404. doi:10.1007/s11069-015-1607-z
- Sadeghi, S.H.R. and Kiani Harchegani, M., 2012. Effects of sand mining on suspended sediment particle size distribution in Kojour forest river. Iranian Journal of Agricultural Science and Technology, 14, 1637–1646.
- Sadeghi, S.H.R., Kiani Harchegani, M., and Asadi, H., 2017a. Variability of particle size distributions of upward/downward splashed materials in different rainfall intensities and slopes. Geoderma, 290, 100–106. doi:10.1016/j.geoderma.2016.12.007
- Sarmadian, F., Rahimy, P., and Keshavarzi, A., 2010. Modeling of sediment yield and bicarbonate concentration in Kordan Watershed. Journal of Agricultural Science and Technology, 12, 121–131.
- Schiettecatte, W., et al., 2008. Enrichment of organic carbon in sediment transport by inter-rill and rill erosion processes. Soil Science Society of American Journal, 72 (1), 50–55. doi:10.2136/sssaj2007.0201
- Seeger, M., 2007. Uncertainty of factors determining runoff and erosion processes as quantified by rainfall simulations. Catena, 71, 56–67. doi:10.1016/j.catena.2006.10.005
- Shi, Z.H., et al., 2012. Soil erosion processes and sediment sorting associated with transport mechanisms on steep slopes. Journal of Hydrology, 454-455, 123–130. doi:10.1016/j.jhydrol.2012.06.004
- Shi, Z.H., et al., 2013. Effects of mulch cover rate on inter-rill erosion processes and the size selectivity of eroded sediment on steep slopes. Soil Science Society of American Journal, 77 (1), 257–267. doi:10.2136/sssaj2012.0273
- Slattery, M.C. and Burt, T.P., 1997. Particle size characteristics of suspended sediment in hillslope runoff and stream flow. Earth Surface Processes and Landforms, 22 (8), 705–719. doi:10.1002/(ISSN)1096-9837
- Sutherland, R.A., et al., 1996. Splash and wash dynamics: an experimental investigation using an Oxisol. Geoderma, 69, 85–103. doi:10.1016/0016-7061(95)00053-4
- Teixeira, P.C. and Misra, R.K., 1997. Erosion and sediment characteristics of cultivated forest soils as affected by the mechanical stability of aggregates. Catena, 30, 119–134. doi:10.1016/S0341-8162(97)00023-4
- Thompson, J., et al., 2016. Event-Based total suspended sediment particle size distribution model. Journal of Hydrology, 536, 236–246. doi:10.1016/j.jhydrol.2016.02.056
- Vaezi, A.R., et al., 2016. Modeling sediment yield in semi-arid pasture micro-catchments, NW Iran. Land Degradation and Development, 28 (4), 1274–1286. doi:10.1002/ldr.2526
- Walling, D.E., et al., 2000. The particle size characteristics of fluvial suspended sediment in the Humber and Tweed catchments, UK. Science of the Total Environment, 251, 205–222. doi:10.1016/S0048-9697(00)00384-3
- Wang, L. and Shi, Z.H., 2015. Size selectivity of eroded sediment associated with soil texture on steep slopes. Soil Science Society of American Journal, 79 (3), 917–929. doi:10.2136/sssaj2014.10.0415
- Wang, Y., et al., 2016. Impact of tillage erosion on water erosion in a hilly landscape. Science of the Total Environment, 551, 522–532. doi:10.1016/j.scitotenv.2016.02.045
- Yan, F.L., et al., 2008. Estimating inter-rill soil erosion from aggregate stability of Ultisols in subtropical China. Soil and Tillage Research, 100 (1), 34–41. doi:10.1016/j.still.2008.04.006
- Young, R.A. and Onstad, C.A., 1978. Characterization of rill and inter-rill eroded soil. Transactions of the ASAE, 21 (6), 1126–1130. doi:10.13031/2013.35454
- Zhang, S., et al., 2017. The influence of changes in land use and landscape patterns on soil erosion in a watershed. Science of the Total Environment, 574, 34–45. doi:10.1016/j.scitotenv.2016.09.024