
ABSTRACT
The rapid growth of population and agricultural and industrial activities has caused an increase in demand on the Jeffara aquifers of Gabes (southeast Tunisia). In fact, the over-pumping of this aquifer system has resulted in water-level declines ranging from 0.25 to 1 m/year during the past three decades. The aim of this study is to identify favourable artificial recharge sites of this aquifer system based on the combined use of remotely sensed data, a geographic information system (GIS), the Shuttle Radar Topography Mission (SRTM) product and a multiple criteria decision making (MCDM) technique. The delineation of artificial recharge zones shows high to moderate potential for groundwater recharge (40%) in the Gabes region, with high precision of good potential proposed sites. Recharge processes need to account for natural conditions and ecosystems.
Editor R. Woods Associate editor A. Fiori
1 Introduction
Groundwater resources play a major role in our lives, as well as those of some terrestrial and aquatic ecosystems (Magesh et al. Citation2012, Shekhar and Pandey Citation2015), and thus in socio-economic development (Pinto et al. Citation2015). The estimation of the World Water Assessment Program in 2003 showed that groundwater provides approximately 50% of water used in global domestic water supplies, 40% of water used in industrial activity and 20% of water used in irrigated agriculture (Foster and Loucks Citation2006).
In recent decades, water demand has increased intensively, mainly in arid and semi-arid regions of the Middle East and North Africa. Furthermore, it is used for a variety of purposes such as domestic, industrial and agricultural uses (Schmidt et al. Citation2008, Chenini et al. Citation2010, Mohanty et al. Citation2013). Unfortunately, this natural resource has become both a blessing and a challenge in these areas due to excessive water exploitation (Murthy Citation2000, Ben Kabbour and Zouhri Citation2004, Ben Kabbour et al. Citation2005, Gaur et al. Citation2011). In these regions, many coastal water tables are over-exploited (Fedrigoni et al. Citation2001, Sophocleous Citation2002, Kouzana et al. Citation2009, Yeh et al. Citation2009, Wada et al. Citation2010, Zouhri Citation2010, Nag and Ghosh Citation2013, Zghibi et al. Citation2013). The over-use of groundwater is causing many problems, such as a decrease of piezometric levels, deterioration of water quality, water pollution and water exhaustion; hence a water stress condition has been created. To contend with these hydraulic crises, it is necessary to search urgently for an effective technique as well as time for planning, utilization, administration and management of groundwater resources (Singh et al. Citation2017).
In the past few decades, the water table of the Gabes region, which is the object of the present study, has been overexploited, and the natural recharge has decreased due to the apparent reduction of rainfall. Hence, the result is an imbalance between water resources and the recharge demand. This coastal region is characterized by drought conditions due to irregular variations of rainfall, high evaporation rates equal to 200 mm in July and, most importantly, water scarcity. In order to restore the water level to its normal state, the proposed methodology in this study integrates use of GIS, remote sensing, SRTM (Shuttle Radar Topography Mission) and MCDM (multiple criteria decision making) techniques, which are well known as powerful and useful methods where the main objectives are achieved by identification and delineation of favourable artificial recharge sites (Sirinivasa Rao and Jugran Citation2003). This methodology is also well known as a powerful tool for groundwater resources management, particularly in arid environments (Abdallah Citation2012). Various studies have been interested in the delineation of groundwater potential zones and groundwater evaluation using geoscience technologies. These processes form an important tool in water studies due to their ability in developing spatiotemporal information and their efficiency in spatial data analysis. Previous works include the implication of remote sensing in groundwater exploration (Raju et al. Citation1986) and especially in groundwater prospecting in hard rocks (Prasad et al. Citation2008) and soft rocks (Shahid et al. Citation2000), and geological and geomorphological features in groundwater exploration (Krishnamurthy and Srinivas Citation1995). Remote sensing data have been used with GIS techniques for land, management and water resources assessment (Chi and Lee Citation1994, Murthy Citation2000, Sener et al. Citation2005, Ganapuram et al. Citation2009, Nagarajan and Singh Citation2009, Ghorbani Nejad et al. Citation2017). The implication of remote sensing and GIS techniques has been identified in hydrological modelling processes (Saraf et al. Citation2004) and in the management and development of groundwater resources (Jha et al. Citation2007, Gaur et al. Citation2011). Remote sensing and GIS have been integrated in the assessment of the groundwater recharge potential zone (Ghayoumian et al. Citation2007, Oikonomidis et al. Citation2015, Yeh et al. Citation2016), in the identification of suitable areas for artificial recharge estimation (Subagunasekar and Sashikkumar Citation2012) and in disasters and risk reduction in groundwater (Ayazi et al. Citation2010, Senanayake et al. Citation2016).
However, demarcation of potential sites for artificial recharge is based on knowledge-driven factor analysis, integrating different themes such as lineament density, drainage density, slope, soil types, land use/land cover, lithology, rainfall and geomorphology. The thematic layers mentioned in this study were enhanced using GIS, remote sensing, SRTM, MCDM and conventional data. These themes were assigned with proper weights based on their major and minor effects on the groundwater recharge potential area. These layers were then integrated in the GIS platform to manage, utilize and classify the results of remote sensing, to explore the diversity of recharges sites, to couple the themes of recharge potential, and finally to provide weight relationships (Krishnamurthy et al. Citation1996, Saraf and Choudhury Citation1998, Sener et al. Citation2005).
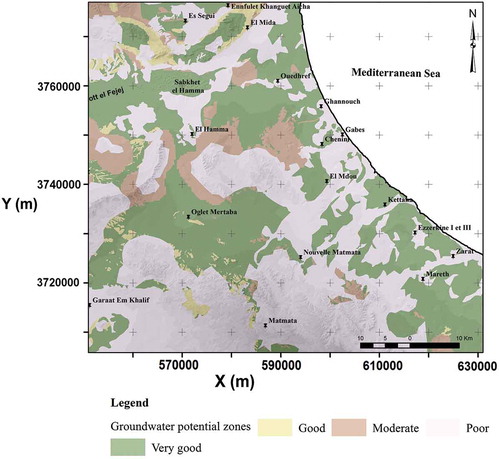
Consequently, a groundwater potential zones map was obtained to improve water resources management in Gabes. The area was divided into four parts: Very good (40%), Good (13%), Moderate (18%) and Poor (29%).
2 General description of study area
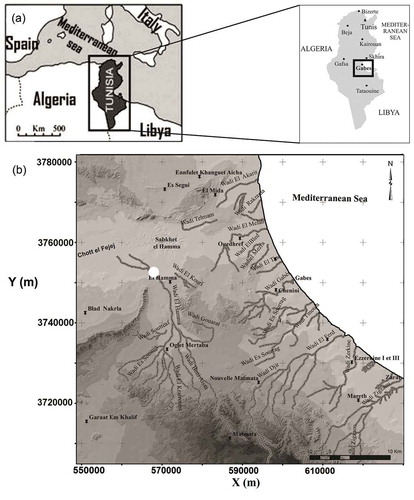
The study area () is located in the southeast of Tunisia. Geographically, Gabes is situated between X = 550 000, X = 620 000 and Y = 3 700 000, Y = 3 770 000 (UTM geographic projection system). It belongs to the Jeffara basin, which extends from the Skhira region in the north to Libyan territory in the south.
A 30-year analysis of rainfall data in the Gabes region has shown an average of 162 mm/year (General Department of Water Resources Citation2015), of which more than 75% occurs from September to March. Analysis of the results shown in )–() shows that the monthly rainfall distribution during the period 1985–2015 was seasonal. The precipitation in the study area was recorded from October to March, and the dry period varied between April and September. During the autumn and winter seasons, the rainfall rate is very significant, but it is moderate in spring and low to very low in summer.
Gabes is characterized by an average annual temperature of 19–22°C but sometimes exceeds this. The estimation of water balance parameters is based on a monthly calculation for each station (). The potential evapotranspiration (PET) estimated by the Thornthwaite method is very high (1066 mm/year) and largely exceeds the rainfall. The actual evapotranspiration (AET) is about 178 mm/year. The infiltration is equal to 45.36 mm/year. To calculate runoff, we apply the Tixeront-Berkaloff formula:
Table 1. Water balance parameters. R: rainfall; PET: potential evapotranspiration; AET: actual evapotranspiration; RUPS: reserve useful for plant survival (max. = 32).
where R is runoff (m), P is rainfall (m) and PET is potential evapotranspiration (m). Thus, from the above data, R = (0.162)3/3 × 1.066 = 0.00151 m/year = 1.51 mm/year.
The area is crossed by nine main rivers (): El Akarit, Gabes, Sourag I and II, Jir, El Fared, Zigzaou, El Malah and El Hamma, which are seasonal rivers. These hydrographic networks flow into the sea or into the endoreic depressions (Sabkhas). The topography of the study area is a plain with irregular landforms, and the relief of the area varies between 55 and 650 m a.m.s.l. The geological series presented in this area are from Triassic to Quaternary.
Figure 1. Location map of Tunisia and the Gabes region (projection system: TUN UTM; datum: WGS_1984; zone: 32).
Many normal faults affect the Jurassic, Cretaceous and Cenozoic geological series (Bouaziz Citation1995). Lithological study shows that the Gabes basin is formed of several lithological layers: sands and conglomerates, sandy clays, sands, limestone, dolomite, gypsum, halite and carbonates (see Section 4.3.7). Therefore, it can be deduced that the aquifer system of the Gabes region is a multilayered aquifer system. In this paper we are interested in the study of the phreatic groundwater table of a Mio-Plio-Quaternary aquifer. This aquifer is characterized by permeability varying from 0.09 × 10⁻⁶ to 88.1 × 10⁻⁴ m2/s, storage coefficient ranges from 1.2 × 10⁻⁴ to 21 × 10–2, and the transmissivity varies between 0.015 × 10⁻⁴ and 35.2 × 10⁻² m2 s−1 (Mekrazi Citation1975, Ben Baccar Citation1982, Alaya et al. Citation2014). Piezometric map analysis of the Mio-Plio-quaternary aquifer in 2015 showed that the hydraulic gradient varies between 5 × 10⁻⁴ and 1.6 × 10⁻³ and the general groundwater flow direction is from west to east and, more precisely, to the Mediterranean Sea ()).
Figure 2. (a) Correlation of rainfall with temperature and years. (b) Monthly rainfall variability at the climatological station Gabes SM in the period 1985–2015. (c) Correlation of rainfall–PET from Gabes SM station. (d) Abstraction of Mio-Plio-Quaternary aquifer in the Gabes region. (e) Piezometric map.
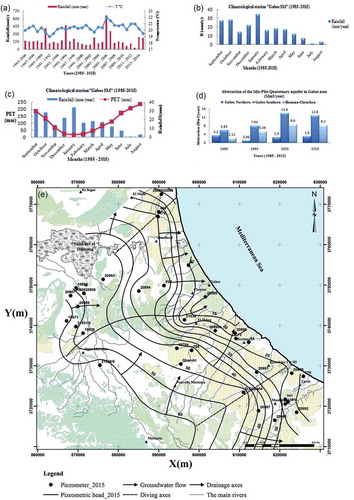
In an arid area such as the Gabes zone the amount of groundwater resources is limited due to the irregularity of rainfall and increasing water demand. It may be seen in ) that the exploitation rate increased progressively between 1985 and 2015. In the study area the main zone of groundwater extraction from the Mio-Plio-Quaternary aquifer is the Gabes southern area (1852 wells in 2015), with an abstraction rate equal to 142% in 2015 (General Department of Water Resources Citation2015). In addition to the exploitation by wells, the groundwater of the Gabes region is exploited by several springs (El Akarit, El Hamma, Gabes and El Aouinet rivers and Ras el Ayoun) to meet the growing demand for water. In the early 1990s, most of the springs were depleted due to overexploitation (Alaya et al. Citation2014).
3 Methodology
The methodology adopted for this study is shown in a flow chart (). The main focus was on the delineation and selection of suitable artificial recharge sites using integrated GIS, remote sensing, SRTM products and MCDM techniques. However, in order to demarcate artificial recharge zones, a multiparametric dataset including satellite data, geological and topographic maps and other conventional data was used. The main map of Gabes was prepared from the digitization of geological and topographic maps on a 1/100 000 scale.
Eight thematic layers – drainage lineament, drainage density, land use/land cover, slope, soil type, lithology, rainfall and geomorphology – were used for the demarcation of artificial recharge zones.
The lineament and drainage densities were prepared using the line density analysis tool in ArcGIS. The slope map was prepared from the DEM data extracted from SRTM global 1-arcsecond (30-m) in Arc-info 10.1 software; slopes were calculated from the elevation contours. The rainfall map was obtained after the calculation of average annual rainfall using monthly data for our study area over 30 years (1985–2015) published by the General Department of Water Resources. Then, an interpolation technique using kriging on a Surfer platform was used to obtain the rainfall spatiotemporal distribution map. The study area lithological map was prepared by assembling, georectifying and digitizing six geological maps (Gabes, El Hamma, Mareth, Oglet El Marteba, Matmata, Tamazret) on a 1/100 000 scale, produced by the National Office of Mines. The soil type map was produced by the General Department of Water Resources and the geomorphological map was produced by the National Office of Mines, and was subsequently geo-rectified and digitized. The land-use/land-cover data were obtained following the processing of satellite images from the Landsat 8 Sensor on a scale of 1/500 000 (geo-coded, with UTM projection, spheroid and datum WGS 1984, zone 32N) by ENVI and then converted into raster format (30-m resolution) before being brought into the GIS platform. Groundwater recharge potential zones in the Gabes region were demarcated by overlaying all the thematic maps in terms of weighted overlay methods using the spatial modelling tools in ArcGIS 10.1. This was influenced by eight factors: lineament density, drainage density, rainfall, slope, land use/land cover, lithology, soil type and geomorphology. Diverse features of each factor were also assigned weights on a scale of 1–8, corresponding to their relative importance for recharge potential (Saaty Citation1980, Shaban et al. Citation2006). Qualitative evaluation of the different features of a given theme was performed based on the assigned weights as follows: Poor (weight = 1–2), Moderate (2–4), Good (4–6) and Very Good (6–8) (Saaty Citation1980, Shaban et al. Citation2006).
The weighted linear combination method was adopted to develop the groundwater recharge index of each pixel (Senanayake et al. Citation2016) in the Gabes region by:
where Pr is the groundwater recharge potential index, RF is the rainfall index, LG is the lithology index, GG is the geomorphology index, SG is the slope index, LD is the lineament density index, DD is the drainage density index, LC is the land-use/land-cover index, and SC is the soil cover index. The subscripts w and r refer, respectively, to the weight of a theme and the rate of individual features of a theme (Yeh et al. Citation2014, Citation2016).
4 Results and discussion
4.1 Weighted calculation of factors influencing the potential zones
In this study eight significant interdependent factors contribute in delineating groundwater potential zones.
In the Gabes region, the diagram of groundwater recharge potential is used (). The effect of each minor and major factor is assigned a weight of 0.5 or 1.0, where 1.0 is assigned for major interrelationship existing between two factors, while 0.5 is assigned for a minor interrelationship between two factors. Finally, the cumulative weight for each factor is considered in order to calculate the recharge potential factor weight:
shows the scores assigned to the parameters influencing each recharge potential factor.
Table 2. Scores assigned to the parameters influencing each recharge potential factor (modified after Krishnamurthy et al. Citation1996, Edet et al. Citation1998, Shahid et al. Citation2000, Jaiswal et al. Citation2003, Shaban et al. Citation2006, Magesh et al. 2011, Kaliraj et al. Citation2014, Oikonomidis et al. Citation2015, Senanayake et al. Citation2016, Yeh et al. Citation2016)..
4.2 Establishing potentially related groundwater recharge factors
4.2.1 Lineament density factor
Lineaments are simple and complex linear properties of geologic structures such as faults, fractures and discontinuity surfaces detected by remote sensing (O’Leary et al. Citation1976).
Using lineaments in the present study is very important in terms of the hydrogeology because they provide the pathways for groundwater movement (Abdalla Citation2012). The lineament density factor is given by:
where is the total length of the lineaments [L] and A is the unit area [L2].
A high lineament-length density provides better targets for groundwater recharge than joints, with high levels of potential groundwater recharge (Edet et al. Citation1998, Haridas et al. Citation1998, Yeh et al. Citation2016). In the study area, lineaments were extracted from the SRTM data and the geological map using the Geomatica 2015 platform.
The lineament density map was prepared using the line density analysis tool in ArcGIS 10.1. For the Gabes region, the lineament density map () shows that high lineament density is observed in the relief, with values ranging from 1 to 1.5 km/km2.
The statistical processing of lineaments enumerates about 320 lineaments. To represent the results of their arrangement, we realized a rose diagram of directional families grouped into 10° classes. The rose diagram () shows the clear dominance of a major NNW–SSE direction of lineaments. This corresponds to the general direction of deformation stress related to the compressive tectonic phase of Miocene age responsible for the structuring of this region (Zargouni Citation1985, Dlala Citation1995, Msaddek et al. Citation2016).
4.2.2 Drainage density factor
Drainage density indicates the measure of the total length of all orders per unit area (Shekhar and Pandey Citation2015). In this study, a drainage network of the Gabes zone was created manually from the topographic maps (1:100 000 scale). In order to calculate drainage density, the drainage line density analysis tool in ArcHydro 10.1 (in ArcGIS software) was used:
where is the total length of the drainage network [L] and A is the unit area [L2].
The drainage density is correlated with the groundwater recharge, because the groundwater potential recharge is related to permeability and surface runoff (Krishnamurthy et al. Citation1996, Magesh et al. Citation2012, Huang et al. Citation2013). The zone with high drainage density has a high level of groundwater recharge (Shaban et al. Citation2006). The drainage density map in the study can be divided into four classes: Very Good (2.5–3.5 km), Good (1.5–2.5 km), Moderate (1–1.5 km) and Poor (0–1 km). High drainage (2.5–3.5) was recorded in the relief of the study area. The drainage density potential evaluation is shown in .
4.2.3 Slope factor
The slope gradient is a very important factor for the identification favourable sites for artificial recharge because it directly influences the infiltration of surface water (Selvam et al. Citation2015). On steep slopes, the level of recharge is low as water flows rapidly downwards, having insufficient time to infiltrate (Machiwal et al. Citation2011). However, slight slopes facilitate groundwater recharge, due to the extensive high retention of rainwater.
In the present study area, the slope map () was prepared based on SRTM data using the spatial analysis tool in ArcGIS 10.1. Based on the slope map, the Gabes zone was subdivided into three categories. The first category (0–2) is assigned Very Good for artificial recharge because of the nearly flat terrain and high infiltration; in the second category (2–4), slopes are considered as Moderate for groundwater storage with some runoff. The third category, considered as Poor, could show a difference due to the runoff and infiltration variations; it is categorized with an intensity of 4–10 in the presence of high runoff and low infiltration and with an intensity exceeding 10 in the presence of relatively very high runoff.
4.2.4 Soil types factor
The study of soil cover is an essential factor in delineating groundwater recharge potential zones (Punmia and Jain Citation2005).
The infiltration of surface water into an aquifer system is dependent on soil type. Based on the infiltration rate, texture, depth, drainage condition and water transmission capacity (Viessman et al. Citation1989), soils are classified into different hydrological soil classes: A, B, C and D ().
Table 3. Criteria for classification of hydrological soil group (Chow et al. 1988, Viessman et al. Citation1989).
Soil study shows that the Gabes region belongs to hydrological soil groups A and D. Group A covers about three-quarters of the area while the rest of the surface is covered by D group soil ().
4.2.5 Rainfall factor
We collected rainfall data for 30 years (1985–2015) from the General Department of Water Resources for 10 raingauge stations. Annual average rainfall of the study area is around 162 mm/year.
According to the data from the meteorological station of Gabes SM, located in Gabes city (X = 601855.68; Y = 3750275.386), we can conclude that the rainfall increases near the coast, and decreases gradually as we move away from the coast ().
The correlation between precipitation and elevation shows that precipitation decreases progressively with increasing altitude (). Based on the rainfall map and the precipitation–elevation correlation, it can be seen that the higher the rainfall is the higher the groundwater potential becomes. The resulting map was classified into five major classes (): 10–50 mm/year (Poor), 50–100 mm/year (Moderate), 100–150 mm/year (Good), 150–200 mm/year (Good), and <200 mm/year (Very Good). In the study area, the rainfall factor was assigned a weight of 10% in the total groundwater potential value.
Figure 3. Schematic representation of the methodology adopted to delineate the groundwater recharge potential zone of the Gabes region.
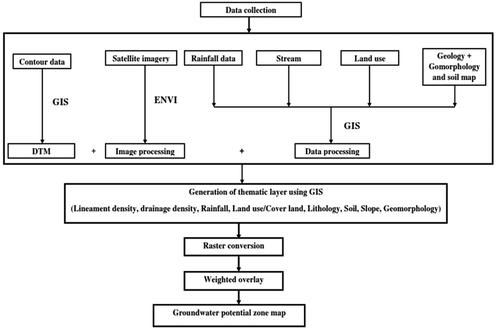
Figure 4. Interrelationship between the multiple influencing factors concerning the recharge property.
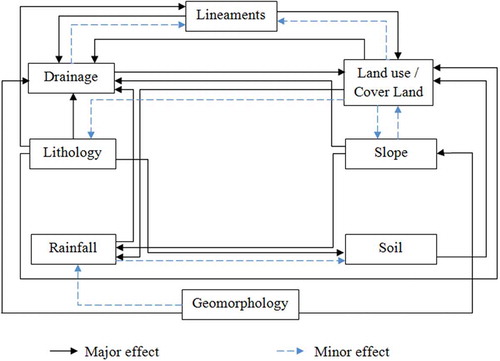
Figure 5. Lineament density map of the Gabes region.
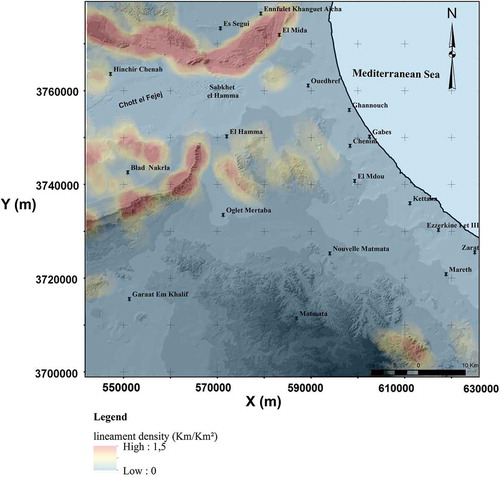
Figure 6. Rose diagram of the lineament orientation in the Gabes region.
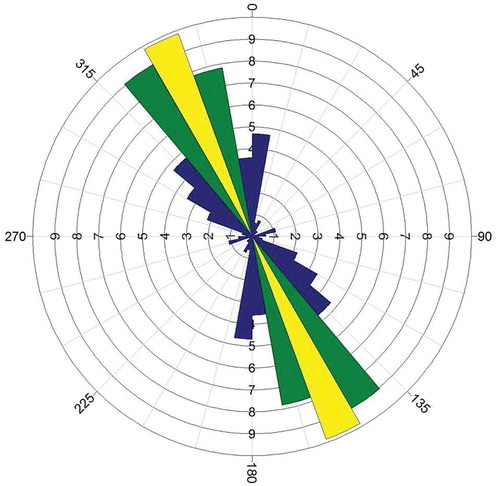
Figure 7. Drainage density map of the Gabes region.
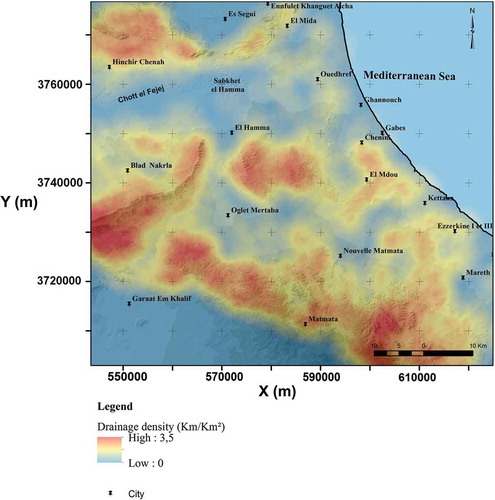
Figure 8. Slope map of the Gabes region.
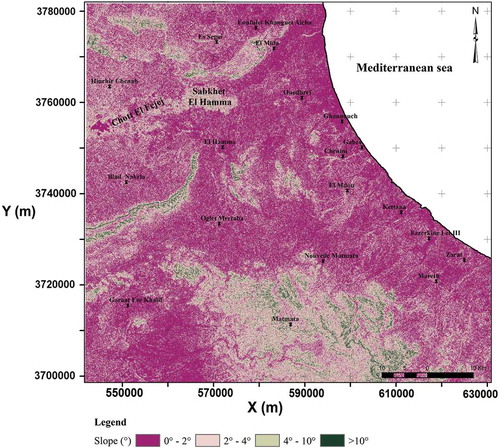
Figure 9. Soil types map of the Gabes region.
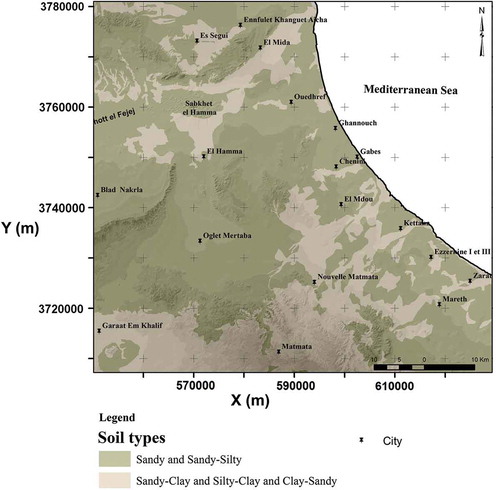
Figure 10. Rainfall map of the Gabes region.
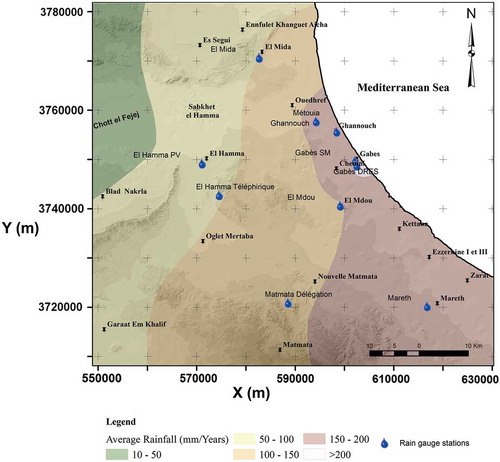
Figure 11. Correlation between precipitation (P) and elevation.
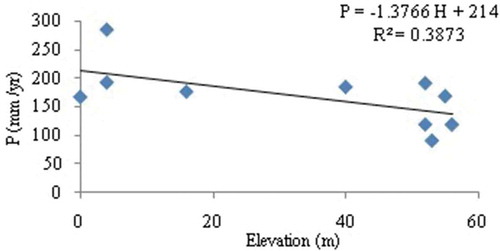
Figure 12. Land-use/land-cover map of the Gabes region.
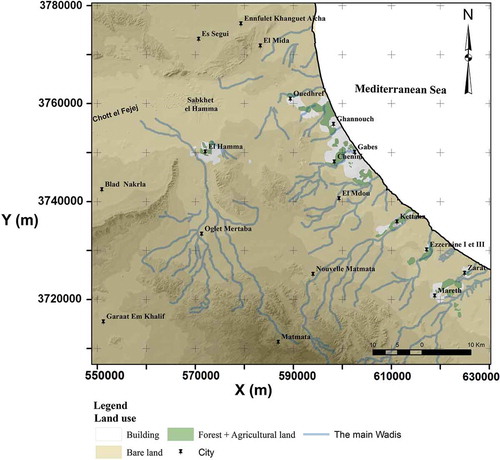
Figure 13. Lithology map of the Gabes region.
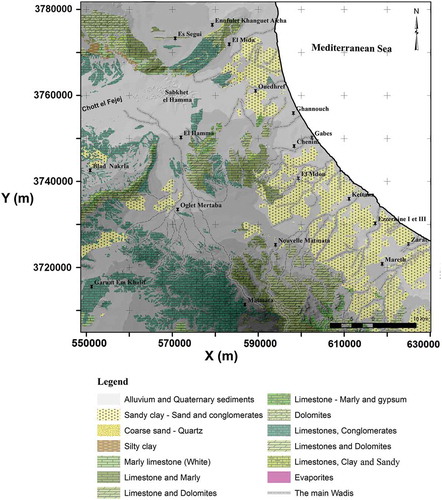
Figure 14. Geomorphology map of the Gabes region.
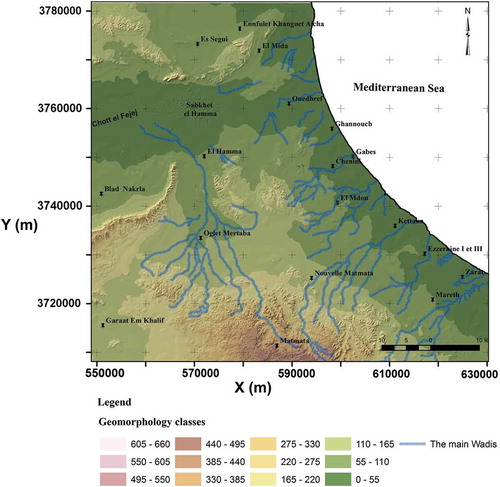
Figure 15. Distribution of groundwater potential classes in the Gabes region.
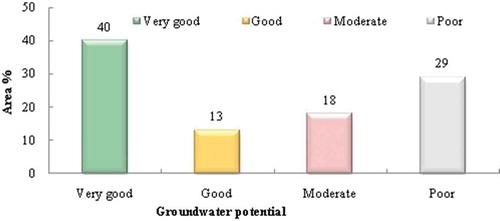
Figure 16. Groundwater recharge potential zone map of the Gabes study area.
4.2.6 Land-use/land-cover factor
Land use/land cover is an important factor in the groundwater potential zone identification (Shaban et al. Citation2006). The use of this factor makes it possible to define the distribution of buildings and vegetation cover areas. These land-use classes were interpreted from Landsat 8 OLI/TIRS satellite imagery. In the satellite imagery, the soil deposit cover is identified with beige colour, the vegetation areas are identified with contrasting green and the built-up land is white.
Analysis of the land-use/land-cover map () shows that around 90% of the total area is represented by bare land and built-up land, and the other 10% is represented by forests and agricultural lands.
4.2.7 Lithology factor
The type of lithology affects groundwater recharge by supervising water flow percolation (El-Baz et al. Citation1995), and afterwards it is associated with water permeability (Oikonomidis et al. Citation2015).
The lithology map () shows that the Gabes region is overlain by alluvium and Quaternary sediments, which are distributed over almost 70% of the total area. There is also sandy clay (sand and conglomerates) of lower Pleistocene to Mio-Pliocene age and coarse sand of Miocene age. The reliefs are covered by marly limestone and dolomites of Cretaceous age. In this study, the lithology factor was assigned a weight of 33% in the total groundwater potential value.
4.2.8 Geomorphology factor
The geomorphology of an area has a dominant role in evaluating the movement and storage of groundwater (Dinesh Kumar et al. Citation2007). The topography of the Gabes region is composed mostly of plains and low landforms, and the relief of the area varies between 165 and 605 m a.m.s.l. (). Mountains and high landforms are present in the southern part of the study area and in a limited region on the northern side. These characteristics favour the composition of eolian deposits, floodplain deposits, salt-evaporate deposits and pediment in a large part of the region. Rocky outcrops are present in a small portion of the study area. These geomorphological features have Good to Poor potential for groundwater recharge.
4.3 Delineation of the groundwater recharge zone
The groundwater recharge potential zone in the Gabes region was delineated by assigning weights to various classes in each factor based on their contributions in recharging. The resulting total weighting assessment is shown in . This approach has been used by several researchers, and it has been shown that this method gives precise results (Shahid et al. Citation2000).
Table 4. Classification of various factors for delineation of groundwater potential zones.
The demarcation of groundwater potential zones of the Gabes region was based on the integration of thematic maps (lineament density, drainage density, slope, land use/land cover, lithology, soil types, rainfall and geomorphology) using GIS, SRTM and remote sensing data and the MCDM techniques. The different maps were considered as layers. ArcMap tools were used to overlay the different layers, after considering the weight/rate assessment. Finally, the resulting map reveals the groundwater potential zones in the Gabes region.
The total weight in this study area was calculated using a weighted linear combination method (Equation (2)), as 22 + 38.75 + 80 + 16.5 + 27.5 + 8 + 28 + 25 = 245.75. Using a value of 246, this leads to the following percentages of factor effect on the recharge artificial capacity:
Lineaments density = (22/246) × 100 = 9%
Land use/land cover = (38.75/246) × 100 = 16%
Lithology = (80/246) × 100 = 33%
Drainage density = (16.5/246) × 100 = 7%
Slope = (27.5/246) × 100 = 11%
Rainfall = (25/246) × 100 = 10%
Soil types = (8/246) × 100 = 3%
Geomorphology = (28/246) × 100 = 11%
The distribution of groundwater potential classes in the Gabes region is presented in and .
Table 5. Groundwater recharge potential zones and categorization.
The groundwater potential recharge zone map of the Gabes region () shows that areas of Very Good groundwater potential occupy the largest part of the study area (4607 km2; ).
However, to measure the quantity of water recharged to subsurface media in the Gabes region, a simplified calculation for the proposed recharge rates is used (UN Citation1967). The estimation of total recharged water volume (W) is calculated as:
where P is precipitated volume, R is the recharge ratio and A is % of area. Thus, W (m3/year) = 530 × 106[(0.475 × 0.40) + (0.325 × 0.13) + (0.18 × 0.15) + (0.075 × 0.29)] = 530 × 106 × 0.28 = 148.4 × 10⁶ m3/year.
The Mio-Plio-Quaternary aquifer is overexploited due to an increase in demand for water for irrigation, agriculture, domestic and industrial activities, and drought in the study region. This overpumping of groundwater resulted in a resources deficit of 7.60 hm3/year in the year 2015 (General Department of Water Resources Citation2015). According to our statistical study, 28% (148.4 × 10⁶ m3/year) of the precipitation received in the study area is infiltrating downward to recharge the groundwater reservoirs and water bodies, and the rest is lost in the form of either evapotranspiration or surface runoff.
5 Conclusion
The Gabes region is located in the southeastern part of Tunisia. In recent years, it has become known for both demographic and socio-economic growth. The excessive pumping of groundwater in the study area has resulted from a decrease in its piezometric level.
In this study, an artificial recharging technique was applied as an effective tool for water resources management. The present study was carried out to propose a methodology for delineating groundwater recharge potential zones in Gabes. An integrated approach for assessing the characteristics of groundwater recharge potential using remote sensing, GIS, SRTM and MCDM techniques was proposed, aiming to minimize time and money in order to be able to make quick decisions for sustainable water resources management by this powerful methodology. Landsat OLI/TIR data, geological and topographic maps were used to prepare thematic layers of land use/land cover, lineament density, drainage density, lithology, slope, rainfall, geomorphology and soil type maps. The various thematic layers were integrated on a GIS environment employing the weighted linear combination method to prepare a groundwater potential zone map. Finally, the results indicated that Gabes is characterized by different zones, namely, Very good, Good, Moderate, Poor. Around 40% of the total area corresponds to the Very good. The weighted linear combination method allows us to demarcate the favourable sites for artificial recharge in the study area using remote sensing, GIS and SRTM techniques as well as MCDM, despite the data scarcity in terms of quantity and quality. Furthermore, the result of the present study will serve as a guideline for planning future water resource management projects in the Gabes region in order ensure sustainable groundwater use. On the whole, it can be concluded that the method can be applied in other areas of the world experiencing water stress conditions for the exploration of suitable sites. The method applied to assess artificial recharge needs to be integrated with other processes that were neglected in this paper, when the research deals with the correlation between the excessive pumping of groundwater in the study area and the decrease in its piezometric level; this correlation needs to be quantified.
Acknowledgements
The research was supported by the Tunisian Ministry of Higher Education and Tunis El Manar University with the collaboration of the UniLaSalle-Beauvais Polytechnic Institute (France).
Disclosure statement
No potential conflict of interest was reported by the authors.
References
- Abdalla, F., 2012. Mapping of groundwater prospective zones using remote sensing and GIS techniques: a case study from the Central Eastern Desert, Egypt. Journal of African Earth Sciences, 70, 8–17. doi:10.1016/j.jafrearsci.2012.05.003
- Alaya, M.B., et al., 2014. Suitability assessment of deep groundwater for drinking and irrigation use in the Djeffara aquifers (northern Gabes, south-eastern Tunisia). Environmental Earth Sciences, 71 (8), 3387–3421.
- Ayazi, M.H., et al., 2010. Disasters and risk reduction in groundwater: Zagros Mountain Southwest Iran using geoinformatics techniques. Disaster Advances, 3 (1), 51–57.
- Ben Baccar, B., 1982. Contribution à l’étude hydrogéologique de l’aquifère multicouche de Gabès Sud. Doctorat Thesis. Paris Sud France.
- Ben Kabbour, B., and Zouhri, L., 2004. Hydrochemical and bacteriological features of the groundwater: southern border of the Rharb basin (Morocco). Hydrological Sciences Journal, 50 (6), 1137–1149.
- Ben Kabbour, B., Zouhri, L., and Mania, J., 2005. Overexploitation and climate changes effects on groundwater yield and marine intrusion: considerations arising from the modelling of Mamora coastal aquifer, Morocco. Hydrological Processes, 19 (18), 3481–3797.
- Bouaziz, S., 1995. Etude de la tectonique cassante dans la plate-forme et l’Atlas sahariens (Tunisie méridionale): evolution des paléochamps de contraintes et implications géodynamiques. Thèse Doc. Etat, Univ. Tunis II, Tunisia.
- Chenini, I., Mammou, A.B., and El May, M., 2010. Groundwater recharge zone mapping using GIS-based multi-criteria analysis: a case study in Central Tunisia (Maknassy Basin). Water Resources Management, 24 (5), 921–939. doi:10.1007/s11269-009-9479-1
- Chi, K.H. and Lee, B.J., 1994. Extracting potential groundwater area using remotely sensed data and GIS techniques. In: Proceeding of the regional seminar on integrated applications of remote sensing and GIS for land and water resources management, Bangkok. Bangkok: Economic and Social Commission for Asia and the Pacific, 64–69.
- Dinesh Kumar, P.K., Gopinath, G., and Seralathan, P., 2007. Application of remote sensing and GIS for the demarcation of groundwater potential zones of a river basin in Kerala, southwest coast of India. International Journal of Remote Sensing, 28 (24), 5583–5601. doi:10.1080/01431160601086050
- Dlala, M., 1995. Evolution géodynamique et tectonique superposées en Tunisie : implication sur l’évolution géodynamique récente et la sismicité. Thèse En Sciences Géologique. Université de Tunis El Manar II.
- Edet, A.E., et al., 1998. Application of remote-sensing data to groundwater exploration: a case study of the Cross River State, southeastern Nigeria. Hydrogeology Journal, 6 (3), 394–404. doi:10.1007/s100400050162
- El-Baz, F., et al., 1995. Groundwater potential of the Sinai Peninsula, Egypt. Project Summary. Boston, MA: Center for Remote Sensing.
- Fedrigoni, L., et al., 2001. Origine de la minéralisation et comportement hydrogéochimique d’une nappe phréatique soumise à des contraintes naturelles et anthropiques sévères: exemple de la nappe de Djebeniana (Tunisie). Comptes Rendus de l’Académie des Sciences-Series IIA-Earth and Planetary Science, 332 (11), 665–671.
- Foster, S. and Loucks, D.P., 2006. Non-renewable groundwater resources: a guidebook on socially sustainable management for water policy makers. IHP series on Groundwater, (10). Paris: UNESCO
- Ganapuram, S., et al., 2009. Mapping of groundwater potential zones in the Musi basin using remote sensing data and GIS. Advances in Engineering Software, 40 (7), 506–518. doi:10.1016/j.advengsoft.2008.10.001
- Gaur, S., Chahar, B.R., and Graillot, D., 2011. Combined use of groundwater modeling and potential zone analysis for management of groundwater. International Journal of Applied Earth Observation and Geoinformation, 13 (1), 127–139. doi:10.1016/j.jag.2010.09.001
- General Department of Water Resources, 2015. Annuaires pluviométrique 1985–2015. Tunis: Ministère de l’Agriculture.
- Ghayoumian, J., et al., 2007. Application of GIS techniques to determine areas most suitable for artificial groundwater recharge in a coastal aquifer in southern Iran. Journal of Asian Earth Sciences, 30 (2), 364–374. doi:10.1016/j.jseaes.2006.11.002
- Ghorbani Nejad, S., et al., 2017. Delineation of groundwater potential zones using remote sensing and GIS-based data-driven models. Geocarto International, 32 (2), 167–187.
- Haridas, V.R., Aravindan, S., and Girish, G., 1998. Remote sensing and its applications for groundwater favourable area identification. Quarterly Journal of GARC, 6 (6), 18–22.
- Huang, -C.-C., et al., 2013. Groundwater recharge and exploitative potential zone mapping using GIS and GOD techniques. Environmental Earth Sciences, 68 (1), 267–280. doi:10.1007/s12665-012-1737-5
- Jaiswal, R.K., et al., 2003. Role of remote sensing and GIS techniques for generation of groundwater prospect zones towards rural development – an approach. International Journal of Remote Sensing, 24 (5), 993–1008. doi:10.1080/01431160210144543
- Jha, M.K., et al., 2007. Groundwater management and development by integrated remote sensing and geographic information systems: prospects and constraints. Water Resources Management, 21 (2), 427–467. doi:10.1007/s11269-006-9024-4
- Kaliraj, S., Chandrasekar, N., and Magesh, N.S., 2014. Identification of potential groundwater recharge zones in Vaigai upper basin, Tamil Nadu, using GIS-based analytical hierarchical process (AHP) technique. Arabian Journal of Geosciences, 7 (4), 1385–1401. doi:10.1007/s12517-013-0849-x
- Kouzana, L., Mammou, A.B., and Felfoul, M.S., 2009. Seawater intrusion and associated processes: case of the Korba aquifer (Cap-Bon, Tunisia). Comptes Rendus Geoscience, 341 (1), 21–35. doi:10.1016/j.crte.2008.09.008
- Krishnamurthy, J., et al., 1996. An approach to demarcate ground water potential zones through remote sensing and a geographical information system. International Journal of Remote Sensing, 17 (10), 1867–1884. doi:10.1080/01431169608948744
- Krishnamurthy, J. and Srinivas, G., 1995. Role of geological and geomorphological factors in ground water exploration: a study using IRS LISS data. International Journal of Remote Sensing, 16 (14), 2595–2618. doi:10.1080/01431169508954579
- Machiwal, D., Jha, M.K., and Mal, B.C., 2011. Assessment of groundwater potential in a semi-arid region of India using remote sensing, GIS and MCDM techniques. Water Resources Management, 25 (5), 1359–1386. doi:10.1007/s11269-010-9749-y
- Magesh, N.S., Chandrasekar, N., and Soundranayagam, J.P., 2012. Delineation of groundwater potential zones in Theni district, Tamil Nadu, using remote sensing, GIS and MIF techniques. Geoscience Frontiers, 3 (2), 189–196. doi:10.1016/j.gsf.2011.10.007
- Mekrazi, A. F., 1975. Contribution à l’étude géologique et hydrologique de la région de Gabès Nord. Diss. PhD Thesis. Faculty of Science, University of Bordeaux.
- Mohanty, S., et al., 2013. Comparative evaluation of numerical model and artificial neural network for simulating groundwater flow in Kathajodi–Surua Inter-basin of Odisha, India. Journal of Hydrology, 495, 38–51. doi:10.1016/j.jhydrol.2013.04.041
- Msaddek, M.H., et al., 2016. Fractures network analysis and interpretation in carbonate rocks using a multi-criteria statistical approach. Case study of Jebal Chamsi and Jebal Belkhir, south-western part of Tunisia. Journal of African Earth Sciences, 123, 99–109. doi:10.1016/j.jafrearsci.2016.07.016
- Murthy, K.S.R., 2000. Ground water potential in a semi-arid region of Andhra Pradesh-a geographical information system approach. International Journal of Remote Sensing, 21 (9), 1867–1884. doi:10.1080/014311600209788
- Nag, S.K. and Ghosh, P., 2013. Delineation of groundwater potential zone in Chhatna Block, Bankura District, West Bengal, India using remote sensing and GIS techniques. Environmental Earth Sciences, 70 (5), 2115–2127. doi:10.1007/s12665-012-1713-0
- Nagarajan, M. and Singh, S., 2009. Assessment of groundwater potential zones using GIS technique. Journal of the Indian Society of Remote Sensing, 37 (1), 69–77. doi:10.1007/s12524-009-0012-z
- O’Leary, D.W., Friedman, J.D., and Pohn, H.A., 1976. Lineament, linear, lineation: some proposed new standards for old terms. Geological Society of America Bulletin, 87 (10), 1463–1469. doi:10.1130/0016-7606(1976)87<1463:LLLSPN>2.0.CO;2
- Oikonomidis, D., et al., 2015. A GIS/remote sensing-based methodology for groundwater potentiality assessment in Tirnavos area, Greece. Journal of Hydrology, 525, 197–208. doi:10.1016/j.jhydrol.2015.03.056
- Pinto, D., et al., 2015. Delineation of groundwater potential zones in the Comoro watershed, Timor Leste using GIS, remote sensing and analytic hierarchy process (AHP) technique. Applied Water Science, 7(1), 503–519.
- Prasad, R.K., et al., 2008. Deciphering potential groundwater zone in hard rock through the application of GIS. Environmental Geology, 55 (3), 467–475. doi:10.1007/s00254-007-0992-3
- Punmia, B.C. and Jain, A.K., 2005. Soil mechanics and foundations. New Delhi: Firewall Media.
- Raju, K.C.B., et al., 1986. Analytical aspects of remote sensing techniques for ground water prospection in hard rocks. In: 6th Asian conference on remote sensing, Hyderabad, India, 127–132.
- Saaty, T.L., 1980. The analytic hierarchy process: planning, priority setting, resource allocation. New York, NY: McGraw-Hill International Book Company.
- Saraf, A.K., et al., 2004. GIS based surface hydrological modelling in identification of groundwater recharge zones. International Journal of Remote Sensing, 25 (24), 5759–5770. doi:10.1080/0143116042000274096
- Saraf, A.K. and Choudhury, P.R., 1998. Integrated remote sensing and GIS for groundwater exploration and identification of artificial recharge sites. International Journal of Remote Sensing, 19 (10), 1825–1841. doi:10.1080/014311698215018
- Schmidt, G., Subah, A., and Khalif, N., 2008. Climatic changes and water resources in the Middle East and North Africa. Environmental Science and Engineering, (23), 2941–2963.
- Selvam, S., et al., 2015. A GIS based identification of groundwater recharge potential zones using RS and IF technique: a case study in Ottapidaram taluk, Tuticorin district, Tamil Nadu. Environmental Earth Sciences, 73 (7), 3785–3799. doi:10.1007/s12665-014-3664-0
- Senanayake, I.P., et al., 2016. An approach to delineate groundwater recharge potential sites in Ambalantota, Sri Lanka using GIS techniques. Geoscience Frontiers, 7 (1), 115–124. doi:10.1016/j.gsf.2015.03.002
- Sener, E., Davraz, A., and Ozcelik, M., 2005. An integration of GIS and remote sensing in groundwater investigations: a case study in Burdur, Turkey. Hydrogeology Journal, 13 (5–6), 826–834. doi:10.1007/s10040-004-0378-5
- Shaban, A., Khawlie, M., and Abdallah, C., 2006. Use of remote sensing and GIS to determine recharge potential zones: the case of Occidental Lebanon. Hydrogeology Journal, 14 (4), 433–443. doi:10.1007/s10040-005-0437-6
- Shahid, S., Nath, S., and Roy, J., 2000. Groundwater potential modelling in a soft rock area using a GIS. International Journal of Remote Sensing, 21 (9), 1919–1924. doi:10.1080/014311600209823
- Shekhar, S. and Pandey, A.C., 2015. Delineation of groundwater potential zone in hard rock terrain of India using remote sensing, geographical information system (GIS) and analytic hierarchy process (AHP) techniques. Geocarto International, 30 (4), 402–421. doi:10.1080/10106049.2014.894584
- Singh, L.K., Jha, M.K., and Chowdary, V.M., 2017. Multi-criteria analysis and GIS modeling for identifying prospective water harvesting and artificial recharge sites for sustainable water supply. Journal of Cleaner Production, 142, 1436–1456. doi:10.1016/j.jclepro.2016.11.163
- Sophocleous, M., 2002. Interactions between groundwater and surface water: the state of the science. Hydrogeology Journal, 10 (1), 52–67. doi:10.1007/s10040-001-0170-8
- Srinivasa Rao, Y. and Jugran, D.K., 2003. Delineation of groundwater potential zones and zones of groundwater quality suitable for domestic purposes using remote sensing and GIS. Hydrological Sciences Journal, 48 (5), 821–833. doi:10.1623/hysj.48.5.821.51452
- Subagunasekar, M. and Sashikkumar, M.C., 2012. GIS for the assessment of the groundwater recharge potential zone in Karunkulam block, Thoothukudi district, Tamil Nadu, India. International Journal of Current Science, 15, 159–162.
- UN, 1967. Hydrogeologic map of Lebanon. Carte hydrogelogique du Liban au 1/100000 me, United Nations, Beyrouth, Lebanon.
- Viessman, J.R.W., Lewis, G.L., and Knapp, J.W., 1989. Introduction to Hydrology. 3rd ed. Singapore: Harper and Row, 780.
- Wada, Y., et al., 2010. Global depletion of groundwater resources. Geophysical Research Letters, 37 (20). doi:10.1029/2010GL044571
- Yeh, H.-F., et al., 2009. GIS for the assessment of the groundwater recharge potential zone. Environmental Geology, 58 (1), 185–195. doi:10.1007/s00254-008-1504-9
- Yeh, H.-F., et al., 2014. Identifying seasonal groundwater recharge using environmental stable isotopes. Water, 6 (10), 2849–2861. doi:10.3390/w6102849
- Yeh, H.-F., et al., 2016. Mapping groundwater recharge potential zone using a GIS approach in Hualian river, Taiwan. Sustainable Environment Research, 26 (1), 33–43. doi:10.1016/j.serj.2015.09.005
- Zargouni, F., 1985. Tectonique de l’Atlas méridional de Tunisie. Evolution géométrique et cinématique des structures en zones de cisaillement. Thèse ès Sciences. Université Louis Pasteur, Strasbourg, France, 296.
- Zghibi, A., Tarhouni, J., and Zouhri, L., 2013. Groundwater mineralisation processes in Mediterranean semi-arid systems (Cap-Bon, North east of Tunisia). Hydrological Processes, 27 (22), 3227–3239.
- Zouhri, L., 2010. Geoelectrical structure and hydrogeological investigations of the southern Rif Cordillera (Morocco). Hydrological Processes, 24 (10), 1308–1317.