
ABSTRACT
To promote the advancement of novel observation techniques that may lead to new sources of information to help better understand the hydrological cycle, the International Association of Hydrological Sciences (IAHS) established the Measurements and Observations in the XXI century (MOXXI) Working Group in July 2013. The group comprises a growing community of tech-enthusiastic hydrologists that design and develop their own sensing systems, adopt a multi-disciplinary perspective in tackling complex observations, often use low-cost equipment intended for other applications to build innovative sensors, or perform opportunistic measurements. This paper states the objectives of the group and reviews major advances carried out by MOXXI members toward the advancement of hydrological sciences. Challenges and opportunities are outlined to provide strategic guidance for advancement of measurement, and thus discovery.
Editor A. Castellarin; Associate editor not assigned
1 Introduction
Since the beginning of the 21st century, considerable efforts have been devoted to a better comprehension of natural processes for improved hydrological predictions. Enhanced process understanding has been the main objective of the Predictions in Ungauged Basins (PUB) Decade of the International Association of Hydrological Sciences (IAHS) (Blöschl et al. Citation2013, Hrachowitz et al. Citation2013). The PUB initiative has enriched the modelling and conceptual toolbox available to hydrologists for comprehensive description of water processes. Within the PUB Decade, it became clear that improving our understanding of the hydrological functioning of river catchments provides the foundation for properly answering questions on how much water is found and moves among diverse compartments of natural catchments (Selker and Ferre Citation2009). Therefore, the ability of hydrologists to accurately measure processes and state variables is a priority for improving the understanding of processes. This fact has been confirmed by a recent community survey among 336 hydrologists (Blume et al. Citation2017). According to this study, the participants thought that new measurement techniques and equipment, as well as more field measurements and monitoring, were needed to advance the hydrological sciences rather than new modelling approaches; furthermore, they saw the greatest challenges and difficulties in the maintenance of monitoring networks. While the community opinions highlighted the importance of field measurements and monitoring, 66% of the participants observed that there is a general tendency of more data mining and modelling projects and less experimental research (Sidle Citation2006, Burt and McDonnell Citation2015, Vidon Citation2015, Blume et al. Citation2017).
Proficiency in modelling techniques has not been paralleled by similar advancements in our ability to quantitatively observe the hydrological cycle (Mishra and Coulibaly Citation2009). Traditional monitoring systems suffer from major limitations, and observations through standard equipment are still inadequate to fully grasp natural processes. In addition, they often tend to be expensive, and offer limited spatial coverage (Gleick Citation1998, Hannah et al. Citation2011, WMO Citation2015). Dealing with sophisticated technology also involves high maintenance costs and adequate access to trained staff and resources (Turnipseed and Sauer Citation2010). Such difficulties have led to consistently decreasing observations since the 1980s,Footnote1 and have hindered the implementation of dense monitoring networks in difficult-to-access environments or developing countries (van de Giesen et al. Citation2014, Feki et al. Citation2017). Furthermore, the majority of research groups cannot afford costly monitoring equipment, thereby considerably constraining the opportunity for novel research avenues. Such monitoring limitations hamper the assessment of change in hydrological and related behaviours (Koutsoyiannis Citation2013, Montanari et al. Citation2013) and of water security (Vörösmarty et al. Citation2010, UN WATER Citation2013, Young et al. Citation2015, Ceola et al. Citation2016).
Since the value of hydrological measurements is rooted in sensors, hydrologists have addressed the challenge of accurately measuring environmental variables by resorting to innovation and multi-disciplinarity. In recent years, numerous research groups have put forward the idea that scientists could (and maybe should) design, develop and deploy their own sensors (Lettenmaier Citation2017). This awareness coincided with the rise of open source controllers, such as Arduino (https://www.arduino.cc), which inspired scientists to either build their own instruments or modify off-the-shelf equipment (Cressey Citation2017). Compared to standard measurement technology, this approach promoted the development of low-cost, easily accessible, and tailored sensors that enabled observations with unprecedented capabilities.
While the community of tech-savvy and sensor-enthusiastic hydrologists blossomed during the decade 2003–2013, towards the end of PUB initiative, the community came together and formed the Measurements and Observations in the XXI century (MOXXI) Working Group (WG) of IAHS. The WG was founded in 2013 during the IAHS-IAPSO-IASPEI (IAPSO: International Association for the Physical Sciences of the Oceans; IASPEI: International Association of Seismology and Physics of the Earth’s Interior) Joint Assembly held in Gothenburg, Sweden, and was the result of a debate initiated in 2011 at the XXV IUGG (International Union of Geodesy and Geophysics) General Assembly in Melbourne, Australia. The foundation of the MOXXI WG was concurrent with the establishment of the new IAHS scientific decade, “Panta Rhei”, with which the WG shared many objectives and research activities (Montanari et al. Citation2013, McMillan et al. Citation2016). As stated by the IAHS Bureau, the main objective of the MOXXI WG consists of promoting the advancement of novel observational techniques, leading to new sources of information to help better understand the hydrological cycle. The MOXXI WG addresses science questions 1 and 5 of the Panta Rhei initiative (Montanari et al. Citation2013), which target the identification of key gaps in the common understanding of hydrological change, and focus on advancing our monitoring and data analysis capabilities to predict and manage hydrological change. The MOXXI initiative directly addresses the need for new monitoring approaches to increase the quality and spatial and temporal resolution of hydrological observations by creating a nexus of scientists with a shared interest in sensors and novel observations. MOXXI targets innovation in all realms of hydrological observations, spanning from ground-based measurements to proximal and remote sensing.
The WG’s objectives and interests can be stated as follows:
(1) The understanding of hydrological processes can benefit from a novel approach towards experimental observations, where scientists proactively design and develop their measurement tools and methodological approaches by adjusting them to answer their specific questions.
Despite the demonstrated capabilities of standard measurements, traditional approaches may be inadequate to deal with hydrological heterogeneity and complexity. For instance, standard streamflow measurement systems require the deployment of bulky and expensive equipment in the water current along with the assistance of trained staff. Unfortunately, such requirements have prevented the availability of streamflow data at high spatial and temporal resolutions, or the acquisition of data in the case of flood events. Conversely, limitations in traditional monitoring techniques have fostered the use of remote and proximal sensing, such as optical cameras and radar technology, as well as aircraft and unmanned aerial system (UAS) platforms for streamflow observations.
With regard to water quality, high-frequency and multi-species monitoring is now being explored, both to characterize some water pollution crises and to better understand the mobilization and delivery of fine sediment and the biogeochemical processes operating at the catchment scale, and the ways in which natural and anthropogenic factors influence dominant processes (Aubert et al. Citation2013, Tetzlaff et al. Citation2017); yet these remain limited to experimental basins so far. More generally, a multiple approach of various water-related processes and compartments of the critical zone is under progress (White et al. Citation2015, Cudennec et al. Citation2016, Grant and Dietrich Citation2017), in the wider emerging complexity of the Anthropocene and global change (Bai et al. Citation2016, Brondizio et al. Citation2016), but comprehensiveness remains a huge metrological and epistemological challenge.
(2) Successful observational approaches often rely on knowledge from other fields of science. Hydrologists may advance their experimental toolbox by adopting a multi-disciplinary perspective in designing their own sensors and observation methodologies.
Building one’s own sensors directly involves orienting oneself in electronics, 3D printing, soldering, coding, etc. Relying on notions that are typically far from the expertise of hydrologists has contributed to shaping a novel class of researchers, who have diverse backgrounds and actively interact with experts from fields other than hydrology. An example of the promise of a multi-disciplinary approach in hydrology is the use of thermal imagery or robotics in hydrological observations.
(3) Ad hoc designed measurement systems may entail scientists directly building/assembling sensors using low-cost and unintended instrumentation, or performing smart (opportunistic) observations that combine diverse and often under-utilized technologies.
Often, low-cost equipment has been instrumental to overcome financial and logistical time constraints, and has offered powerful diagnostic tools. It also provides the chance to involve the public via crowdsourcing and thus to get people interested in environmental sensing and science in general. Inexpensive and open source resources have afforded high versatility by allowing scientists to adjust and modify sensors for their specific needs. By building their own sensors, hydrologists have embraced a do-it-yourself (DIY) approach, whereby low-cost instrumentation is preferred to sophisticated equipment. For example, commercial sport cameras (such as GoPro®) have advanced features, such as extremely high frame acquisition rates and high resolution, which were unimaginable just a decade ago. Similar instrumentation is affordable by most research groups and resource-scarce hydrological services, and opens novel perspectives on the establishment of spatially dense monitoring networks. Also, rapid technological progress is expected to lead to increasingly advanced sensors available on the market at competitive prices within a few years. Resorting to inexpensive commercial products has stimulated scientists’ inventive capabilities, thus leading to unintended electronics being used as hydrological sensors. For instance, precipitation has been measured with moving cars (Rabiei et al. Citation2016) and accelerometers (Stewart et al. Citation2012), and water levels have been monitored with game-console remote controls (Hut et al. Citation2010). These research activities have facilitated the acquisition of hydrological data and have also paved the way for the implementation of public and collaborative sensing platforms (for instance, Crowd Hydrology, OPEnS Lab and others).
Paradoxically, while conventional hydrology is increasingly relying on information from satellites as input (Kummerow et al. Citation1998, Hou et al. Citation2014) or validation (Smith Citation2002, Malenovský et al. Citation2012) for models, the increased use of satellite data has raised rather than lowered the demand for ground-based observations (Hut Citation2013). This is due to the low spatial coverage of current operational ground sensors (Moradkhani Citation2008) and the need for satellite data to be constantly calibrated using ground observation points. Many such ground-based observations often mandate ad hoc designed and developed sensors.
Remarkably, the hydrological community has rarely felt the need for large-scale cooperation, such as is needed for large instruments, such as telescopes, research vessels or satellites. For instance, of the many scientific satellites that provide geophysical observations, only a few have hydrology as their primary mission objective (such as SMOS: Soil Moisture and Ocean Salinity; SMAP: Soil Moisture Active-Passive; GPM: Global Precipitation Measurement). Opportunistic use of instruments developed elsewhere is perhaps a logical consequence of the somewhat individualistic nature of the hydrological community. This even holds true for the use of satellite products developed for other fields, such as scatterometers for soil moisture (Wagner et al. Citation1999) and altimeters (Rapley et al. Citation1987, Koblinsky et al. Citation1993).
The MOXXI initiative gathers scientists with an interest in novel observations and provides a place to share, promote and discuss research activities. Importantly, the group ensures that experimental advances are well curated in the hydrological community. In the First Topical Conference held on 21 November 2016, at the European Space Agency (ESA) European Space Research Institute (ESRIN) campus in Frascati, Italy, researchers from more than 15 universities, several research centres and private companies shared their research and ideas for future collaborations. The WG also aims to provide an updated database of innovative observational approaches and a shared platform with experts from other fields. In our vision, hydrologists could find solutions to their experimental questions just by taking a look at the MOXXI websiteFootnote2 and contacting members of the working group with similar interests.
This paper was originally conceived at the First Topical MOXXI Conference in November 2016, and aims to report on the many research activities that revolve around the establishment of the MOXXI WG; to state the major challenges faced by the MOXXI community; and to provide guidance on future research directions.
2 How did it all begin?
Since its inception in 1922, IAHS has always offered fora to progress on instrumentation and metrological issues in sub-disciplines of hydrology and related fields of science (see the history of publications from 1924, available at www.iahs.info), and it has been at the forefront of scientific debates about emerging techniques (for instance, the debates that preceded the establishment of the Committee on Remote Sensing and Data Transmission in 1981 and the Committee on Tracers in 1991, which later became international commissions of IAHS). Before the establishment of MOXXI, several groups and initiatives had stressed the importance of innovation and multi-disciplinarity for experimental hydrology. At the beginning of the 21st century, sensing the need to communicate advancements in self-made sensors, authors Hut, Selker, Blume and Luxemburg organized a poster only session at the 2009 AGU (American Geophysical Union) Fall Meeting. Since presenters brought their self-made sensors to the session, and due to the copious amount of duct-tape present, the hydrologists attending the session quickly gave it the nickname “the MacGyver session”. The session was a success, was repeated yearly, is still going strong and has a sister session at the annual EGU (European Geophysical Union) General Assembly. The presenters and conveners at this session became known as the MacGyver community. The MacGyver community noticed that experimental hydrology practice and methodologies were outpaced, as compared to theoretical hydrology and hydrological modelling. To advance observations, experimental hydrologists could instead rely on inexpensive sensors, open source hardware, and multi-disciplinarity. These MacGyver pillars are still at the core of MOXXI interests, and the MacGyver community was asked to establish MOXXI as a focal point for the hydrological community.
Within the PUB decade, a growing community of hydrologists and environmental scientists tackled the observation of complex natural phenomena by adopting innovative experimental approaches. In fact, the PUB initiative focused on ungauged basins, where incomplete understanding of hydrological processes is caused by little or no available information. PUB addressed this challenge by either extracting more information from available data or using newly acquired data. Lack of data motivated considerable advancements in space-borne radar, other satellite missions, and ground-based observation technology.
Result sharing formed the core of such efforts in innovative experimental hydrology. Novel experimental approaches that were achieved by this growing group within the hydrological community were collected in a special issue (Selker and Ferre Citation2009) and made available through the Experimental Hydrology Wiki page.Footnote3 This latter initiative seeks to keep scientists abreast of the latest experimental advances and inform the choice of the best possible sensor for the intended purpose.
3 MOXXI topics
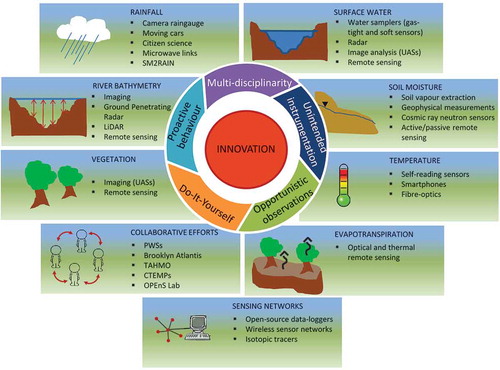
In this section, we report on the major innovations carried out by the MOXXI community in the field of hydrology. While this review is far from being exhaustive, it provides numerous references for further in-depth reading. Novel approaches and methodologies are summarized with regard to the hydrological observation they enable (see ). As illustrated in the sketch, the group leverages multi-disciplinarity, opportunistic observations, and a proactive attitude to explore diverse areas, spanning from rainfall to innovative sensing networks. MOXXI is still relatively young and many areas, such as groundwater, the coupling between land and atmosphere, snow and ice, and water quality, are underrepresented and, therefore, not reported in this work. However, the working group is continuously increasing its membership and we expect the MOXXI initiative to be far more inclusive in the next few years.
Figure 1. Overview of the MOXXI objectives and innovative approaches in the fields of hydrological observations currently covered by the MOXXI Working Group.
In the following, we review the latest advances in the fields of hydrological monitoring investigated by current MOXXI members. Where possible, topics are presented by starting from large-coverage/low-resolution options to monitoring approaches that enable higher resolution on smaller regions of interest.
3.1 Rainfall
Rainfall data is an important input for most hydrological analyses. Depending on the scale of the analyses, certain temporal and spatial resolutions of rainfall data are needed. For instance, Schilling (Citation1991) discussed the need for 1 min temporal resolution and 1 km2 spatial resolution for urban hydrology. Interpolation techniques are usually implemented for spatial and temporal estimation of rainfall by observation data. The accuracy of rainfall estimation becomes crucial when considering the highly dynamic temporal and spatial distribution of rainfall. Several studies seek to achieve rainfall estimation in alternative ways that are not initially aimed for this specific purpose and have low operational costs. Therefore, such approaches are mostly not as accurate as conventional raingauges, but could provide valuable additional information in combination with conventional techniques. In fact, implementing a large number of inaccurate observations may result in better areal rainfall estimation than only using a couple of accurate raingauges (Haberlandt and Sester Citation2010, Rabiei et al. Citation2016). The need for reliable rainfall data might not be fulfilled using only conventional data sources, whereas merging all possible data sources such as raingauges, radar data, crowdsourced observations, etc., may provide a better rainfall estimation. This would result in a better understanding of the hydrological cycle, which helps to increase our knowledge and, consequently, to improve the quality of hydrological analyses.
A methodology to estimate distributed rainfall was developed from satellite-based soil moisture observations by Brocca et al. (Citation2014). The method is named SM2RAIN and relies on the inversion of the soil water balance equation considering the soil as a natural raingauge. The method was successfully applied on in situ (Brocca et al. Citation2015) and satellite data for obtaining rainfall products on a regional (Brocca et al. Citation2016, Ciabatta et al. Citation2017) and a global scale (Brocca et al. Citation2014, Koster et al. Citation2016). The methodology can also be exploited for irrigation estimation (Brocca et al. Citation2017b) and for assessing the performance of satellite rainfall products (Massari et al. Citation2017), thus opening novel and promising applications.
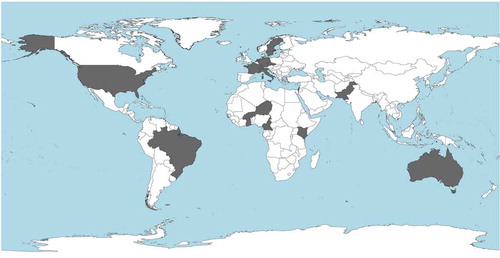
Using innovative methods for fulfilling the need for denser observation networks has also been the focus of recent research efforts. For example, microwave links from cellular communication networks have been proposed as a promising new rainfall measurement technique (Upton et al. Citation2005, Messer et al. Citation2006, Rahimi et al. Citation2006, Leijnse et al. Citation2007, Zinevich et al. Citation2009). They are particularly relevant for those places where few surface rainfall observations are available, such as developing countries (Gosset et al. Citation2016) or urban areas (Overeem et al. Citation2011). The basic principle of rainfall estimation using microwave links is the nearly linear relationship between the rain-induced attenuation of electromagnetic signals transmitted from one telephone tower to another and the path-average rain rate. Overeem et al. (Citation2013a) were the first to present country-wide rainfall maps based on attenuation data from a network of commercial microwave links (CMLs) operated by a major cellular communication company in the Netherlands. Their CML rainfall retrieval and mapping algorithm is freely available (Overeem et al. Citation2016a). More recently, Overeem et al. (Citation2016b) demonstrated the potential of CMLs for long-term, large-scale operational rainfall monitoring, based on a 2.5-year dataset from a cellular communication network consisting of about 2000 links covering the land surface of the Netherlands (35 000 km2). Good results were obtained particularly for the summer season, which shows the potential of this opportunistic technique for large-scale application in developing countries in (sub)tropical climates, with few rain gauges and little or no weather radars ().
Figure 2. World map showing the countries for which researchers have managed to obtain commercial microwave link data (shaded areas) for the purpose of rainfall monitoring (from van het Schip et al. Citation2017).
Innovative approaches to estimate point-wise rainfall include moving cars and imaging. Rabiei et al. (Citation2013) used moving cars for short time step rainfall estimation. The ubiquitous diffusion of cars motivated the idea of exploiting them as moving rain gauges with windshield wipers or optical sensors as rainfall measurement devices. Laboratory experiments have established relationships between sensor readings, such as wiper speed and automatic wiper adjustment through optical sensors, and rainfall intensity. Experimental findings showed that manual wiper speed adjustment is strongly related to rainfall intensity.
Finally, image capture and processing has also afforded the quantitative detection of rain rate with errors of the order of ±25% (Allamano et al. Citation2015). By providing rainfall measurements at high temporal resolution and extremely low costs, the camera rain gauge opened novel avenues toward increasing the density of rainfall observations. In addition, the eventual combination of the methodology with citizen science platforms is foreseen to revolutionize rainfall measurements.
3.2 Surface water observations
River floods are responsible for thousands of lives lost every year and streamflow monitoring is crucial for flood preparedness and mitigation strategies. The scarcity of streamflow observations is a major problem and a source of considerable uncertainty in hydrology. Unfortunately, river streamflow cannot be directly measured either with ground-based instruments or with satellite remote sensors, and its estimate is normally executed by referring to other hydrological variables that are easier to collect (that is, water depth, water surface elevation, flow velocity, water extent, etc.), and have been used in previously calibrated theoretical or empirical approaches (Smith Citation1997). In addition, continuous funding cut-backs challenge frequent monitoring campaigns or the implementation of dense networks of measurement stations.
Since the establishment of MOXXI, progress has been achieved in the observation of surface waters in difficult-to-access environments and during extreme events through diverse multi-disciplinary techniques. For instance, to partially address the issue of observing stream processes in the case of scarce measurement stations, the use of satellite nightlight data has been explored. Nocturnal lights in the proximity of rivers proved to be consistently linked to flood damage; further, increasing nightlights has been associated with flood damage intensification (Ceola et al. Citation2014). Also, participatory data collection methods and data mining have proved promising to expand the dataset currently available to the research community. For instance, water level time series have been derived from the analysis of several YouTube videos for a Saudi Arabian cave (Michelsen et al. Citation2016), and extreme floods have been gauged from YouTube videos for a French Alpine stream (LeBoursicaud et al. Citation2015). Such innovative approaches mandate actual streamflow observations for calibration. Among the increasingly numerous innovative methodologies for gauging and sampling surface water, we discuss selected approaches in the following.
3.2.1 Streamflow measurements
Estimating flow discharge requires water level or velocity measurements of surface waters. These have been tackled through a multitude of approaches from local to global scales. The use of satellite sensors for water level estimation is a current practice that saw its first application in the 1980s, when the combination of high-resolution satellite imagery (that is, Landsat) with topographic maps or digital elevation models (DEM) enabled the estimation of the water surface elevation over large reservoirs (Gupta and Banerji Citation1985). Originally designed for other scopes (such as Earth observations, ice-covered areas and ocean monitoring), remote sensors have been widely used also for hydrological purposes (Schumann and Domeneghetti Citation2016). Among available alternatives for water level sensing (such as satellite imagery, laser altimetry; Hall et al. Citation2012), radar altimetry represents the most suitable and reliable technique (Rapley et al. Citation1987, Koblinsky et al. Citation1993, Birkinshaw et al. Citation2010), with the water elevation measured as a function of the two-way return time of a radar pulse emitted from the satellite and backscattered by the liquid surface. Despite re-trackers being expressly designed for inland waters, the latest progress in technical instrumentation has yielded remarkable improvements in the accuracy of radar altimeters, ensuring errors of the order of 20–30 cm for the water height of large rivers or lakes (Berry et al. Citation2010, Bercher and Kosuth Citation2012, Tarpanelli et al. Citation2013a).
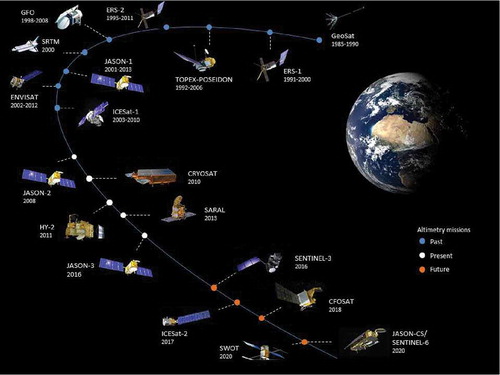
Recently, those advances have allowed the use of altimetric data to be extended to smaller rivers (water extent smaller than 100 m), with performances comparable to those previously experienced over large water bodies (errors of up to 50–70 cm; see, for instance Sulistioadi et al. Citation2015). The scientific community may count on a number of altimetry missions (such as Geosat, ERS-1/2, TOPEX/Poseidon, Geosat Follow-on, ENVISAT, Jason-1/2/3, CryoSat-2, SARAL/AltiKa, Sentinel-3A/B/C/D, Sentinel-6) that adopt different instrumentations and provide data with various accuracies and spatial resolutions (Schumann and Domeneghetti Citation2016) (see ). Despite the wealth of measurements, in some cases made up of long time series (Tourian et al. Citation2016), the satellites’ low revisit time (typically ranging from 10 to 35 days), ground-track spacing (from a few kilometres, e.g. CryoSat-2, to some hundreds of kilometres, e.g. Jason) and the measurements’ latency limit the use of such sources for operational procedures and for application, especially over small to medium rivers, where the time lag of the flood events is typically limited to a few days. Nevertheless, the potential of altimetric data is considerable, with applications that regard the enhancement of hydrological and hydraulic models (Biancamaria et al. Citation2009, Getirana Citation2010, Domeneghetti et al. Citation2015, Schneider et al. Citation2017) and the estimation of river discharge (Tourian et al. Citation2013, Durand et al. Citation2014) through approaches based on traditional empirical formulas and rating curves (Kouraev et al. Citation2004, Negrel et al. Citation2011, Frappart et al. Citation2015).
Figure 3. View of past, current and future satellite altimetry missions most commonly reported in the literature and relevant to monitoring the world’s rivers, lakes and reservoirs (Schumann and Domeneghetti Citation2016).
Techniques integrating water level measurements from altimetry with velocity measurements from optical, multispectral and passive microwave multispectral sensors have been used to derive river discharge also in ungauged sites where the river cross-section geometry is unknown (Tarpanelli et al. Citation2015). Estimates of river flow velocity from satellite imagery have been performed by exploiting different reflectance values for pixels inside the river and pixels pertaining to land in the near-infrared band (Tarpanelli et al. Citation2013b). The temporal analysis of the ratio of dry to wet pixels has been shown to be representative of flow velocity variations and, hence, of river discharge (Van Dijk et al. Citation2016, Tarpanelli et al. Citation2017). Daily values of discharge are potentially available by the joint use of multispectral sensors (MODIS, MERIS, OLCI) and densified water level time series obtained by merging altimetry data from different satellite missions (Tourian et al. Citation2017).
Images have enabled non-intrusive and distributed observations of water bodies at high temporal resolution. The use of optics-based approaches for streamflow measurements is documented since the end of the 1990s, when techniques historically adopted in fluid dynamics laboratories were successfully applied to natural rivers (Fujita et al. Citation1997). In light of the advances in resolution, acquisition rates and quality of images captured in both the visible, near-infrared and infrared spectra using commercially available digital cameras, our capability of detecting distinct water-surface features has improved. For instance, laboratory studies have been conducted to assess the feasibility of using images for water level measurements (Gilmore et al. Citation2013). Subsequently, optical flow tracking techniques based on cross-correlation and feature-based tracking have enabled the displacement rates of detected features to be computed. This may be achieved through application of one of several methodological approaches, including large-scale particle image velocimetry (LSPIV; Muste et al. Citation2008, LeCoz et al. Citation2010), particle tracking velocimetry (PTV; Tauro and Grimaldi Citation2017), and Kanade-Lucas-Tomasi (KLT) flow tracking (Perks et al. Citation2016). These approaches have allowed the reconstruction of the surface flow velocity field and the estimation of surface transit times in mountainous streams, hillslope rills and medium-sized rivers. Combined with high-visibility buoyant tracers, such as fluorescent particles, image-based analysis has demonstrated considerable potential for surface hydrology (Tauro et al. Citation2014).
Application of flow visualization algorithms may allow displacement rates to be obtained in near real-time, across image domains spanning several hundreds of square metres, and in environments where the deployment of conventional flow monitoring approaches would be logistically or financially unfeasible, or unduly hazardous. These measurements would be very helpful to calibrate the algorithms to convert river stage measured by space-borne radar or laser altimeters into river discharge (Pereira-Cardenal et al. Citation2011, Michailovsky et al. Citation2012). The integration of resilient and high-performance cameras with laser modules has afforded fully remote image acquisition and calibration. This remote streamflow sensing platform has been permanently installed underneath urban bridges (Tauro et al. Citation2016a), compacted in a portable apparatus (Tauro et al. Citation2014), and mounted onboard UASs for large-scale monitoring (Tauro et al. Citation2016b).
In the past decade, the horizontal acoustic Doppler current profiler (H-ADCP) has been adopted to automatically monitor river discharge (Nihei and Kimizu Citation2008). This accurate, continuous and relatively low-cost approach entails the installation of the profilers horizontally in the current to measure the velocity profile at a fixed height along a horizontal line (Aberle et al. Citation2017). Based on such measurements, numerical simulations are used to interpolate and extrapolate over the whole cross-section, thus providing an estimate of flow discharge. This technique has led to accurate measurements in diverse applications (Mansanarez et al. Citation2016, Garel and D’Alimonte Citation2017), even though care is required in the case of wide and irregular bed rivers due to side-lobe interference (Hoitink et al. Citation2009).
Surface flow velocity has been easily surveyed by using handheld surface velocity radar (SVR) technology (Costa et al. Citation2000, Welber et al. Citation2016), which lends itself to monitoring high flows and represents a cheap and easy-to-use solution to gauge multiple field sites. In this context, surface velocity measured by SVR across a river site can be turned into a two-dimensional velocity field, as proposed by Chiu (Citation1987), where the probability distribution function of surface velocity is derived through the entropy theory (Shannon Citation1948). Moreover, based on observed surface velocities, secondary currents in the cross-sectional flow area can also be simulated (Moramarco et al. Citation2017), and the bathymetry of river cross-sections can be inferred, circumventing the estimation of hydraulic quantities, such as the energy slope and Manning’s roughness (Moramarco et al. Citation2013).
With regard to local surveys, soft sensors have provided very valuable information on hydrological dynamics and signatures, especially when accurate discharge values are not required (Perumal et al. Citation2007, Blöschl et al. Citation2013). Differing from traditional equipment, which typically involves high power consumption and heavy maintenance operations, and is invasive and expensive, soft sensors are handy, portable and low-cost. These minimally invasive sensors are capable of measuring water level at adjustable time steps. They work as capacitors coupled with a capacitance to frequency converter, and are optimized in terms of energy consumption and low-cost manufacture. Crabit et al. (Citation2011a, Citation2011b)) opened an avenue in this regard with handy, low-cost and robust capacitive limnimetric sensors that allow one to assess the shape of rainfall–runoff relationships, to observe the effects of geographic changes on the hydrological response of small basins, and to densify the survey beyond the reference hydrometric network.
3.2.2 Water sampling
Understanding stream processes often requires sampling of the time-changing properties of water. This could include an interest in major ion chemistry, suspended sediment load, dissolved gas concentrations or isotopic composition.
Most of these observations rely on laboratory equipment that leaves water samples open to the air, making precise sampling for gas and isotopic composition inaccurate (for instance, the Isco 6712 wastewater sampler). These conventional samplers typically cost about US$5000. To alleviate these issues, a gas-tight sampler has been designed at the Openly Published Environmental Sensing Laboratory (OPEnS lab, Open-Sensing.org, see Section 3.9) that will be substantially less expensive than current options. First, aluminium-lined bags were utilized to store the samples. These have been shown to retain isotopic and dissolved gas proprieties of water samples. Next, two 12-volt mini-peristaltic pumps, which cost about US$10 each, were positioned side-by-side to give redundancy and increased flow. Gas-tight solenoid valves built for soda dispensers were adopted, which also operate on 12 V, cost under US$3 each, and are rated for over 100 000 cycles of operation. All of the physical elements were mounted on an aluminium back-bone, and encased in layers of foam that was shaped by a laser-cutter. All other parts were standard hardware, or made using a 3D printer. The system was controlled with an Arduino programmed to first purge all the lines, then take a sample, and then prepare for the next sample. The device could also be programmed to deliver the samples to an analysis instrument via two-way communication to the Arduino. In fact, it could clean itself in preparation for the next deployment through another 10-cycle filling and emptying programme, with the device provided with pure water from the laboratory. The entire device has parts that cost less than US$300, and is transformative in its capabilities in comparison to the current standard devices.
3.3 River bathymetry
River bathymetry is key for many hydrological and hydraulic applications. Apart from its use in the implementation of flow routing models, knowledge of the water depth of a river is fundamental for monitoring geomorphological processes, sediment dynamics, natural habitats, and for the prediction of pollutant diffusion.
First attempts for the estimation of the river bathymetry involved photogrammetric techniques: optical refraction-correction theories applied to images taken with different viewing angles from aerial surveys have enabled the estimation of the elevation of submerged areas (Westaway et al. Citation2003). Passive optical instruments have been used to estimate water depth by interpreting sunlight attenuation through water columns by means of analytical, semi-analytical, or empirical approaches. Based on physical laws regarding light propagation into water, analytical criteria require a huge amount of physical parameters of the water and the atmosphere, thus limiting the fields of applicability of this approach. In contrast, empirical methods take advantage of simple relationships, calibrated over sample areas, that relate the radiance estimated from images to water depths.
The efficiency of optical methods is controlled by several factors, such as water turbidity, specular reflection, vegetation and uniformity of the river. The accuracy of water depth estimates depends on the characteristics of the study area, and it remains acceptable (errors ranging from −12.1 to 22.7%) up to a water depth of nearly 15 m (McIntyre et al. Citation2006). Resorting to satellite-based very fine-resolution imagery (such as IKONOS, which exceeds 1 m in resolution), Lyzenga et al. (Citation2006) applied a simple physically-based algorithm that led to an aggregate root mean square error of 2.3 m with water depths over 20 m. Recently, to overcome the need of in situ data for optical image calibration, Legleiter (Citation2015) proposed an algorithm that estimates river bathymetry by combining the spectral analysis of satellite images with simplified hydraulic equations.
Alternative methodologies are based on globally available satellite-sensed DEMs (such as SRTM; 30 or 90 m resolution), and try to reproduce river bathymetry by (i) data assimilation techniques (Durand et al. Citation2008), (ii) referring to hydraulic geometry equations (Neal et al. Citation2012), (iii) adopting simplifying hydraulic assumptions (Alfieri et al. Citation2014), (iv) investigating simplified geometric assumptions on river geometry (Domeneghetti Citation2016), and (v) implementing the entropy theory (Moramarco et al. Citation2013).
Another valuable technique for monitoring river bathymetry is based on the use of ground penetrating radar (GPR; see, for instance, Feurer et al. Citation2008). The GPR is typically positioned close to the water surface and measures the water depth by means of electromagnetic waves partially backscattered from the river bed. LiDAR (light detection and ranging) instrumentation, typically mounted on airplanes, uses the same concepts but emits a near-infrared laser beam (blue-green wavelength) which ensures the penetration of a rather deep water column (Feurer et al. Citation2008). Alternatively, in the case of deep water, accurate LiDAR-based topographic surveys can be instrumental in estimating the submerged river portion through a simplified linear relationship between water elevation and concurrent river width (Mersel et al. Citation2013). Despite their efficacy, the use of GPR and LiDAR often requires expensive ad hoc and low-flying surveys. However, optical techniques are much more commonly used since they can take advantage of both satellite and aircraft surveys that are available and accessible to a larger community.
On a local scale, an interesting stream bathymetry mapping application involved the use of the Microsoft Kinect camera, a commercial device that includes a light emitter, an infrared camera, an RGB camera, a three-axis accelerometer and four microphones (Mankoff and Russo Citation2013). In a calibration experiment in laboratory conditions, the Kinect was adopted to estimate water depths up to 0.20 m based on the apparent distance of captured objects from the camera itself. However, the high cost/area ratio of point-wise and ground-based measurement campaigns constrains the spatial coverage of such surveys, thus fostering alternative and cost-saving techniques. The employment of remote sensing data to this scope is a valuable solution that ensures spatiotemporal coverage unaffordable with traditional tools (Feurer et al. Citation2008, Gao Citation2009).
3.4 Soil moisture
Knowledge of soil water content (SWC) is essential, as it represents a key variable in many hydrological (Tramblay et al. Citation2010, Brocca et al. Citation2017b), climatological (Seneviratne et al. Citation2010), environmental and ecohydrological processes (Grayson et al. Citation1997, Manfreda et al. Citation2017). Determining the temporal and spatial variability of SWC is essential for a wide range of studies, and a large number of measurement techniques have been developed in the past decade (Robinson et al. Citation2008, Bogena et al. Citation2015).
Satellite remote sensing of soil moisture has significantly advanced in the past decade, as demonstrated by two dedicated missions (Soil Moisture Ocean Salinity, SMOS, and Soil Moisture Active and Passive, SMAP). The most widely used approaches employ active (scatterometer) and passive (radiometer) microwave sensors (Brocca et al. Citation2017a) that provide (freely available) soil moisture products at nearly daily temporal resolution and coarse spatial resolution of ~20 km. To estimate soil moisture at higher resolution, active microwave synthetic aperture radars (SARs) have been employed with the latest sensors (such as Sentinel-1), potentially providing 1-km/6-day soil moisture products (Paloscia et al. Citation2013). To enable the retrieval of SWC from SARs, empirical, semi-empirical and theoretical models have been implemented. Empirical models (Zribi and Dechambre Citation2002) allow one to obtain accurate results in the specific set-up conditions; theoretical models (Chen et al. Citation2003) are implemented to predict backscattering in response to sensor and soil parameters, but are more difficult to apply. Among available semi-empirical models, Capodici et al. (Citation2013) recently proposed a coupled algorithm for soil moisture estimation using co- and cross-polarized imagery, obtaining satisfactory assessments.
Soil moisture monitoring over large scales is limited by the fact that satellite sensors only provide surface measurements (<5 cm), which are not representative of the effective amount of water stored in the subsurface. Therefore, a methodology able to infer root-zone soil moisture starting from surface measurements is highly desirable. A good example of opportunistic use is the work by Wagner et al. (Citation1999), which used a scatterometer designed to measure wind fields over the oceans to measure soil moisture. Recently a new simplified formulation, named SMAR, has been introduced to provide a formal description of the mathematical relationship between surface measurements and root-zone soil moisture (Manfreda et al. Citation2014). The SMAR model has been coupled with the ensemble Kalman filter (EnKF) to reduce the regional-scale bias of satellite near-surface moisture data (Baldwin et al. Citation2017). The SMAR-EnKF system can predict root zone soil moisture over broad extents, and has applications in drought prediction and for other operational hydrological modelling purposes.
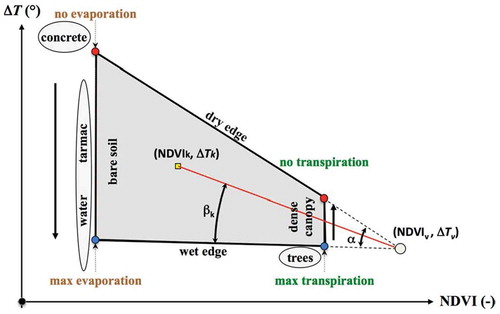
Ongoing data-model integration methods are combining satellite-sensed and field-based measurements with models to better predict soil moisture and interactions in ecohydrology (Hwang et al. Citation2008, Ng et al. Citation2009). Within passive remote sensing, some methods employ thermal and visible/near-infrared bands to determine soil surface water content. The thermal inertia method (Xue and Cracknell Citation1995, Sobrino and El Kharraz Citation1999, Maltese et al. Citation2013) determines soil moisture over bare or barely vegetated soils using diachronic thermal acquisitions. The method is founded around the evidence that the ability of a material to accumulate heat and release it within a defined time interval depends on the water content of the material itself. The triangle method (Carlson et al. Citation1995) is based on the fact that optical and thermal features of vegetated soils are primarily controlled by the root zone water content. In practical implementations of the triangle method, daytime air temperature can be replaced with night-time land surface temperature to take into account the thermal inertia of the soil (Maltese et al. Citation2015) (see ).
Figure 4. Scatter plot of the normalized difference vegetation index (NDVI) vs the thermal difference between land surface temperature and a reference temperature (∆T) with superimposed dry and wet edges. Blue dots indicate maximum evaporation and transpiration, and minima are illustrated with red dots. The generic NDVI-∆T pair is indicated by K subscript; and V subscript indicates the triangle vertex. Adapted from Maltese et al. (Citation2015).
Monitoring soil moisture is also crucial to increase irrigation water use efficiency and agricultural production in the context of climate change. Several studies have focused on “smart farming” by coupling meteorological and hydrological models to predict soil moisture (SM) and crop water requirements for precise irrigation scheduling (Gowing and Ejieji Citation2001, Cai et al. Citation2007, Melton et al. Citation2012, Ravazzani et al. Citation2016). To take this technology up to the watershed level, spatially distributed hydrological models based on energy–water balance schemes could be integrated with satellite data, thus allowing one to compute continuous and distributed SWC and evapotranspiration fluxes. Satellite data provide both input parameters (such as leaf area index, LAI) and variables for model state updates (land surface temperature, LST). A very recent effort has focused on using remotely sensed LST to calibrate the soil parameters of hydrological models, improving the understanding of model internal variables (Crow et al. Citation2003, Immerzeel and Droogers Citation2008, Gutmann and Small Citation2010, Corbari and Mancini Citation2014, Lu et al. Citation2016).
In the past decade, new technologies have been developed to measure integral soil moisture at the field or small catchment scale (Bogena et al. Citation2015). Cosmic ray neutron sensors (Zreda et al. Citation2012), global positioning systems (GPS, Larson et al. Citation2008), and geophysical measurements, such as electrical resistivity and electromagnetic induction (Calamita et al. Citation2015), are among the most promising techniques. For instance, the cosmic ray technique exploits the correlation between near-surface fast neutron counts and SWC, and enables the use of the cosmic-ray probe to sense soil moisture in a footprint much larger than that in point-scale methods (that is, approximately 200 m in radius).
At the point scale, besides destructive gravimetric sampling, electromagnetic (EM) methods based on the dependency of the soil dielectric permittivity on SWC (Romano Citation2014), such as time domain reflectometry (TDR), time domain transmission (TDT), and capacitance and impedance sensors, are most commonly used for soil water content measurements. The estimation of soil water stable isotope ratios also provides useful insights into the origin, residence times, transport processes and flow paths of water in the unsaturated and saturated zones (Rothfuss et al. Citation2013, Volkmann and Weiler Citation2014). To this end, soil vapour extraction through costly commercial probes enables gas extraction from a single depth. To address this issue, a 3D printable soil gas probe with modular capabilities that allows the vertical stacking of gas extraction points at different depths in the soil column has been designed at Oregon State University.Footnote4 By using the probe, soil gas can be directly analysed or trapped for transport to a laboratory.
3.5 Temperature
With regard to air temperature, Overeem et al. (Citation2013b) demonstrated that smartphones can be employed to retrieve relatively accurate temperature information for urban areas. Using an Android application they collected more than two million readings of smartphone battery temperatures for eight major cities around the world, covering a wide range of climate zones: Buenos Aires (Argentina), London (UK), Los Angeles (USA), Paris (France), Mexico City (Mexico), Moscow (Russia), Rome (Italy) and São Paulo (Brazil). Overeem et al. (Citation2013b) employed a simple steady-state heat transfer model to estimate daily mean air temperatures from the crowdsourced smartphone battery temperatures. Their results showed the potential of this opportunistic technique for real-time air temperature monitoring in densely populated areas (Droste et al. Citation2017).
Small, self-recording temperature sensors have been utilized to estimate variability in snow-covered areas and, therefore, infer the amount of snow accumulated until the melt season (Lundquist and Lott Citation2008). In this application, self-recording temperature sensors, with an accuracy better than ± 0.5°C and costing US$30, have been deployed to record hourly data for about a year in California and Colorado, USA. Similarly, air temperature has been monitored by hanging such inexpensive sensors in dense stands of trees (Lundquist and Huggett Citation2008). Trees have proved to provide inexpensive radiation shields for temperature sensors from incident and reflected solar radiation, thus considerably improving measurement accuracy. Temperature sensors can also be used to measure fluxes between surface water and groundwater (Keery et al. Citation2007). Surface water, with diurnally-varying temperature, mixes with groundwater, with constant temperature. Advection and diffusion of heat can be solved for vertical water fluxes. Emerging software (Voytek et al. Citation2014, Koch et al. Citation2016) and inexpensive temperature profilers (Yourd Citation2017) make this approach likely to grow, especially considering contaminant transport and biogeochemical reactions across the hyporheic zone.
3.5.1 Distributed temperature sensing
The community-serving Center for Transformative Environmental Monitoring Programs (CTEMPs; ctemps.org) has developed and disseminated the emerging technology of distributed fibre-optic temperature sensing (DTS) to over 60 projects worldwide over the past 6 years of operation. This method uses fibre-optic cables to measure temperature along the cable’s length from the backscattered light of a laser pulse. Within the hydrological sciences, DTS first gained prominence in the measurement of groundwater–surface water exchanges (Selker et al. Citation2006b, Citation2006a). Subsequently, DTS use has expanded to monitoring vertical exchange (Vogt et al. Citation2010, Briggs et al. Citation2012) and large-scale river exchange (Slater et al. Citation2010, Mwakanyamale et al. Citation2012). The majority of CTEMPs-supported stream aquifer exchange research has been conducted and reported by young investigators and students, who have taken these early advances and applied DTS to fisheries and stream restoration research (Boughton et al. Citation2012, Buck and Null Citation2013, Bond et al. Citation2015), as well as to the analysis of contaminant inputs into streams (Tripathi Citation2013). Petrides et al. (Citation2011) was the first to apply DTS to the measurement of radiation balances in streams, using a suspended optical fibre to monitor the daily progression of direct and diffuse light over a 300-m reach of a salmon spawning stream, while Neilson et al. (Citation2010) developed correction factors for radiation gain on DTS cables to enable realistic temperature monitoring in aquatic environments.
The DTS approach has now been extensively utilized to study groundwater flow and karst aquifer dynamics. Under an early CTEMPs pilot project, Leaf et al. (Citation2012) developed a new thermal borehole logging approach to identify zones of aquifer exchange within boreholes. Short-circuiting of aquifer exchange through open boreholes represents a significant potential for contamination, and by injecting a point source of heat at various depths in a borehole, Leaf et al. (Citation2012) were able to continuously measure the advection of the thermal pulse and calculate groundwater exchange, as well as directly observe inflow back into the formation. Hausner et al. (Citation2012, Citation2013) used DTS fibres in Devils Hole (California, USA), a karst aquatic environment home to the last remaining Devils Hole pupfish, to document the rate of habitat warming due to climate change. Developments by the CTEMPs team (Sayde et al. Citation2010, Citation2015, Steele-Dunne et al. Citation2010, Dong et al. Citation2016) in the measurement of soil temperatures over large spatial scales have led to a number of advances in quantifying soil heat flux (Lutz et al. Citation2012) and soil moisture (Striegl and Loheide Citation2012, Benítez-Buelga et al. Citation2016). Lutz et al. (Citation2012) investigated the changes brought about by forest management (thinning and logging) on forest floor temperatures by stringing optical fibres on and through an actively managed forest floor. While the installation was challenging, the authors were able to observe much higher and more spatially variable soil temperatures following thinning, and documented links between increased temperature and reduced species diversity, likely due to both radiation and reduced moisture content. DTS systems have also opened up new opportunities for high spatial/temporal monitoring of ocean mixing (Stern et al. Citation2013), internal waves, hydrogeology (Bense et al. Citation2016), surface temperature dynamics (Arnon et al. Citation2016) and solar pond dynamics (Suárez et al. Citation2011). The ability to remotely measure, at high spatial scales, the evolution of temperature within the water column now provides much higher resolution of mixing processes and provides observations to drive ocean and sub-ice shelf mixing models.
3.6 Evapotranspiration
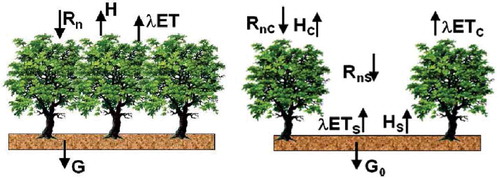
A reliable quantification of evapotranspiration, along with the related energy balance fluxes, is crucial in several hydrological and agro-meteorological applications, including drought monitoring and agricultural water management (Anderson et al. Citation1997, Allen et al. Citation2005, Cammalleri et al. Citation2012) under a wide range of water availability conditions. Single source (SEBAL, Bastiaanssen et al. Citation1998; SEBS, Su Citation2002) and two source (TSEB, Norman et al. Citation1995) energy balance models are widely used to estimate the spatial distribution of evapotranspiration through remote sensing data on homogeneous and sparsely vegetated soil vegetation systems, respectively (see ). However, inconsistencies could arise from using different data sources. The absolute accuracy of LST becomes a relevant source of uncertainty in SEB approaches (Liu et al. Citation2007).
Figure 5. Surface energy balance schemes: one-source (Surface Energy Balance Algorithm for Land, SEBAL, left) and two-source (Two Source Energy Balance, TSEB, right). Adapted from Ciraolo et al. (Citation2012).
A surface renewal method to estimate sensible heat flux requiring only LST and a few meteorological forcings as input (Castellví et al. Citation2016) was derived under unstable conditions over a heterogeneous canopy. By using multi-temporal thermal acquisitions from satellites, aerial surveys, or drones, the method overcomes the inconsistency between LST and mean aerodynamic temperature. The Atmosphere–Land Exchange Inverse (ALEXI) and the related disaggregation algorithm (DisALEXI) package provides self-consistent evapotranspiration retrievals as well (Anderson et al. Citation2011). ALEXI is a multi-sensor TIR approach to evapotranspiration mapping, coupling a two-source land-surface model with an atmospheric boundary layer model in time-differencing mode. DisALEXI spatially downscales ALEXI fluxes to finer spatial scales through higher spatial resolution TIR imagery.
3.7 Vegetation
Improving the representation of vegetation dynamics is essential to increasing the accuracy and reliability of hydrological assessments, such as land surface hydrological models (Liang et al. Citation1994).
To estimate the seasonal evolution of these variables over broad areas, time series of satellite imagery collected in the visible and near-infrared wavelengths are used, relying on established correlations between derived vegetation indices (for instance, NDVI, EVI, MSAVI) and LAI, as well as yield (such as seasonally integrated NDVI; Estes et al. Citation2013). Remote assessments of vegetation properties face several important challenges. One is that the data collected by sensors often do not directly measure variables of interest (for instance, crop yield), but instead are more closely correlated with a proxy variable (such as net primary production, Tucker et al. Citation1981). Another problem is the necessary trade-off between spatial and temporal resolution faced by satellite imaging, which results in the reliance on coarser sensors (such as MODIS) to obtain high-frequency (daily to weekly or twice-weekly, depending on cloud cover) observations, whereas higher-resolution imaging via Landsat, Sentinel and the increasing constellation of commercial satellites is necessarily less frequent (weekly to monthly or multi-monthly). Lately, however, several developments are helping to overcome the second limitation. The recent launch of the higher-frequency Sentinel 2 constellation (Drusch et al. Citation2012) and the large numbers of low-cost satellites that are now being deployed (Hand Citation2015) create the possibility for near-daily high- to moderate-resolution images to be collected.
These advances in satellite imaging are occurring at the same time as the development of new automated, low-cost, in situ sensing technologies (Wolf et al. Citation2012), which allow the creation of extensive sensor networks that can provide high-quality time series of data to validate space-borne vegetation measurements. Using intermediate-scale imaging collected from UASs may help to further improve the accuracy of up-scaling from field to space (Gaveau et al. Citation2014). UAS-based imagery has terrific implications for vegetation monitoring by enabling high-throughput phenotyping of vegetation under stressed conditions (Berni et al. Citation2009, Zarco-Tejada et al. Citation2012, Ludovisi et al. Citation2017). In changing climatic and hydrological conditions, high-yield, plant-based feedstocks offer a valid alternative to alleviate global dependence on fossil fuels (Harfouche et al. Citation2012). However, feedstocks should offer yield stability in increasingly extreme and frequent drought conditions. To this end, proximal sensing, based on the integration of UAS technology and imagery, affords monitoring of extended areas (of the order of several ha) at high spatial and temporal resolutions see, for instance.Footnote5
Advances in analytical approaches, such as segmentation and semi-automatic machine learning algorithms (Lim Citation1990, Forsyth and Ponce Citation2011), are being combined with these sensing technologies to rapidly dissect the response of the ecosystem to challenging climatic conditions, thus opening new avenues in forest management and environmental monitoring. For example, more direct estimates of crop yield can be made using new methods that combine process-based models with satellite observations. In this approach, ensemble runs of a mechanistic crop model are used to develop simpler empirical relationships between final yield and LAI throughout the growing season, whereupon these relationships are applied with satellite-based measurements of LAI to retrieve predicted yield values over large areas (Lobell et al. Citation2015, Burke and Lobell Citation2017). Such approaches circumvent the need for dense LAI time series, and therefore allow higher-resolution, lower-frequency observations to be used. The accuracy of such approaches will be further improved as more accurate agricultural land-cover maps are developed, using new approaches that combine crowdsourcing (Estes et al. Citation2016) and newer computer vision and machine learning methods (Debats et al. Citation2016).
At the field scale, monitoring vegetation growth over seasonal time scales typically relies on point-based estimates of attributes such as LAI and biomass, and, for many agricultural species, destructive sampling to obtain yield estimates. In addition to being time and labour intensive, these field methods can also produce unreliable estimates (Burke and Lobell Citation2017). Imagery has demonstrated remarkable potential toward monitoring vegetation and biomass structure. For instance, the Microsoft Kinect infrared sensor has been utilized to determine the plant structure and size of several species (Azzari et al. Citation2013).
3.8 Sensing networks
Measurements at the catchment scale are key to understanding water balances, flooding, and how the flow of water across and through a watershed is affected by connections to the broader natural system, including the geology and ecology. Here, we focus on innovative systems that can be used to observe catchment-scale processes, including (i) open-source data loggers, (ii) wireless sensor networks, (iii) isotopic tracers and (iv) unmanned aerial systems.
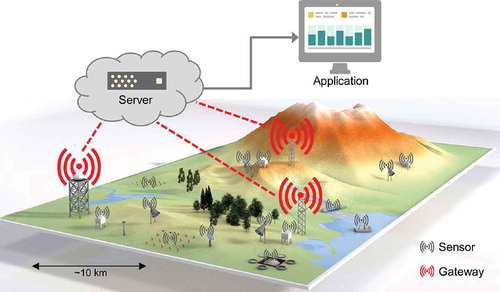
Hydrological monitoring often requires a central data logger to store data, communicate with sensors and record the timing of measurements. Such systems are also responsible for powering instruments and using telemetry to send information back to a place where scientists can retrieve it. These data loggers are often (i) among the most expensive parts of a field sensor platform and (ii) built to be easily integrated with expensive proprietary sensors. An open-source alternative, therefore, can reduce costs both directly and indirectly by being inexpensive and providing easier integration with low-cost third-party sensors. The ALog data logger (Wickert Citation2014) (see ), which is compatible with the popular open-source Arduino platform (Barragán Citation2004, Banzi and Shiloh Citation2014), satisfies these needs while also being low-power (enabling long-term operations on AA or D batteries), lightweight and having several Gb of data storage capacity. Its open-source software libraryFootnote6 manages its basic system operations (that is, clock, power, data storage, communications, failsafes) and includes a documented and expandable set of pre-written functions to connect with sensors via any standard interface protocol. These functions currently support common sensors for weather stations, catchment-scale hydrology, and stream and snow gauging. Hicks et al. (Citation2015) likewise developed the Arduino-based Mayfly data logger as a telemetry enabled platform for use in hydrological monitoring networks, and it is an integral part of the EnviroDIY community for development of environmental monitoring technologies. Wireless sensor network (WSN) technology enables the distributed sensing of hydrological states and fluxes at the catchment scale (Inagaki et al. Citation2011, Jin et al. Citation2014). WSNs consist of a multitude of small sensor nodes embedded in the environment that can quantify spatially heterogeneous phenomena, such as temperature or soil moisture fields and vegetation conditions at high spatiotemporal resolution (Qu et al. Citation2014, Wiekenkamp et al. Citation2016). One of the first low-cost mesh networking proprietary standards used for WSNs is ZigBee (Valente et al. Citation2006). However, their 2.4-GHz low-power radio module limits the communication range between sensor nodes to less than approx. 1 km. The recently introduced LoRa system for long-range, low-power, low-bitrate and wireless communication offers network coverage of several kilometres (Augustin et al. Citation2016) (see ). Inexpensive and easy-to-calibrate sensors are often chosen for nodes to maximize spatial coverage for a given budget (Bogena et al. Citation2017a). WSNs are extremely flexible and can also be used temporarily to assess spatial heterogeneity of ecosystem states in areas that are not part of a “fixed” sensor network. Moreover, WSNs can operate periodically on a regular or event-driven basis to better capture nonlinear processes in catchments, such as soil saturation excess overland flow, preferential flow patterns and heat islands.
Figure 6. Andy Wickert (left) and Rachel McLaughlin (right) construct a glacier monitoring station to measure snow depth, ice melt, temperature and relative humidity on Volcán Chimborazo, Ecuador, where tropical glaciers are rapidly retreating (La Frenierre and Mark Citation2017). The monitoring station is built from off-the-shelf components, and is centred around an open-source ALog data logger (inside the white box in AW’s hand) which records measurements at constant time intervals. Expanding use of low-cost, low-power and off-the-shelf environmental monitoring tools is critical for data collection in remote areas (Wickert Citation2014), especially those that are experiencing rapid environmental change which threatens communities with limited resources (La Frenierre and Mark Citation2014).
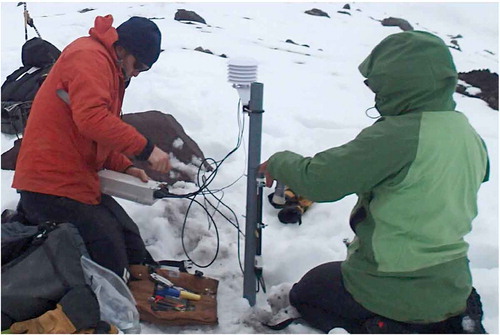
Figure 7. Principle of LoRa networks for wireless data communication between different types of sensors with network coverage of several kilometres. Adapted from Bogena et al. (Citation2017b).
Analysis of flow paths is also crucial to understanding hydrological processes at the catchment scale, and stable isotopes are a valuable tracer. La Frenierre and Mark (Citation2017) developed and deployed totalizing rain gauges that use a ping-pong ball in a funnel. When water enters the funnel, the ball floats, allowing the water to flow downwards into a reservoir; once the rain stops, the ball settles into the bottom of the funnel atop the reservoir, and acts as a seal. Such approaches are necessary to avoid biasing a signal with isotopic fractionation during the sampling process, and allow samples for isotopic analyses to be gathered with equipment that can be purchased from local shops.
Toward upscaling hydrological measurements, UASs are an emerging technology that is rapidly transforming the way we sense the environment. The flexibility of such platforms affords fully remote observations of streamflow, temperature and water level, among others. The latest technological advancements have contributed to a large diffusion of low-cost yet high-performance platforms in the market. In the realm of hydrology, UASs are an important component of the available experimental toolbox, with unprecedented potential in ecohydrology, landscape evolution and agricultural management. Most frequently, UAS technology is combined with image sensing equipment, such as RGB, thermal and hyperspectral cameras, for quick and high-resolution monitoring of extended or difficult-to-access environments. Once images are collected, they are usually orthorectified, georeferenced, mosaicked and then processed to extract quantitative data. Several studies have utilized UAS-based images to estimate the NDVI and LAI over cultivated areas. The characterization of the kinematics of surface waters is another promising application that is growing rapidly in the hydrological community (Detert and Weitbrecht Citation2015, Tauro et al. Citation2016b, Bandini et al. Citation2017, Bolognesi et al. Citation2017).
3.9 Collaborative efforts
Citizen science and participatory platforms constitute promising approaches for massive collection and analysis of hydrological data. For instance, an increasing number of personal weather stations (PWSs) automatically upload rainfall measurements to online platforms, particularly in urban areas. De Vos et al. (Citation2017) examined the potential of such crowdsourced data for obtaining high-resolution rainfall measurements for the Amsterdam metropolitan area, the Netherlands. A detailed analysis of rainfall data from more than 60 stations over an area of nearly 600 km2 during several months confirmed that the growing number of internet-connected PWSs can be used successfully for urban rainfall monitoring. Remaining challenges include accounting for uncertainties in the PWS data resulting from both the imperfect measurement set-up and rounding and threshold processes that occur during the data transfer to the online PWS platform. These sources of error may cause considerable deviations from rainfall measurements obtained using dedicated rain gauges and gauge-adjusted weather radars.
Brooklyn Atlantis offers a first example of the integration of water measurements in an online citizen science environment (Laut et al. Citation2014). From their homes, citizen scientists log in to the Brooklyn Atlantis project to help analyse images that are routinely collected by aquatic robots in the Gowanus Canal in Brooklyn, USA. By tagging objects on the images and relating them to key water parameters acquired by the robot, such as pH and temperature, Brooklyn Atlantis could help advance our understanding of the Gowanus Canal, one of the most polluted bodies of water in the USA. Citizen science could contribute to scientific research for a number of reasons, from a desire to help the environment to individual reputation. Brooklyn Atlantis researchers have sought to clarify the psychological underpinnings of citizen science participations through a number of hypothesis-driven studies in human behaviour (Cappa et al. Citation2016, Nov et al. Citation2016, Laut et al. Citation2017, Diner et al. Citationin press).
The Trans-African Hydro-MeteorologicalObservatory Footnote7 is an initiative that seeks to develop, install and maintain a dense network of weather stations across sub-Saharan Africa (van de Giesen et al. Citation2014). Eventually, the goal is to have one station per 1000 km2, corresponding to a total of 20 000 stations. Presently, 1-day rainfall predictions over Africa are of comparable accuracy to 10-day forecasts over Europe (Haiden et al. Citation2012). By improving ground observations, the all-important rainfall and weather forecasts are expected to improve considerably, and thereby support planning of agricultural, logistical and construction activities. TAHMO fits well with the MOXXI initiative, as an important characteristic of the weather stations is that they are based on innovative sensing techniques. Specifically, there are no moving parts, as these tend to require a lot of maintenance in the African climate. The presently used stations were (co-)developed by the Meter Group and measure rainfall, wind speed and direction, incoming shortwave radiation, air temperature and relative humidity, as well as barometric pressure. Interestingly, robust validation for the TAHMO rain gauge, which would provide indication if other sensors on the TAHMO station were malfunctioning, was guaranteed by developing a “Super Validator” which consists of a Pythagorean cup packed with fibreglass wick. The device is supported on a temperature-compensated strain gauge (less than US$3) and read with a 24-bit A-to-D recorded by an Arduino (electronics under US$10). The rain is recorded like a classical self-emptying rain gauge, while the system retains about 6 cm of water in the wick, which is monitored between rainfall/irrigation events as a measure of evaporation. By comparing the observed evaporation to the measured wind, humidity, solar radiation and temperature, discrepancies in predicted and observed values can be used as indicators of faulty sensors. Further, the observed evaporation is highly informative with respect to hydrological processes. Within TAHMO weather stations, a GPS, compass and accelerometer are also included to allow control of the continued proper installation of the station. The sensor suite and communication module are powered by a single embedded solar cell the size of a business card. Data are communicated between 4 and 24 times per day through GPRS (mobile phone). The stations have some redundancy to further allow quality control. Automated QA/QC is performed on the TAHMO servers. In addition to the novel technology, TAHMO distinguishes itself from earlier initiatives by actively building public–private partnerships (PPPs) with national meteorological agencies. Memoranda of understanding (MoUs) are now in place in 13 African countries. Although non-commercial data use for science and government is free, commercial usage is subject to a fee to make the system financially sustainable. The PPPs serve to both strengthen the national meteorological agencies and develop new business models and activities. Finally, it is important to note that TAHMO stations are mainly being installed at secondary schools, where they are linked to the science, technology, engineering and mathematics curriculum.
The development of innovative measurement systems represents a critical step in the understanding of Earth surface processes. An equally important step is the effective delivery of these emerging technologies to researchers who can use enhanced measurements. Critical barriers include experimental design, access to appropriate equipment and access to expert technical support. Community-serving technology centres, such as CTEMPs, are an essential ingredient in the efficient adoption of new technologies. CTEMPS is a way out of the conundrum of an individualized community working in many different locations and on different processes, with access to expensive experimental equipment. The OPEnS lab is another example of how to facilitate the adoption of new technology in the hydrological community. The lab provides the tools (from support in designing to soldering and 3D printing) for students, professors and researchers to develop their environmental sensing projects worldwide. CTEMPs and the OPEnS lab facilitate the advancement in Earth observation by acting on three factors. First, new observation methods can provide transformative science. For instance, the DTS provides about four orders of magnitude improvement in observation when compared to traditional temperature monitoring approaches. A “follow the zeros” approach to novel observations is at play here: if new approaches allow orders of magnitude greater resolution of observation due to lower cost, improved technology, or a combination of both, then transformation of observation is to be expected. Second, adoption of new technology must be guided. The greatest risk to a young investigator is to be seduced by a new approach which turns out to have hidden pitfalls that preclude success. CTEMPs first provides deep training so that potential users can correctly identify if the technology they read about is truly appropriate for their goals. Finally, collaborating as a community is essential to remove the financial and logistical barriers to adoption of new tools. In the case of CTEMPs, they provide users with hundreds of thousands of dollars worth of equipment at low (for professors) or no (for students) cost. But cost is just one of the barriers. People think of 3D printing and microprocessor-based data systems as “cheap”, but they forget the knowledge base required to be successful in using these technologies. After all, how else can we explain the rather low rate of penetration of these technologies into hydrological science given they have been readily available for a decade? In this vein, forming a community approach will be transformative, and the OPEnS lab is an example of how to remove these critical barriers to the adoption of new technology.
4 Future opportunities and challenges
Although the MOXXI community is relatively young, the group is promoting collaboration among diverse research groups in hydrology and other fields of science, and is expected to help redefine the role and expertise of hydrologists. In our vision, complex hydrological problems should be addressed by teams of scientists, whereby hydrologists will be able to share their research questions and interact with experts in other fields, such as robotics and electronics.
In this respect, MOXXI strives to be an inclusive community by inviting experts from fields other than hydrology to participate in conferences and research projects. Hopefully, its diversity will facilitate research progress by keeping MOXXI members updated with respect to the latest innovations and achievements and by providing access to a multi-disciplinary pool of experts. The Sustainable Development Goals (SDGs), especially SDG 6: Clean Water and Sanitation, adopted by the UN General Assembly in 2015 (UN Citation2015), as well as the need for assessing the impacts of multiple driving changes on the water cycle (Montanari et al. Citation2013), are creating an increased demand for more extensive observations, denser monitoring networks, their long-term sustainability, especially in developing countries, and a quality of observed data compatible with the international requirements, also from non-conventional sources, such as citizen observations. The Global Innovation HubFootnote8 of the World Meteorological Organization (WMO) would provide a framework to develop and implement innovative tools for water monitoring and information systems through calls for novel hydrometric designs, coordination with ongoing projects and donors, including testing and implementation of new monitoring technology and methodology in field projects.
Despite these promising opportunities, several challenges remain to be addressed when establishing novel observational approaches:
Many recently introduced observational approaches need thorough assessment to be routinely adopted in monitoring practice. Building novel sensing instrumentation requires extensive calibration and validation, and sometimes collaboration from local authorities should be sought to allow the installation of novel equipment in natural systems or at existing gauging stations. Also, in some cases, national regulations do not allow the use of robotic platforms (UASs) for monitoring purposes.
Recent (see, for instance, Sentinel-1/3, Jason-3) and upcoming (such as SWOT) satellite missions will provide more accurate and spatially distributed hydrological variables. However, the exploitation of this wealth of data requires a capacity-building community that ensures the identification and validation of proper methodologies and adequate ground-truthing, as well as the promotion of a closer relationship among authorities, stakeholders and the research community (Schumann and Domeneghetti Citation2016).
Continuously growing innovative observational approaches often deal with diverse spatial and temporal scales. Reconciling and complementing observations from such an abundant pool of methodologies, devices and platforms is the ultimate goal of the research community towards an improved understanding of hydrological processes. In this context, the recently funded COST action HARMONIOUS on the “harmonization of UAS techniques for agricultural and natural ecosystems monitoring” represents the first initiative to collectively develop some of the activities undertaken by MOXXI members. The project will establish harmonized monitoring practices, enhance the use of observations and promote innovative monitoring strategies. More specifically, within the Action, several key challenges in environmental monitoring have been identified and will be discussed and tackled by working groups involving scientists from more than 30 different countries. The general effort will be devoted to the harmonization of UAS monitoring techniques, procedures and data interpretation. Working groups will closely interact with the Action members (including stakeholders) and facilitate the identification of unique protocols for the use of UASs in diverse environmental conditions.
While we hope that similar initiatives will nurture a more involved and multi-disciplinary hydrological community, we acknowledge that innovative observational approaches cannot replace conventional monitoring yet, and that hydrological monitoring still relies heavily on traditional measurement approaches. Therefore, the exploration of novel avenues in hydrological monitoring will only be possible if traditional global monitoring networks are maintained and supported.
Acknowledgements
The authors and the IAHS umbrella organization greatly acknowledge the European Space Agency for hosting the First Topical MOXXI Conference 2016. The MOXXI Working Group is continuously looking for friends to engage in new exciting research. To become a member, please visit the MOXXI webpage (https://iahs.info/Commissions–W-Groups/ Working-Groups/MOXXI.do).
Disclosure statement
No potential conflict of interest was reported by the authors.
Notes
5 See, for instance, http://ctemps.org/airctemps.
7 TAHMO, www.tahmo.org.
References
- Aberle, J., et al., eds., 2017. Experimental hydraulics: methods, instrumentation, data processing and management. Vol. Volume II: instrumentation and measurement techniques. London: CRC Press.
- Alfieri, L., et al., 2014. Advances in pan-European flood hazard mapping. Hydrological Processes, 28 (13), 4067–4077. doi:10.1002/hyp.9947
- Allamano, P., Croci, A., and Laio, F., 2015. Toward the camera rain gauge. Water Resources Research, 51 (3), 1744–1757. doi:10.1002/2014WR016298
- Allen, R.G., et al., 2005. A Landsat-based energy balance and evapotranspiration model in Western US water rights regulation and planning. Irrigation and Drainage Systems, 19 (3), 251–268. doi:10.1007/s10795-005-5187-z
- Anderson, M.C., et al., 1997. A two-source time-integrated model for estimating surface fluxes using thermal infrared remote sensing. Remote Sensing of Environment, 60, 195–216. doi:10.1016/S0034-4257(96)00215-5
- Anderson, M.C., et al., 2011. Mapping daily evapotranspiration at field to continental scales using geostationary and polar orbiting satellite imagery. Hydrology and Earth System Sciences, 15, 223–239. doi:10.5194/hess-15-223-2011
- Arnon, A., Selker, J.S., and Lensky, N.G., 2016. Thermohaline stratification and double diffusion diapycnal fluxes in the hypersaline Dead Sea. Limnology and Oceanography, 61 (4), 1214–1231. doi:10.1002/lno.10285
- Aubert, A.H., et al., 2013. Solute transport dynamics in small, shallow groundwater-dominated agricultural catchments: insights from a high-frequency, multisolute 10 yr-long monitoring study. Hydrology and Earth System Sciences, 17 (4), 1379–1391. doi:10.5194/hess-17-1379-2013
- Augustin, A., et al., 2016. A study of LoRa: long range & low power networks for the internet of things. Sensors, 16 (9), 1466. doi:10.3390/s16091466
- Azzari, G., Goulden, M.L., and Rusu, R.B., 2013. Rapid characterization of vegetation structure with a Microsoft kinect sensor. Sensors, 13 (2), 2384–2398. doi:10.3390/s130202384
- Bai, X., et al., 2016. Plausible and desirable futures in the Anthropocene: A new research agenda. Global Environmental Change, 39, 351–362. doi:10.1016/j.gloenvcha.2015.09.017
- Baldwin, D., et al., 2017. Predicting root zone soil moisture with soil properties and satellite near-surface moisture data across the conterminous United States. Journal of Hydrology, 546, 393–404. doi:10.1016/j.jhydrol.2017.01.020
- Bandini, F., et al., 2017. Measuring water level in rivers and lakes from lightweight unmanned aerial vehicles. Journal of Hydrology, 548, 237–250. doi:10.1016/j.jhydrol.2017.02.038
- Banzi, M. and Shiloh, M., 2014. Getting started with arduino: the open source electronics prototyping platform. San Francisco, CA: Maker Media, Inc.
- Barragán, H., 2004. Wiring: prototyping physical interaction design. Thesis (Masters). Inter-action Design Institute, Ivrea, Italy.
- Bastiaanssen, W.G.M., et al., 1998. A remote sensing surface energy balance algorithm for land (SEBAL): 1. Formulation. Journal of Hydrology, 212–213, 198–212. doi:10.1016/S0022-1694(98)00253-4
- Benítez-Buelga, J., et al., 2016. Calibration of soil moisture sensing with subsurface heated fiber optics using numerical simulation. Water Resources Research, 52 (4), 2985–2995. doi:10.1002/2015WR017897
- Bense, V.F., et al., 2016. Distributed temperature sensing as a downhole tool in hydrogeology. Water Resources Research, 52 (12), 9259–9273. doi:10.1002/2016WR018869
- Bercher, N. and Kosuth, P., 2012. Monitoring river water levels from space: quality assessment of 20 years of satellite altimetry data. In: Proceedings of the symposium 20 Years of Progress in Radar Altimetry, 24–29 September 2012, Venice, Italy. Noordwijck: European Space Agency, ESA Special Publication SP-710, vol. 2–7.
- Berni, J.A.J., et al., 2009. Thermal and narrowband multispectral remote sensing for vegetation monitoring from an unmanned aerial vehicle. IEEE Transactions on Geoscience and Remote Sensing, 47 (3), 722–738. doi:10.1109/TGRS.2008.2010457
- Berry, P.A.M., Witheridge, S., and Smith, R.G., 2010. Global inland water monitoring from satellite radar altimetry – a glimpse into the future. In: Proceedings of the ESA Symposium “Living Planet”, 28 June–2 July 2010 Bergen, Norway. Noordwijck, The Netherlands: European Space Agency, ESA Special Publication SP-686, no. 2–5.
- Biancamaria, S., et al., 2009. Large-scale coupled hydrologic and hydraulic modelling of the Ob River in Siberia. Journal of Hydrology, 379 (1–2), 136–150. doi:10.1016/j.jhydrol.2009.09.054
- Birkinshaw, S.J., et al., 2010. Using satellite altimetry data to augment flow estimation techniques on the Mekong River. Hydrological Processes, 24 (26), 3811–3825. doi:10.1002/hyp.7811
- Blöschl, G., et al., eds., 2013. Runoff prediction in ungauged basins: synthesis across processes, places and scales. Cambridge: Cambridge University Press.
- Blume, T., van Meerveld, I., and Weiler, M., 2017. The role of experimental work in hydrological sciences – insights from a community survey. Hydrological Sciences Journal, 62 (3), 334–337.
- Bogena, H.R., et al., 2015. Emerging methods for non-invasive sensing of soil moisture dynamics from field to catchment scale: A review. WIREs Water, 2 (6), 635–647. doi:10.1002/wat2.1097
- Bogena, H.R., et al., 2017a. Effect calibration of low-cost soil water content sensors. Sensors, 17 (1), 208. doi:10.3390/s17010208
- Bogena, H.R., et al., 2017b. A blueprint for a distributed terrestrial ecosystem research infrastructure. In: A. Chabbi and H.W. Loescher, eds. Terrestrial ecosystem research infrastructures: challenges, new developments and perspectives. Boca Raton, FL: CRS Press, Taylor & Francis Group, 279–302.
- Bolognesi, M., et al., 2017. Measurement of surface velocity in open channels using a lightweight remotely piloted aircraft system. Geomatics, Natural Hazards and Risk, 8 (1), 73–86. doi:10.1080/19475705.2016.1184717
- Bond, R.M., Stubblefield, A.P., and Van Kirk, R.W., 2015. Sensitivity of summer stream temperatures to climate variability and riparian reforestation strategies. Journal of Hydrology: Regional Studies, 4 (Part B), 267–279.
- Boughton, D.A., Hatch, C., and Mora, E., 2012. Identifying distinct thermal components of a creek. Water Resources Research, 48 (9), W09506. doi:10.1029/2011WR011713
- Briggs, M.A., et al., 2012. Using high-resolution distributed temperature sensing to quantify spatial and temporal variability in vertical hyporheic flux. Water Resources Research, 48 (2), W02527. doi:10.1029/2011WR011227
- Brocca, L., et al., 2014. Soil as a natural rain gauge: estimating global rainfall from satellite soil moisture data. Journal of Geophysical Research: Atmospheres, 119 (9), 5128–5141.
- Brocca, L., et al., 2015. Rainfall estimation from in situ soil moisture observations at several sites in Europe: an evaluation of the SM2RAIN algorithm. Journal of Hydrology and Hydromechanics, 63 (3), 201–209. doi:10.1515/johh-2015-0016
- Brocca, L., et al., 2016. Rainfall estimation by inverting SMOS soil moisture estimates: A comparison of different methods over Australia. Journal of Geophysical Research: Atmospheres, 121 (20), 12062–12079.
- Brocca, L., et al., 2017a. A review of the applications of ASCAT soil moisture products. IEEE Journal of Selected Topics in Applied Earth Observations and Remote Sensing, 10 (5), 2285–2306. doi:10.1109/JSTARS.2017.2651140.
- Brocca, L., et al., 2017b. Soil moisture for hydrological applications: open questions and new opportunities. Water, 9 (2), 140. doi:10.3390/w9020140
- Brondizio, E.S., et al., 2016. Re-conceptualizing the Anthropocene: a call for collaboration. Global Environmental Change, 39, 318–327. doi:10.1016/j.gloenvcha.2016.02.006
- Buck, C.R. and Null, S.E., 2013. Modeling insights from distributed temperature sensing data. Hydrology and Earth System Sciences Discussions, 10, 9999–10034. doi:10.5194/hessd-10-9999-2013
- Burke, M. and Lobell, D.B., 2017. Satellite-based assessment of yield variation and its determinants in smallholder African systems. Proceedings of the National Academy of Sciences of the United States of America, 114 (9), 2189–2194. doi:10.1073/pnas.1616919114
- Burt, T.P. and McDonnell, J.J., 2015. Whither field hydrology? The need for discovery science and outrageous hydrological hypotheses. Water Resources Research, 51 (8), 5919–5928. doi:10.1002/2014WR016839
- Cai, J., et al., 2007. Estimating reference evapotranspiration with the FAO Penman Monteith equation using daily weather forecast messages. Agricultural and Forest Meteorology, 145, 22–35. doi:10.1016/j.agrformet.2007.04.012
- Calamita, G., et al., 2015. Field test of a multi-frequency electromagnetic induction sensor for soil moisture monitoring in southern Italy test sites. Journal of Hydrology, 529 (Part 1), 316–329. doi:10.1016/j.jhydrol.2015.07.023
- Cammalleri, C., et al., 2012. Daily evapotranspiration assessment by means of residual surface energy balance modeling: a critical analysis under a wide range of water availability. Journal of Hydrology, 452–453, 119–129. doi:10.1016/j.jhydrol.2012.05.042
- Capodici, F., et al., 2013. Coupling two radar backscattering models to assess soil roughness and surface water content at the farm scale. Hydrological Sciences Journal, 58 (8), 1677–1689. doi:10.1080/02626667.2013.797578
- Cappa, F., et al., 2016. Activating social strategies: face-to-face interaction in technology-mediated citizen science. Journal of Environmental Management, 182, 374–384. doi:10.1016/j.jenvman.2016.07.092
- Carlson, T.N., Capehart, W.J., and Gillies, R.R., 1995. A new look at the simplified method for remote sensing of daily evapotranspiration. Remote Sensing of Environment, 54 (2), 161–167. doi:10.1016/0034-4257(95)00139-R
- Castellvì, F., et al., 2016. Daytime sensible heat flux estimation over heterogeneous surfaces using multitemporal land-surface temperature observations. Water Resources Research, 52 (5), 3457–3476. doi:10.1002/2015WR017587
- Ceola, S., et al., 2016. Adaptation of water resources systems to changing society and environment: a statement by the International Association of Hydrological Sciences. Hydrological Sciences Journal, 61 (16), 2803–2817. doi:10.1080/02626667.2016.1230674
- Ceola, S., Laio, F., and Montanari, A., 2014. Satellite nighttime lights reveal increasing human exposure to floods worldwide. Geophysical Research Letters, 41 (20), 7184–7190. doi:10.1002/2014GL061859
- Chen, K.S., et al., 2003. Emission of rough surfaces calculated by the integral equation method with comparison to three-dimensional moment method simulations. IEEE Transactions on Geoscience and Remote Sensing, 41 (1), 90–101. doi:10.1109/TGRS.2002.807587
- Chiu, C.L., 1987. Entropy and probability concepts in hydraulics. Journal of Hydraulic Engineering, 113 (5), 583–599. doi:10.1061/(ASCE)0733-9429(1987)113:5(583)
- Ciabatta, L., et al., 2017. Daily precipitation estimation through different microwave sensors: verification study over Italy. Journal of Hydrology, 545, 436–450. doi:10.1016/j.jhydrol.2016.12.057
- Ciraolo, G., et al., 2012. Mapping evapotranspiration on vineyards: a comparison between Penman-Monteith and energy balance approaches for operational purposes. In: Remote Sensing for Agriculture, Ecosystems, and Hydrology XIV, 23 October. Edinburgh: SPIE Society of Photo-Optical Instrumentation Engineers, Proceedings of SPIE, vol. 8531, 85310Q.
- Corbari, C. and Mancini, M., 2014. Calibration and validation of a distributed energy water balance model using satellite data of land surface temperature and ground discharge measurements. Journal of Hydrometeorology, 15, 376–392. doi:10.1175/JHM-D-12-0173.1
- Costa, J., et al., 2000. Measuring stream discharge by non-contact methods – a proof-of-concept experiment. Geophysical Research Letters, 27 (4), 553–556. doi:10.1029/1999GL006087
- Crabit, A., et al., 2011a. Soft water level sensors for characterizing the hydrological behaviour of agricultural catchments. Sensors, 11 (5), 4656–4673. doi:10.3390/s110504656
- Crabit, A., Colin, F., and Moussa, R., 2011b. A soft hydrological monitoring approach for comparing runoff on a network of small poorly gauged catchments. Hydrological Processes, 25 (18), 2785–2800. doi:10.1002/hyp.v25.18
- Cressey, D., 2017. Age of the Arduino. Nature, 544, 125–126. doi:10.1038/544125a
- Crow, W.T., Wood, E.F., and Pan, M., 2003. Multiobjective calibration of land surface model evapotranspiration predictions using stream-flow observations and spaceborne surface radiometric temperature retrievals. Journal of Geophysical Research, 108, 4725. doi:10.1029/2002JD003292
- Cudennec, C., et al., 2016. Hydrometeorology and hydroclimate. Advances in Meteorology, 1487890, 1–4.
- De Vos, L., et al., 2017. The potential of urban rainfall monitoring with crowdsourced automatic weather stations in Amsterdam. Hydrology and Earth System Sciences, 21 (2), 765–777. doi:10.5194/hess-21-765-2017
- Debats, S.R., et al., 2016. A generalized computer vision approach to mapping crop fields in heterogeneous agricultural landscapes. Remote Sensing of Environment, 179, 210–221. doi:10.1016/j.rse.2016.03.010
- Detert, M. and Weitbrecht, V., 2015. A low-cost airborne velocimetry system: proof of concept. Journal of Hydraulic Research, 53 (4), 532–539. doi:10.1080/00221686.2015.1054322
- Diner, D., et al., In press. Social signals as design interventions for enhancing citizen science contributions. Information, Communication & Society, 21 (4), 1–18.
- Domeneghetti, A., et al., 2015. Investigating the uncertainty of satellite altimetry products for hydrodynamic modelling. Hydrological Processes, 29 (23), 4908–4918. doi:10.1002/hyp.10507
- Domeneghetti, A., 2016. On the use of SRTM and altimetry data for flood modeling in datasparse regions. Water Resources Research, 52 (4), 2901–2918. doi:10.1002/2015WR017967
- Dong, J., et al., 2016. Mapping high-resolution soil moisture and properties using distributed temperature sensing data and an adaptive particle batch smoother. Water Resources Research, 52 (10), 7690–7710. doi:10.1002/2016WR019031
- Droste, A.M., et al., 2017. Crowdsourcing urban air temperatures through smartphone battery temperatures in São Paulo, Brazil. Journal of Atmospheric and Oceanic Technology, 34 (9), 1853–1866. doi:10.1175/JTECH-D-16-0150.1
- Drusch, M., et al., 2012. Sentinel-2: ESA’s optical high-resolution mission for GMES operational services. Remote Sensing of Environment, 120, 25–36. doi:10.1016/j.rse.2011.11.026
- Durand, M., et al., 2008. Estimation of bathymetric depth and slope from data assimilation of swath altimetry into a hydrodynamic model. Geophysical Research Letters, 35 (20), L20401. doi:10.1029/2008GL034150
- Durand, M., et al., 2014. Estimating reach-averaged discharge for the River Severn from measurements of river water surface elevation and slope. Journal of Hydrology, 511, 92–104. doi:10.1016/j.jhydrol.2013.12.050
- Estes, L.D., et al., 2013. Comparing mechanistic and empirical model projections of crop suitability and productivity: implications for ecological forecasting. Global Ecology and Biogeography, 22 (8), 1007–1018. doi:10.1111/geb.12034
- Estes, L.D., et al., 2016. A platform for crowdsourcing the creation of representative, accurate landcover maps. Environmental Modelling & Software, 80, 41–53. doi:10.1016/j.envsoft.2016.01.011
- Feki, H., Slimani, M., and Cudennec, C., 2017. Geostatistically based optimization of a rainfall monitoring network extension: case of the climatically heterogeneous Tunisia. Hydrology Research, 48 (2), 514–541. doi:10.2166/nh.2016.256
- Feurer, D., et al., 2008. Very-high-resolution mapping of river-immersed topography by remote sensing. Progress in Physical Geography, 32 (4), 403–419. doi:10.1177/0309133308096030
- Forsyth, D.A. and Ponce, J., 2011. Computer vision: a modern approach. Harlow: Pearson Education Limited.
- Frappart, F., et al., 2015. Preliminary assessment of SARAL/AltiKa observations over the Ganges-Brahmaputra and Irrawaddy rivers. Marine Geodesy, 38, 568–580. doi:10.1080/01490419.2014.990591
- Fujita, I., Muste, M., and Kruger, A., 1997. Large-scale particle image velocimetry for flow analysis in hydraulic engineering applications. Journal of Hydraulic Research, 36 (3), 397–414. doi:10.1080/00221689809498626
- Gao, J., 2009. Bathymetric mapping by means of remote sensing: methods, accuracy and limitations. Progress in Physical Geography, 33 (1), 103–116. doi:10.1177/0309133309105657
- Garel, E. and D’Alimonte, D., 2017. Continuous river discharge monitoring with bottom mounted current profilers at narrow tidal estuaries. Continental Shelf Research, 133, 1–12. doi:10.1016/j.csr.2016.12.001
- Gaveau, D.L.A., et al., 2014. Major atmospheric emissions from peat fires in Southeast Asia during non-drought years: evidence from the 2013 Sumatran fires. Scientific Reports, 4, 6112. doi:10.1038/srep06112
- Getirana, A.C.V., 2010. Integrating spatial altimetry data into the automatic calibration of hydrological models. Journal of Hydrology, 387 (3–4), 244–255. doi:10.1016/j.jhydrol.2010.04.013
- Gilmore, T.E., Birgand, F., and Chapman, K.W., 2013. Source and magnitude of error in an inexpensive image-based water level measurement system. Journal of Hydrology, 496, 178–186. doi:10.1016/j.jhydrol.2013.05.011
- Gleick, P.H., 1998. Water in crisis: paths to sustainable water use. Ecological Applications, 8 (3), 571–579. doi:10.1890/1051-0761(1998)008[0571:WICPTS]2.0.CO;2
- Gosset, M., et al., 2016. Improving rainfall measurement in gauge poor regions thanks to mobile telecommunication networks. Bulletin of the American Meteorological Society, 97 (3), ES49–ES51. doi:10.1175/BAMS-D-15-00164.1
- Gowing, J.W. and Ejieji, C.J., 2001. Real-time scheduling of supplemental irrigation for potatoes using a decision model and short term weather forecasts. Agricultural Water Management, 47, 137–153. doi:10.1016/S0378-3774(00)00101-3
- Grant, G.E. and Dietrich, W.E., 2017. The frontier beneath our feet. Water Resources Research, 53 (4), 2605–2609. doi:10.1002/2017WR020835
- Grayson, R.B., et al., 1997. Preferred states in spatial soil moisture patterns: local and nonlocal controls. Water Resources Research, 33 (12), 2897–2908. doi:10.1029/97WR02174
- Gupta, R.P. and Banerji, S., 1985. Monitoring of reservoir volume using LANDSAT data. Journal of Hydrology, 77 (1), 159–170. doi:10.1016/0022-1694(85)90204-5
- Gutmann, E.D. and Small, E.E., 2010. A method for the determination of the hydraulic properties of soil from MODIS surface temperature for use in land surface models. Water Resources Research, 46, W06520. doi:10.1029/2009WR008203
- Haberlandt, U. and Sester, M., 2010. Areal rainfall estimation using moving cars as rain gauges – a modelling study. Hydrology and Earth System Sciences, 14 (7), 1139–1151. doi:10.5194/hess-14-1139-2010
- Haiden, T., et al., 2012. Intercomparison of global model precipitation forecast skill in 2010/11 using the SEEPS score. Monthly Weather Review, 140 (8), 2720–2733. doi:10.1175/MWR-D-11-00301.1
- Hall, A.C., et al., 2012. Geodetic corrections to Amazon River water level gauges using ICESat altimetry. Water Resources Research, 48 (6), W06602. doi:10.1029/2011WR010895
- Hand, E., 2015. Startup liftoff. Science, 348 (6231), 172–177. doi:10.1126/science.348.6231.172
- Hannah, D.M., et al., 2011. Large-scale river flow archives: importance, current status and future needs. Hydrological Processes, 25 (7), 1191–1200. doi:10.1002/hyp.7794
- Harfouche, A., et al., 2012. Accelerating the domestication of forest trees in a changing world. Trends in Plant Science, 17 (2), 64–72. doi:10.1016/j.tplants.2011.11.005
- Hausner, M.B., et al., 2012. Interpreting seasonal convective mixing in Devils Hole, Death Valley National Park, from temperature profiles observed by fiber-optic distributed temperature sensing. Water Resources Research, 48 (5), W05513. doi:10.1029/2011WR010972
- Hausner, M.B., et al., 2013. The shallow thermal regime of Devils Hole, Death Valley National Park. Limnology and Oceanography: Fluids and Environments, 3 (1), 119–138.
- Hicks, S.D., et al., 2015. A new Arduino datalogger board for simple, low cost environmental monitoring and the EnviroDIY web community. In: American Geophysical Union, Fall Meeting, no. H23G-1658, 14–18 December.San Francisco, CA. Washington, DC: American Geophysical Union.
- Hoitink, A.J.F., Buschman, F.A., and Vermeulen, B., 2009. Continuous measurements of discharge from a horizontal acoustic Doppler current profiler in a tidal river. Water Resources Research, 45 (11), W11406. doi:10.1029/2009WR007791
- Hou, A.Y., et al., 2014. The global precipitation measurement mission. Bulletin of the American Meteorological Society, 95 (5), 701–722. doi:10.1175/BAMS-D-13-00164.1
- Hrachowitz, M., et al., 2013. A decade of predictions in ungauged basins (PUB) – a review. Hydrological Sciences Journal, 58 (6), 1198–1255. doi:10.1080/02626667.2013.803183
- Hut, R.W., 2013. New observational tools and datasources for hydrology: Hydrological data unlocked by tinkering. Thesis (PhD). TU Delft. Delft, The Netherlands.
- Hut, R.W., Weijs, S.V., and Luxemburg, W.M.J., 2010. Using the Wiimote as a sensor in water research. Water Resources Research, 46 (12), W12601. doi:10.1029/2010WR009350
- Hwang, T., et al., 2008. Evaluating drought effect on MODIS Gross Primary Production (GPP) with an eco-hydrological model in the mountainous forest, East Asia. Global Change Biology, 14 (5), 1037–1056. doi:10.1111/j.1365-2486.2008.01556.x
- Immerzeel, W.W. and Droogers, P., 2008. Calibration of a distributed hydrological model based on satellite evapotranspiration. Journal of Hydrology, 349, 411–424. doi:10.1016/j.jhydrol.2007.11.017
- Inagaki, M.N., et al., 2011. Monitoring soil moisture under wheat growth through a wireless sensors network in dry conditions. Journal of Environmental Science and Engineering, 5, 428–431.
- Jin, R., et al., 2014. A nested ecohydrological wireless sensor network for capturing the surface heterogeneity in the midstream areas of the Heihe River basin, China. IEEE Geoscience and Remote Sensing Letters, 11 (11), 2015–2019. doi:10.1109/LGRS.2014.2319085
- Keery, J., et al., 2007. Temporal and spatial variability of groundwater–surface water fluxes: development and application of an analytical method using temperature time series. Journal of Hydrology, 336 (1–2), 1–16. doi:10.1016/j.jhydrol.2006.12.003
- Koblinsky, C.J., et al., 1993. Measurement of river level variations with satellite altimetry. Water Resources Research, 29 (6), 1839–1848. doi:10.1029/93WR00542
- Koch, F.W., et al., 2016. 1DTempPro V2: new features for inferring groundwater/surfacewater exchange. Groundwater, 54 (3), 434–439. doi:10.1111/gwat.12369
- Koster, R.D., et al., 2016. Precipitation estimation using L-band and C-band soil moisture retrievals. Water Resources Research, 52 (9), 7213–7225. doi:10.1002/2016WR019024
- Kouraev, A.V., et al., 2004. Ob’ river discharge from TOPEX/Poseidon satellite altimetry (1992-2002). Remote Sensing of Environment, 93 (1–2), 238–245. doi:10.1016/j.rse.2004.07.007
- Koutsoyiannis, D., 2013. Hydrology and change. Hydrological Sciences Journal, 58 (6), 1177–1197. doi:10.1080/02626667.2013.804626
- Kummerow, C., et al., 1998. The Tropical Rainfall Measuring Mission (TRMM) sensor package. Journal of Atmospheric and Oceanic Technology, 15 (3), 809–817. doi:10.1175/1520-0426(1998)015<0809:TTRMMT>2.0.CO;2
- La Frenierre, J. and Mark, B.G., 2014. A review of methods for estimating the contribution of glacial meltwater to total watershed discharge. Progress in Physical Geography, 38 (2), 173–200. doi:10.1177/0309133313516161
- La Frenierre, J. and Mark, B.G., 2017. Detecting patterns of climate change at Volcán Chimborazo, Ecuador, by integrating instrumental data, public observations, and glacier change analysis. Annals of the American Association of Geographers, 107 (4), 979–997. doi:10.1080/24694452.2016.1270185
- Larson, K.M., et al., 2008. Use of GPS receivers as a soil moisture network for water cycle studies. Geophysical Research Letters, 35 (24), L24405. doi:10.1029/2008GL036013
- Laut, J., et al., 2014. Development of a mechatronics-based citizen science platform for aquatic environmental monitoring. IEEE/ASME Transactions on Mechatronics, 19 (5), 1541–1551. doi:10.1109/TMECH.2013.2287705
- Laut, J., et al., 2017. Increasing citizen science contribution using a virtual peer. Journal of the Association for Information Science and Technology, 68 (3), 583–593. doi:10.1002/asi.23685
- Leaf, A.T., Hart, D.J., and Bahr, J.M., 2012. Active thermal tracer tests for improved hydrostratigraphic characterization. Ground Water, 50 (5), 726–735. doi:10.1111/j.1745-6584.2012.00913.x
- LeBoursicaud, R., et al., 2015. Gauging extreme floods on YouTube: application of LSPIV to home movies for the post-event determination of stream discharges. Hydrological Processes, 30 (1), 90–105.
- LeCoz, J., et al., 2010. Performance of image-based velocimetry LSPIV applied to flash-flood discharge measurements in mediterranean rivers. Journal of Hydrology, 394 (1–2), 42–52. doi:10.1016/j.jhydrol.2010.05.049
- Legleiter, C.J., 2015. Calibrating remotely sensed river bathymetry in the absence of field measurements: flow REsistance Equation-Based Imaging of River Depths (FREEBIRD). Water Resources Research, 51 (4), 2865–2884. doi:10.1002/2014WR016624
- Leijnse, H., Uijlenhoet, R., and Stricker, J.N.M., 2007. Rainfall measurement using radio links from cellular communication networks. Water Resources Research, 43 (3), W03201. doi:10.1029/2006WR005631
- Lettenmaier, D.P., 2017. Observational breakthroughs lead the way to improved hydrological predictions. Water Resources Research, 53 (4), 2591–2597. doi:10.1002/2017WR020896
- Liang, X., et al., 1994. A simple hydrologically based model of land surface water and energy fluxes for general circulation models. Journal of Geophysical Research: Atmospheres, 99 (D7), 14415–14428. doi:10.1029/94JD00483
- Lim, J.S., 1990. Two-dimensional signal and image processing. Englewood Cliffs, NJ: Prentice Hall.
- Liu, Y., Yamaguchi, Y., and Ke, C., 2007. Reducing the discrepancy between ASTER and MODIS land surface temperature products. Sensors, 7, 3043–3057. doi:10.3390/s7123043
- Lobell, D.B., et al., 2015. A scalable satellite-based crop yield mapper. Remote Sensing of Environment, 164, 324–333. doi:10.1016/j.rse.2015.04.021
- Lu, Y., et al., 2016. Estimating surface turbulent heat fluxes from land surface temperature and soil moisture observations using the particle batch smoother. Water Resources Research, 52 (11), 9086–9108. doi:10.1002/2016WR018943
- Ludovisi, R., et al., 2017. Uav-based thermal imaging for high-throughput field phenotyping of black poplar response to drought. Frontiers in Plant Science, 8, 1681. doi:10.3389/fpls.2017.01681
- Lundquist, J.D. and Huggett, B., 2008. Evergreen trees as inexpensive radiation shields for temperature sensors. Water Resources Research, 44 (4), W00D04. doi:10.1029/2008WR006979
- Lundquist, J.D. and Lott, F., 2008. Using inexpensive temperature sensors to monitor the duration and heterogeneity of snow-covered areas. Water Resources Research, 44 (4), W00D16. doi:10.1029/2008WR007035
- Lutz, J.A., Martin, K.A., and Lundquist, J.D., 2012. Using fiber-optic distributed temperature sensing to measure ground surface temperature in thinned and unthinned forests. Northwest Science, 86 (2), 108–121. doi:10.3955/046.086.0203
- Lyzenga, D.R., Malinas, N.P., and Tanis, F.J., 2006. Multispectral bathymetry using a simple physically based algorithm. IEEE Transactions on Geoscience and Remote Sensing, 44 (8), 2251–2259. doi:10.1109/TGRS.2006.872909
- Malenovský, Z., et al., 2012. Sentinels for science: potential of Sentinel-1, −2, and −3 missions for scientific observations of ocean, cryosphere, and land. Remote Sensing of Environment, 120, 91–101. doi:10.1016/j.rse.2011.09.026
- Maltese, A., et al., 2013. Critical analysis of thermal inertia approaches for surface soil water content retrieval. Hydrological Sciences Journal, 58 (5), 1144–1161. doi:10.1080/02626667.2013.802322
- Maltese, A., et al., 2015. Soil water content assessment: critical issues concerning the operational application of the triangle method. Sensors, 15 (3), 6699–6718. doi:10.3390/s150306699
- Manfreda, S., et al., 2014. A physically based approach for the estimation of root-zone soil moisture from surface measurements. Hydrology and Earth System Sciences, 18 (3), 11991212. doi:10.5194/hess-18-1199-2014
- Manfreda, S., Caylor, K.K., and Good, S.P., 2017. An ecohydrological framework to explain shifts in vegetation organization across climatological gradients. Ecohydrology, 10 (3), 1–14. doi:10.1002/eco.v10.3
- Mankoff, K.D. and Russo, T.A., 2013. The kinect: a low-cost, high-resolution, short-range 3D camera. Earth Surface Processes and Landforms, 38 (9), 926–936. doi:10.1002/esp.v38.9
- Mansanarez, V., et al., 2016. Bayesian analysis of stage-fall-discharge rating curves and their uncertainties. Water Resources Research, 52 (9), 7424–7443. doi:10.1002/2016WR018916
- Massari, C., Crow, W., and Brocca, L., 2017. An assessment of the accuracy of global rainfall estimates without ground-based observations. Hydrology and Earth System Sciences Discussions, 2017, 1–24. doi:10.5194/hess-2017-163
- McIntyre, M.L., et al., 2006. Coastal bathymetry from hyperspectral remote sensing data: comparisons with high resolution multibeam bathymetry. Marine Geophysical Researches, 27, 129. doi:10.1007/s11001-005-0266-y
- McMillan, H., et al., 2016. Panta Rhei 2013–2015: global perspectives on hydrology, society and change. Hydrological Sciences Journal, 61 (7), 1174–1191.
- Melton, F.S., et al., 2012. Satellite irrigation management support with the terrestrial observation and prediction system: a framework for integration of satellite and surface observations to support improvements in agricultural water resource management. IEEE Journal of Selected Topics in Applied Earth Observations and Remote Sensing, 5 (6), 1709–1721. doi:10.1109/JSTARS.2012.2214474
- Mersel, M.K., et al., 2013. Estimation of river depth from remotely sensed hydraulic relationships. Water Resources Research, 49 (6), 3165–3179. doi:10.1002/wrcr.20176
- Messer, H., Zinevich, A., and Alpert, P., 2006. Environmental monitoring by wireless communication networks. Science, 312 (5774), 713–713. doi:10.1126/science.1120034
- Michailovsky, C.I., et al., 2012. River monitoring from satellite radar altimetry in the Zambezi River basin. Hydrology and Earth System Sciences, 16 (7), 2181–2192. doi:10.5194/hess-16-2181-2012
- Michelsen, N., et al., 2016. Youtube as a crowd-generated water level archive. Science of the Total Environment, 568, 189–195. doi:10.1016/j.scitotenv.2016.05.211
- Mishra, A.K. and Coulibaly, P., 2009. Developments in hydrometric network design: A review. Reviews of Geophysics, 47 (2). doi:10.1029/2007RG000243
- Montanari, A., et al., 2013. Panta Rhei – everything flows: change in hydrology and society – the IAHS scientific decade 2013-2022. Hydrological Sciences Journal, 58 (6), 1256–1275. doi:10.1080/02626667.2013.809088
- Moradkhani, H., 2008. Hydrologic remote sensing and land surface data assimilation. Sensors, 8 (5), 2986–3004. doi:10.3390/s8052986
- Moramarco, T., et al., 2013. An entropy-based method for determining the flow depth distribution in natural channels. Journal of Hydrology, 497, 176–188. doi:10.1016/j.jhydrol.2013.06.002
- Moramarco, T., Barbetta, S., and Tarpanelli, A., 2017. From surface flow velocity measurements to discharge assessment by the entropy theory. Water, 9 (2), 120. doi:10.3390/w9020120
- Muste, M., Fujita, I., and Hauet, A., 2008. Large-scale particle image velocimetry for measurements in riverine environments. Water Resources Research, 44 (4), W00D19. doi:10.1029/2008WR006950
- Mwakanyamale, K., et al., 2012. Spatially variable stage-driven groundwater-surface water interaction inferred from time-frequency analysis of distributed temperature sensing data. Geophysical Research Letters, 39 (6), L06401. doi:10.1029/2011GL050824
- Neal, J., Schumann, G., and Bates, P., 2012. A subgrid channel model for simulating river hydraulics and floodplain inundation over large and data sparse areas. Water Resources Research, 48 (11), W11506. doi:10.1029/2012WR012514
- Negrel, J., Kosuth, P., and Bercher, N., 2011. Estimating river discharge from earth observation measurements of river surface hydraulic variables. Hydrology and Earth System Sciences, 15 (6), 2049–2058. doi:10.5194/hess-15-2049-2011
- Neilson, B.T., et al., 2010. Solar radiative heating of fiber-optic cables used to monitor temperatures in water. Water Resources Research, 46 (8), W08540. doi:10.1029/2009WR008354
- Ng, G.H.C., et al., 2009. Using data assimilation to identify diffuse recharge mechanisms from chemical and physical data in the unsaturated zone. Water Resources Research, 45 (9), W09409. doi:10.1029/2009WR007831
- Nihei, Y. and Kimizu, A., 2008. A new monitoring system for river discharge with horizontal acoustic Doppler current profiler measurements and river flow simulation. Water Resources Research, 44 (4), W00D20. doi:10.1029/2008WR006970
- Norman, J.M., Kustas, W.P., and Humes, K.S., 1995. A two-source approach for estimating soil and vegetation energy fluxes in observations of directional radiometric surface temperature. Agricultural and Forest Meteorology, 77 (3–4), 263–293. doi:10.1016/0168-1923(95)02265-Y
- Nov, O., Laut, J., and Porfiri, M., 2016. Using targeted design interventions to encourage extra-role crowdsourcing behavior. Journal of the Association for Information Science and Technology, 67 (2), 483–489. doi:10.1002/asi.2016.67.issue-2
- Overeem, A., et al., 2013b. Crowdsourcing urban air temperatures from smartphone battery temperatures. Geophysical Research Letters, 40 (15), 4081–4085. doi:10.1002/grl.50786
- Overeem, A., Leijnse, H., and Uijlenhoet, R., 2011. Measuring urban rainfall using microwave links from commercial cellular communication networks. Water Resources Research, 47 (12), W12505. doi:10.1029/2010WR010350
- Overeem, A., Leijnse, H., and Uijlenhoet, R., 2013a. Country-wide rainfall maps from cellular communication networks. Proceedings of the National Academy of Sciences of the United States of America, 110 (8), 2741–2745. doi:10.1073/pnas.1217961110
- Overeem, A., Leijnse, H., and Uijlenhoet, R., 2016a. Retrieval algorithm for rainfall mapping from microwave links in a cellular communication network. Atmospheric Measurement Techniques, 9 (5), 2425–2444. doi:10.5194/amt-9-2425-2016
- Overeem, A., Leijnse, H., and Uijlenhoet, R., 2016b. Two and a half years of country-wide rainfall maps using radio links from commercial cellular telecommunication networks. Water Resources Research, 52 (10), 8039–8065. doi:10.1002/2016WR019412
- Paloscia, S., et al., 2013. Soil moisture mapping using Sentinel-1 images: algorithm and preliminary validation. Remote Sensing of Environment, 134, 234–248. doi:10.1016/j.rse.2013.02.027
- Pereira-Cardenal, S.J., et al., 2011. Real-time remote sensing driven river basin modeling using radar altimetry. Hydrology and Earth System Sciences, 15 (1), 241–254. doi:10.5194/hess-15-241-2011
- Perks, M.T., Russell, A.J., and Large, A.R.G., 2016. Technical note: advances in flash flood monitoring using unmanned aerial vehicles (UAVs). Hydrology and Earth System Sciences, 20 (10), 4005–4015. doi:10.5194/hess-20-4005-2016
- Perumal, M., et al., 2007. A methodology for discharge estimation and rating curve development at ungauged river sites. Water Resources Research, 43 (2), W02412. doi:10.1029/2005WR004609
- Petrides, A.C., et al., 2011. Shade estimation over streams using distributed temperature sensing. Water Resources Research, 47 (7), W07601. doi:10.1029/2010WR009482
- Qu, Y., et al., 2014. Crop leaf area index observations with a wireless sensor network and its potential for validating remote sensing products. IEEE Journal of Selected Topics in Applied Earth Observations and Remote Sensing, 7 (2), 431–444. doi:10.1109/JSTARS.2013.2289931
- Rabiei, E., et al., 2013. Rainfall estimation using moving cars as rain gauges – laboratory experiments. Hydrology and Earth System Sciences, 17 (11), 4701–4712. doi:10.5194/hess-17-4701-2013
- Rabiei, E., et al., 2016. Areal rainfall estimation using moving cars – computer experiments including hydrological modeling. Hydrology and Earth System Sciences, 20 (9), 3907–3922. doi:10.5194/hess-20-3907-2016
- Rahimi, A.R., et al., 2006. Attenuation calibration of an X-band weather radar using a microwave link. Journal of Atmospheric and Oceanic Technology, 23 (3), 395–405. doi:10.1175/JTECH1855.1
- Rapley, C.G., et al., 1987. An exploratory study of inland water and land altimetry using seasat data: final report. London: University College, Mullard Space Science Laboratory. European Space Agency contract report no.6483/85/NL/BI.
- Ravazzani, G., et al., 2016. From (cyber)space to ground: new technologies for smart farming. Hydrology Research, 48 (2), nh2016112.
- Robinson, D.A., et al., 2008. Soil moisture measurement for ecological and hydrological watershed-scale observatories. A review. Vadose Zone Journal, 7, 358–389.
- Romano, N., 2014. Soil moisture at local scale: measurements and simulations. Journal of Hydrology, 516, 6–20. doi:10.1016/j.jhydrol.2014.01.026
- Rothfuss, Y., Vereecken, H., and Brüggemann, N., 2013. Monitoring water stable isotopic composition in soils using gas-permeable tubing and infrared laser absorption spectroscopy. Water Resources Research, 49 (6), 3747–3755. doi:10.1002/wrcr.20311
- Sayde, C., et al., 2010. Feasibility of soil moisture monitoring with heated fiber optics. Water Resources Research, 46 (6), W06201. doi:10.1029/2009WR007846
- Sayde, C., et al., 2015. High-resolution wind speed measurements using actively heated fiber optics. Geophysical Research Letters, 42 (22), 10064–10073. doi:10.1002/2015GL066729
- Schilling, W., 1991. Rainfall data for urban hydrology: what do we need? Atmospheric Research, 27 (1), 5–21. doi:10.1016/0169-8095(91)90003-F
- Schneider, R., et al., 2017. Application of CryoSat-2 altimetry data for river analysis and modelling. Hydrology and Earth System Sciences, 21 (2), 751–764. doi:10.5194/hess-21-751-2017
- Schumann, G.J.P. and Domeneghetti, A., 2016. Exploiting the proliferation of current and future satellite observations of rivers. Hydrological Processes, 30 (16), 2891–2896. doi:10.1002/hyp.10825
- Selker, J.S., et al., 2006a. Distributed fiber-optic temperature sensing for hydrologic systems. Water Resources Research, 42 (12), W12202. doi:10.1029/2006WR005326
- Selker, J.S., et al., 2006b. Fiber optics opens window on stream dynamics. Geophysical Research Letters, 33 (24), L24401. doi:10.1029/2006GL027979
- Selker, J.S. and Ferre, T.P.A., 2009. The ah ha moment of measurement: introduction to the special section on hydrologic measurement methods. Water Resources Research, 45, 4. doi:10.1029/2009WR007966
- Seneviratne, S.I., et al., 2010. Investigating soil moisture-climate interactions in a changing climate: A review. Earth-Science Reviews, 99 (3–4), 125–161. doi:10.1016/j.earscirev.2010.02.004
- Shannon, C.E., 1948. A mathematical theory of communication. The Bell System Technical Journal, 27, 379–423. doi:10.1002/bltj.1948.27.issue-3
- Sidle, R.C., 2006. Field observations and process understanding in hydrology: essential components in scaling. Hydrological Processes, 20 (6), 1439–1445. doi:10.1002/(ISSN)1099-1085
- Slater, L.D., et al., 2010. Use of electrical imaging and distributed temperature sensing methods to characterize surface water – groundwater exchange regulating uranium transport at the Hanford 300 Area, Washington. Water Resources Research, 46 (10), W10533. doi:10.1029/2010WR009110
- Smith, L.C., 1997. Satellite remote sensing of river inundation area, stage, and discharge: a review. Hydrological Processes, 11 (10), 1427–1439. doi:10.1002/(ISSN)1099-1085
- Smith, L.C., 2002. Emerging applications of Interferometric Synthetic Aperture Radar (InSAR) in geomorphology and hydrology. Annals of the Association of American Geographers, 92 (3), 385–398. doi:10.1111/1467-8306.00295
- Sobrino, J. and El Kharraz, M.H., 1999. Combing afternoon and morning NOAA satellites for thermal inertia estimation: 2. Methodology and application. Journal of Geophysical Research, 104 (D8), 9455–9465. doi:10.1029/1998JD200108
- Steele-Dunne, S.C., et al., 2010. Feasibility of soil moisture estimation using passive distributed temperature sensing. Water Resources Research, 46 (3), W03534. doi:10.1029/2009WR008272
- Stern, A.A., et al., 2013. Intrusion of warm surface water beneath the McMurdo Ice Shelf, Antarctica. Journal of Geophysical Research: Oceans, 118 (12), 7036–7048.
- Stewart, R.D., et al., 2012. A resonating rainfall and evaporation recorder. Water Resources Research, 48, 8. doi:10.1029/2011WR011529
- Striegl, A.M. and Loheide, I.I., 2012. Heated distributed temperature sensing for field scale soil moisture monitoring. Ground Water, 50 (3), 340–347. doi:10.1111/j.1745-6584.2012.00928.x
- Su, Z., 2002. The Surface Energy Balance System (SEBS) for estimation of turbulent heat fluxes. Hydrology and Earth System Sciences, 6 (1), 85–100. doi:10.5194/hess-6-85-2002
- Suárez, F., et al., 2011. Assessment of a vertical high-resolution distributed-temperature sensing system in a shallow thermohaline environment. Hydrology and Earth System Sciences, 15 (3), 1081–1093. doi:10.5194/hess-15-1081-2011
- Sulistioadi, Y.B., et al., 2015. Satellite radar altimetry for monitoring small rivers and lakes in Indonesia. Hydrology and Earth System Sciences, 19 (1), 341–359. doi:10.5194/hess-19-341-2015
- Tarpanelli, A., et al., 2013a. River discharge estimation by using altimetry data and simplified flood routing modeling. Remote Sensing, 5 (9), 4145–4162. doi:10.3390/rs5094145
- Tarpanelli, A., et al., 2013b. Toward the estimation of river discharge variations using MODIS data in ungauged basins. Remote Sensing of Environment, 136, 47–55. doi:10.1016/j.rse.2013.04.010
- Tarpanelli, A., et al., 2015. Coupling MODIS and radar altimetry data for discharge estimation in poorly gauged river basins. IEEE Journal of Selected Topics in Applied Earth Observations and Remote Sensing, 8 (1), 141–148. doi:10.1109/JSTARS.2014.2320582
- Tarpanelli, A., et al., 2017. Discharge estimation and forecasting by MODIS and altimetry data in Niger-Benue River. Remote Sensing of Environment, 195, 96–106. doi:10.1016/j.rse.2017.04.015
- Tauro, F., et al., 2016a. A novel permanent gauge-cam station for surface-flow observations on the Tiber River. Geoscientific Instrumentation Methods and Data Systems, 5 (1), 241–251. doi:10.5194/gi-5-241-2016
- Tauro, F. and Grimaldi, S., 2017. Ice dices for monitoring stream surface velocity. Journal of Hydro-Environment Research, 14, 143–149. doi:10.1016/j.jher.2016.09.001
- Tauro, F., Porfiri, M., and Grimaldi, S., 2014. Orienting the camera and firing lasers to enhance large scale particle image velocimetry for streamflow monitoring. Water Resources Research, 50 (9), 7470–7483. doi:10.1002/2014WR015952
- Tauro, F., Porfiri, M., and Grimaldi, S., 2016b. Surface flow measurements from drones. Journal of Hydrology, 540, 240–245. doi:10.1016/j.jhydrol.2016.06.012
- Tetzlaff, D., et al., 2017. The essential value of long-term experimental data for hydrology and water management. Water Resources Research, 53 (4), 2598–2604. doi:10.1002/2017WR020838
- Tourian, M.J., et al., 2016. Spatiotemporal densification of river water level time series by multimission satellite altimetry. Water Resources Research, 52 (2), 1140–1159. doi:10.1002/2015WR017654
- Tourian, M.J., Schwatke, C., and Sneeuw, N., 2017. River discharge estimation at daily resolution from satellite altimetry over an entire river basin. Journal of Hydrology, 546, 230–247. doi:10.1016/j.jhydrol.2017.01.009
- Tourian, M.J., Sneeuw, N., and Bárdossy, A., 2013. A quantile function approach to discharge estimation from satellite altimetry (ENVISAT). Water Resources Research, 49 (7), 4174–4186. doi:10.1002/wrcr.20348
- Tramblay, Y., et al., 2010. Assessment of initial soil moisture conditions for event-based rainfall-runoff modelling. Journal of Hydrology, 387 (3–4), 176–187. doi:10.1016/j.jhydrol.2010.04.006
- Tripathi, G.N., 2013. Spatio-temporal variability in groundwater discharge and contaminant fluxes along a channelized stream in western Kentucky. Thesis (PhD). University of Kentucky.
- Tucker, C.J., et al., 1981. Remote sensing of total dry-matter accumulation in winter wheat. Remote Sensing of Environment, 11, 171–189. doi:10.1016/0034-4257(81)90018-3
- Turnipseed, D.P. and Sauer, V.B., 2010. U.S. Geological survey techniques and methods. Vol. A8. USGS, Ch. Discharge Measurements at Gaging Stations, 87. USGS.
- UN, 2015. Resolution 70/1 transforming our world: the 2030 agenda for sustainable development. New York, NY: United Nations General Assembly.
- UN WATER, 2013. Water security & the global water agenda. UNU-INWEH ed. New York, NY: Hamilton.
- Upton, G., et al., 2005. Microwave links: the future for urban rainfall measurement? Atmospheric Research, 77 (1–4), 300–312. doi:10.1016/j.atmosres.2004.10.009
- Valente, A., et al., 2006. Multi-functional probe for small-scale simultaneous measurements of soil thermal properties, water content, and electrical conductivity. Sensors and Actuators A: Physical, 132 (1), 70–77. doi:10.1016/j.sna.2006.05.010
- van de Giesen, N., Hut, R., and Selker, J., 2014. The Trans-African Hydro-Meteorological Observatory (TAHMO). Wiley Interdisciplinary Reviews: Water, 1 (4), 341–348.
- Van Dijk, A.I.J.M., et al., 2016. River gauging at global scale using optical and passive microwave remote sensing. Water Resources Research, 52 (8), 6404–6418. doi:10.1002/2015WR018545
- van het Schip, T.I., et al., 2017. Rainfall measurement using cell phone inks: classification of wet and dry periods using geostationary satellites. Hydrological Sciences Journal, 62 (9), 1343–1353. doi:10.1080/02626667.2017.1329588
- Vidon, P.G., 2015. Field hydrologists needed: a call for young hydrologists to (re)-focus on field studies. Hydrological Processes, 29 (26), 5478–5480. doi:10.1002/hyp.10614
- Vogt, T., et al., 2010. Estimation of seepage rates in a losing stream by means of fiber-optic high-resolution vertical temperature profiling. Journal of Hydrology, 380 (1–2), 154–164. doi:10.1016/j.jhydrol.2009.10.033
- Volkmann, T.H.M. and Weiler, M., 2014. Continual in situ monitoring of pore water stable isotopes in the subsurface. Hydrology and Earth System Sciences, 18 (5), 1819–1833. doi:10.5194/hess-18-1819-2014
- Vörösmarty, C.J., et al., 2010. Global threats to human water security and river biodiversity. Nature, 467 (7315), 555–561. doi:10.1038/nature09440
- Voytek, E.B., et al., 2014. 1DTempPro: analyzing temperature profiles for groundwater/surface-water exchange. Groundwater, 52 (2), 298–302. doi:10.1111/gwat.12051
- Wagner, W., Lemoine, G., and Rott, H.A., 1999. A method for estimating soil moisture from ERS scatterometer and soil data. Remote Sensing of Environment, 70 (2), 191–207. doi:10.1016/S0034-4257(99)00036-X
- Welber, M., et al., 2016. Field assessment of noncontact stream gauging using portable surface velocity radars (SVR). Water Resources Research, 52 (2), 1108–1126. doi:10.1002/2015WR017906
- Westaway, R.M., Lane, S.N., and Hicks, D.M., 2003. Remote survey of large-scale braided, gravel-bed rivers using digital photogrammetry and image analysis. International Journal of Remote Sensing, 24 (4), 795–815. doi:10.1080/01431160110113070
- White, T., et al., 2015. Principles and dynamics of the critical zone. Amsterdam, Netherlands: Elsevier, Ch. 2. The Role of Critical Zone Observatories in Critical Zone Science, 15–78.
- Wickert, A.D., 2014. The ALog: inexpensive, open-source, automated data collection in the field. The Bulletin of the Ecological Society of America, 95 (2), 166–176. doi:10.1890/0012-9623-95.2.68
- Wiekenkamp, I., et al., 2016. Spatial and temporal occurrence of preferential flow in a forested headwater catchment. Journal of Hydrology, 534, 139–149. doi:10.1016/j.jhydrol.2015.12.050
- WMO (World Meteorological Organization), 2015. WHYCOS guidelines. Geneva, Switzerland: World Meteorological Organization, 1155.
- Wolf, A., et al., 2012. A GSM-based surface meteorology network in service of improved African hydrological data assimilation and drought forecasting. In: American Geophysical Union, Fall Meeting 2012, no. H13J-01, San Francisco, CA. Washington, DC: American Geophysical Union.
- Xue, Y. and Cracknell, A.P., 1995. Advanced thermal inertia modelling. International Journal of Remote Sensing, 16, 431–446. doi:10.1080/01431169508954411
- Young, G., et al., 2015. Hydrological sciences and water security: an overview. Proceedings of the International Association of Hydrological Sciences, 366, 1–9. doi:10.5194/piahs-366-1-2015
- Yourd, A., 2017. Using reactive transport modeling to link hydrologic flux and root zone geochemistry at Second Creek, a sulfate enriched wild rice stream in northeastern Minnesota. Minneapolis, MN: University of Minnesota.
- Zarco-Tejada, P.J., González-Dugo, V., and Berni, J.A.J., 2012. Fluorescence, temperature and narrow-band indices acquired from a UAV platform for water stress detection using a micro-hyperspectral imager and a thermal camera. Remote Sensing of Environment, 117, 322–337. doi:10.1016/j.rse.2011.10.007
- Zinevich, A., Messer, H., and Alpert, P., 2009. Frontal rainfall observation by a commercial microwave communication network. Journal of Applied Meteorology and Climatology, 48 (7), 1317–1334. doi:10.1175/2008JAMC2014.1
- Zreda, M., et al., 2012. COSMOS: the COsmic-ray soil moisture observing system. Hydrology and Earth System Sciences, 16, 4079–4099. doi:10.5194/hess-16-4079-2012
- Zribi, M. and Dechambre, M., 2002. A new empirical model to retrieve soil moisture and roughness from C-band radar data. Remote Sensing of Environment, 84, 42–52. doi:10.1016/S0034-4257(02)00069-X