
ABSTRACT
Seasonal signals of stable isotopes in precipitation, combined with measurements of isotope ratios in soil water, can be used for quantitative estimation of groundwater recharge rates. This study investigates the applicability of using the piston flow principle and the peak shift displacement method to estimate actual groundwater recharge rates in a humid Nordic region located in the province of Quebec, Canada. Two different sites with and without vegetation (C1 and C2) in an unconfined aquifer were tested by measuring soil water isotope ratios (18O/16O and 2H/1H) and volumetric pore water content. Core samples were obtained along the vadose zone down to the groundwater table at the two sites (2.45 m for Site C1 and 4.15 m for Site C2). The peak shift method to estimate groundwater recharge rates was shown to be accurate only in certain specific conditions inherent to the soil properties and the topographical situation of the investigated sites. Indeed, at Site C2, recharge from the snowmelt could not be estimated because of heterogeneity in the lower part of the vadose zone. At this same site the later recharge after the snowmelt (in the period from late spring to early autumn) could be estimated accurately because the upper part of the vadose zone was homogeneous. Furthermore, at site C1, runoff/runon phenomena hampered calculations of actual infiltration and thus produced inaccurate results for recharge. These two different site effects (heterogeneity in the first site and runoff/runon in the other site) were identified as being limiting factors in the accurate assessment of actual recharge. This study therefore recommends the use of the peak shift method for (1) humid Nordic regions, (2) homogeneous and thick vadose zones, and (3) areas with few or limited site effects (runoff/runon).
Editor A. Castellarin Associate editor F. de Barros
1 Introduction
Within the water cycle, the ability to predict the fate of meteoric water (rainwater and snow) in the surface and the subsurface system is of crucial interest, especially for assessing recharge. Recharge is a measure of the capability of groundwater resources to replenish themselves, and it is a critical parameter in determining other parameters involved in the water budget, such as plant transpiration and evaporation (or evapotranspiration). In order to ensure the sustainability of groundwater use, it is important to be able to accurately determine the quantity of groundwater that can be withdrawn without decreasing the water level of aquifers. The challenge is to estimate the actual recharge (e.g. Scanlon et al. Citation2002). This calculation is recognized by the scientific community as being a component of the water cycle that is one of the most difficult to quantify in the groundwater system (Bredehoeft Citation2009). Many researchers have addressed the issue; various methodologies have been developed with the aim of estimating groundwater recharge at different scales (de Vries and Simmers Citation2002, Scanlon et al. Citation2002, Delin et al. Citation2007), either local or regional and based on different approaches: water budget (e.g. Huet et al. Citation2016), water table fluctuation (e.g. Healy and Cook Citation2002, Yin et al. Citation2011), chemical tracing (e.g. Scanlon et al. Citation2002, Delin et al. Citation2007), streamflow analysis (e.g. Rutledge Citation2007, Huet et al. Citation2016), analytical mathematical solutions (e.g. Chesnaux Citation2013) and numerical modelling (e.g. Gogolev Citation2002, Scanlon et al. Citation2002). Despite all these advances, estimating actual recharge and other parameters of the water budget remains particularly challenging. This is especially true of evapotranspiration, a portion of runoff that cannot be available for recharge. Due to the uncertainty related to the factors that control recharge and evapotranspiration, and due to their scale dependency, assessing their respective values is a difficult task. To counter these challenges, researchers expect that by combining different approaches and methods, the accuracy of groundwater recharge calculations may be improved.
Isotope studies aiming to estimate water flow, solute transport and groundwater recharge in the unsaturated zone of aquifers have recently increased in popularity (Koeniger et al. Citation2016) due to the increased efficiency of in situ measurements of soil water isotopes and the development of novel instrumental techniques (e.g. Rothfuss et al. Citation2013, Volkmann and Weiler Citation2014, Gaj et al. Citation2016). Indeed, seasonal variations of stable isotopes in precipitation, which are caused by fractionation processes, can be analysed to follow transient soil water displacement during infiltration in the vadose zone of aquifers. The isotopes 18O and 2H are conservative tracers, and are thus ideal for investigating water fluxes and transport in the unsaturated zone (Stumpp et al. Citation2009, Stumpp and Maloszewski Citation2010, Stumpp and Hendry Citation2012, Sprenger et al. Citation2015a). Koeniger et al. (Citation2016) and Sprenger et al. (Citation2015b, Citation2016a) have recently provided excellent overviews of methods applied to the unsaturated zone using stable isotopes. This field has recently evolved thanks to newly available laser-based analytical techniques, which require only small amounts of water for analysis but no extraction of pore water (Wassenaar et al. Citation2008). The peak shift method is of particular interest for assessing recharge (Leibundgut et al. Citation2010). It is based on the study of soil water isotope ratios or other tracers collected during field observations, and makes it possible to determine the transit time of the infiltration of water into the vadose zone. This method first requires sampling of vertical depth profiles of the soil with a (hand) auger at a selected field site. High-resolution subsamples are then taken for water content and pore water isotope analysis, or any other conservative environmental tracer. The water isotope ratios in the depth profiles are an integrative fingerprint of the infiltration history from precipitation, and the volumetric water content profile can be integrated to calculate the quantity of water that has infiltrated during different periods of time. As shown by Koeniger et al. (Citation2016) who compiled and reviewed all the studies that have used water stable isotope ratios in the unsaturated zone of an aquifer to estimate groundwater recharge, most studies have used tritium, but only a few researchers have used water isotope ratios of pore water (δ18O or/and δ2H). Among the studies using water stable isotope ratios, Allison et al. (Citation1994) and Adomako et al. (Citation2010) assessed recharge in semi-arid regions located in Australia and in Ghana, whereas McConville et al. (Citation2001) and Koeniger (Citation2003) assessed recharge in field studies located in humid regions in Ireland and Germany. Still, most studies using water stable isotope methods for assessing recharge were conducted in arid regions, or using tritium. In more humid climates, if recharge is high, one problem is that deep cores are required to trace the seasonal signal, particularly in sandy soils with low water content. Furthermore, the highest recharge is often associated with snowmelt, and therefore it is important to understand/quantify snowmelt infiltration. To date, studies on snowmelt infiltration using water isotope ratios have been rather qualitative (Stumpp and Hendry Citation2012, Mueller et al. Citation2014) and were not aimed at assessing actual recharge rates.
The present study aims to assess recharge in the context of a humid Nordic region that experiences thick snow coverage during the winter, through the combined use of soil water content and soil water isotope depth profile measurements in soils. Two different sites in a single sandy aquifer located in the province of Quebec, Canada, were selected for the field study. Site C1 presents a 2-m-thick vadose zone and Site C2 presents a 4-m-thick vadose zone. Two different periods of infiltration are considered: (1) the early spring snowmelt period (lasting approximately two months) is observed at Site C2 where recharge by snowmelt can be calculated; (2) the spring/summer period, during which recharge is calculated at the two different sites and can be compared.
The main contributions of this study can be summarized as follows:
New field observations are provided concerning deep unsaturated zone water isotope profiles for determining recharge in a particular climate, driven by snowmelt recharge in the spring and humid climate in the summer.
A modified formulation of the peak displacement method is proposed, adjusted to take into account the residual water content that is observed in the soil water profiles.
Instead of one representative profile, multiple soil cores are sampled, and two different conditions are observed (site-specific conditions).
Water isotope ratios and water contents are interpreted, water fluxes in the vadose zone are characterized, and hydraulic properties of the soil are integrated into the analysis, all in order to improve our understanding of the hydraulic dynamics of infiltration. Indeed, measuring soil properties makes it possible to assess the effects of heterogeneity on the accuracy of the proposed method.
Finally, the challenges are discussed of using stable isotope depth profiles for recharge estimation in humid regions dominated by snowmelt as the main component of groundwater recharge.
2 Material and methods
2.1 Study area and climate data
The unconfined aquifer of interest for this study is located in the Saguenay–Lac-St-Jean region in the province of Quebec, Canada. The aquifer of St-Honoré is formed by a deltaic deposit that consists of fine sand with silt (Boumaiza et al. Citation2015). The mean thickness of the aquifer is 15 m and the thickness of the vadose zone varies between 0 and 5 m. Two specific locations were selected within this aquifer. Site C1 (48°29ʹ47.80″N/71°02ʹ37.40″W) is covered in sand and is bare of vegetation; the water table is found at approximately 2 m below ground surface (b.g.s.). Site C1 is located at the bottom of a hill and infiltration at this site may originate not only from direct precipitation but may also be influenced by runoff/runon processes. This observation is important because recharge at this site may be overestimated by such a topographical site effect. Site C2 (48°29ʹ54.98″N/71°02ʹ49.78″W) is at a distance of 340 m from C1 and is located in a treed area composed of 20-year-old poplars. The water table depth at C2 is 4 m b.g.s. No organic soil is found at Sites C1 and C2; the fine sand and silty aquifer is directly exposed at the surface.
Eastern Quebec has a humid climate with short, hot and humid summers, cold and snowy winters, and rainy springs and autumns. Average monthly temperatures range from −16°C in January to +18°C in July. The aquifer of St-Honoré captures a uniformly distributed mean annual precipitation of 930 mm (standard deviation of 21 mm), with a mean annual snow accumulation equivalent to 320 mm of water, recorded at the Environment Canada station 7060400 in Bagotville (Environment Canada Citation2011). From October to March, most of the precipitation is in the form of snowfall and consequently, during half of the year, the recharge of unconfined aquifers is minimal. Most of the recharge occurs in the spring during snowmelt, as 6 months of accumulated snowfall suddenly become available for infiltration. On average, the snowmelt period occurs from 1 April to 31 May; this will be considered as the snowmelt period in the framework of this study.
For the requirements of this study, daily climate data, consisting of minimum and maximum temperatures, rainwater precipitation and snowfall, have all been obtained at the Falardeau station (MDDELCC, 2016), which is located 10 km from the aquifer of St-Honoré.
2.2 Sampling and analysis
2.2.1 Core sampling
On 16 October 2016, continuous sediment cores using a hand auger were collected at C1 and C2. Using a split-spoon sampler, soil samples were collected every 10 cm in order to obtain a high resolution of soil profiles. Site C1 was drilled to a depth of 245 cm b.g.s. (the water table was found at 235 cm b.g.s.), whereas Site C2 was drilled to a depth of 415 cm b.g.s. (the water table was found at 405 cm b.g.s.). In the two cases, a 20-cm-high capillary fringe was observed. After visual observation, the cores were immediately cut into 10-cm-long subsamples and tightly sealed in polyethylene bags (representing a mean bulk soil mass of approximately 150 g) to prevent moisture loss due to evaporation, which would alter the isotopic composition of the stored water as well as the volumetric water content of the bulk subsamples. A total of 24 soil samples were collected in Site C1 and a total of 41 soils samples were collected in Site C2.
2.2.2 Stable isotopes of water
The C1 and C2 samples were sent to the soil laboratory of the Helmholtz Zentrum München in Germany to be analysed for isotopes and sediment properties. The soil water was extracted by the cryogenic method for the analysis of stable water isotope ratios. Here, 13 ± 2 g of wet soil was used per sample (depending on expected water content). Water was extracted at 105°C and the extraction was completed after 105–120 minutes. The isotope ratios of the extracted water were determined by cavity ring-down spectroscopy (Picarro L-2120i). Both 18O/16O and 2H/1H ratios were determined relative to the V-SMOW (Vienna-Standard Mean Ocean Water). The ratio of isotopes (Rsample) is given in the delta notation as δ-value [‰], which represents the relative deviation of the sample from a standard (Rstandard) as given in Equation (1):
Positive δ-ratios indicate an increase of the heavier isotope relative to the standard, whereas negative ratios indicate a decrease.
Data for rainwater isotope ratios are available on a monthly basis from January to October 2011 at Station CMP located 20 km away from the study site. Based on the δ2H–δ18O relationships, the local meteoric water line (LMWL) was calculated. It should be noted that, unfortunately, rainwater isotope data are not available for the year of interest (2016) of the study, but it is assumed that the overall water isotope composition in precipitation in 2011 is representative of any contemporary year period. For this study, the absolute input information of water isotope ratios in precipitation is less important and only the seasonality is considered. Seasonal characteristics have not changed significantly over the years (monthly values were compared against long-term (1997–2010) monthly means from water isotope ratios in precipitation), as evidenced by available data for the town of Chapais (49°49ʹ12″N/74°58ʹ12″W). Chapais is located approximately 350 km northwest of the study site and is the closest station of the Global Network of Isotopes in Precipitation (GNIP). Water isotope data are available online through the database of the International Atomic Energy Agency (http://wwwnaweb.iaea.org/napc/ih/IHS_resources_isohis.html#wiser; accessed 24 November 2016).
2.2.3 Analyses of sediment properties
Gravimetric water contents of all subsamples of Sites C1 and C2 were determined by drying each soil sample in an oven at a temperature of 120°C for 36 h. Bulk dry density was determined gravimetrically by filling 100-cm3 cylinders with sediment subsamples. Porosity and volumetric water content were calculated from gravimetric water content and bulk dry density data, assuming a particle density of 2.69 g/cm3 for sand; lower bulk densities are not expected due to the absence of organic matter. Grain-size sieve analysis was performed on different groups of soil subsamples. These groups were chosen depending on visual observation of the characteristics of the soil sampled at different depths (colour and sediment structure). Several subsamples were grouped to represent the grain-size conditions for a range of depths. Representative grain-size curves of each vadose zone at C1 and C2 were further used to predict the saturated hydraulic conductivities of the different soils represented by their characteristic grain-size curves.
In this study, six empirical methods were selected to determine the saturated hydraulic conductivity K: Hazen (Citation1892), Beyer (Citation1964), NAVFAC DM7 (Citation1974), Chapuis (Citation2004), Sauerbrei (Vukovic and Soro Citation1992) and USBR (Vukovic and Soro Citation1992). summarizes the different empirical formulas as well as the conditions of application associated with each. Depending on the conditions, some methods may not be applicable for a sample and, therefore, only results obtained when the method is applicable are considered. Ultimately, for a single sample, a single average K value is obtained from the different K values, after ensuring that there is minimal variability (large variability being suspect) between the K values calculated from the different applicable methods. Unsaturated properties of the material are then estimated in two steps for C1 and C2 based on a pedotransfer function and using the Van Genuchten (Citation1980) model: (1) determining the water retention curves as a function of pressure from both the grain size distribution and the volumetric water content at saturation (porosity); and (2) using the water retention curves and the estimated saturated hydraulic conductivities to predict the hydraulic conductivity curves as a function of pressure. Such predictions of the hydraulic conductivity profiles in C1 and C2 make it possible to compare the hydraulic properties of the two vadose zones, and therefore to compare and decipher the dynamics of infiltration at the two locations. Note also that the water retention curves provide the residual volumetric water content value, which is used in the calculation of recharge, as explained in the next section.
Table 1. Validated empirical methods used to predict the hydraulic conductivity with the specific conditions of application. Note that Dα is the effective grain diameter (mm), where α is the cumulative weight percentage of smaller grain size. Cu: uniformity coefficient (= D60/D10); e: void ratio, n: porosity.
2.3 Calculation of recharge
The calculation of recharge requires the calculation of the pore water volume that is displaced over a certain time by infiltration in the vadose zone. The challenge is to calculate the amount of mobile water in the soil profile and to trace specific infiltration events whose signatures equate with distinct isotope compositions, by taking advantage of the seasonal distribution of water isotope ratios in precipitation, knowing that this distribution is also reflected in the soil water. In this study, the actual snowmelt and subsequent precipitation events in the infiltration front were traced. The method is generally based on the piston flow concept. This method makes it possible to calculate the mean water flux in the vadose zone. It was expected that two types of infiltration would be observed that could be distinguished from each other based on the water isotope ratios: (1) the late spring infiltration that combines both snowmelt and precipitation and (2) the summer to early autumn precipitation (recharge can only be calculated for periods that occur before the sampling, i.e. before 16 October 2016 in the case of this study). These two different periods were chosen because during snowmelt, recharge was expected to be higher and unaffected by (evapo)transpiration compared to the summer–autumn period. Further, sampling in October at the end of the vegetation period gives time-integrated information about recharge throughout these time periods, and can therefore be considered as representative of actual recharge rather than potential recharge rates. The recharge attributed to these two different periods can be calculated from the knowledge of the volumetric water content in the soil and an assumption of piston flow of the infiltrated water (Saxena and Dressie Citation1984, Leibundgut et al. Citation2010). In this study, the piston flow concept has been modified to yield Equation (2), which considers immobile water that is represented by the residual portion of water and that is not contributing to groundwater recharge. Equation (2) calculates recharge RT [L.T−1] during the time period T [T]. The recharge is related to the difference between the measured volumetric water content and the residual water content over a certain distance of infiltration:
where T is the time period for which recharge is calculated, zt and zt+T [L] are, respectively, the difference of elevation (soil depth in the unsaturated zone) of the front of water that has infiltrated between time t and time t + T during the total period of T; θ(z) and θr are the volumetric and residual water content at elevation (soil depth b.g.s. in the unsaturated zone) z.
Considering that the equation of the profile of the volumetric water content (Vol. WC) in the unsaturated zone (water content that undergoes infiltration and that is not at its Vol. WC equilibrium profile) is not known, the curve of the Vol. WC can be integrated over the intervals of soil subsamples that are of length zi+1 – zi. In this case, Equation (2) simplifies as follows:
with m the number of depth intervals that are representative of the infiltration occurring during the period T for which recharge is calculated.
It should be noted that the piston flow method to calculate recharge considers the assumption that the pore water only infiltrates vertically in the vadose zone and that there is “no recharge loss” of infiltrated water along another flow direction (such as a horizontal drainage). Further, this method assumes an advection-dominated process and neglects the dispersion factor which, however, could be accounted for if dispersivities were known (Leibundgut et al. Citation2010, Stumpp et al. Citation2012).
The relevant time periods of recharge T for estimating recharge were identified using information from stable water isotope ratios in the depth profiles, considering that seasonal signals of stable isotopes in precipitation (during T periods), combined with measurements of soil water content, can be used for a quantitative estimation of groundwater recharge rates of each identified T period. We distinguished between two main periods for calculating recharge: (i) snowmelt infiltration, representing the lowest water isotope values in the profile; and (ii) infiltration due to precipitation after snowmelt and before the time of sampling (i.e. mid-October).
Recharge in the aquifer of St-Honoré, as in any aquifer in northern latitudes, mostly occurs during the snowmelt period and the summer/autumn period when rainfall occurs (there is low recharge during winter since infiltration is limited by soil frost during this period). It is expected that the water isotope ratio and volumetric water content profiles (Vol. WC) at sites C1 and C2 will make it possible to reconstruct a period of infiltration that is long enough to allow the calculation of recharge for the two periods (snowmelt and summer–autumn to mid-October). Sites C1 and C2 were sampled in October.
3 Results
3.1 Profiles of water isotopes in soil water
The mean monthly isotope δ18O values of water collected at Station CMP and at Chapais are presented in . This shows the expected seasonal isotope distribution with higher isotope ratios during the summer months and lower isotope ratios during the winter months. At CMP, the values for δ18O range from −28.6‰ in winter to −8.1‰ in summer. This seasonal variation is the consequence of seasonal temperature changes and the origin/history of sources of moisture, and it provides a fingerprint for precipitation entering to the subsurface and infiltrating through the vadose zone.
Figure 1. Mean monthly water isotope ratios in rainwater at Station CMP in comparison to long-term data from the Chapais station of the Global Network of Isotopes in Precipitation (GNIP). Only δ18O values are displayed, but δ2H values follow the same distribution, as shown by the local meteoric water line shown in .
Figure 2. Water isotope ratios in precipitation, with the local meteoric water line (LMWL) and the water isotope ratios in the soil water at sites C1 and C2.
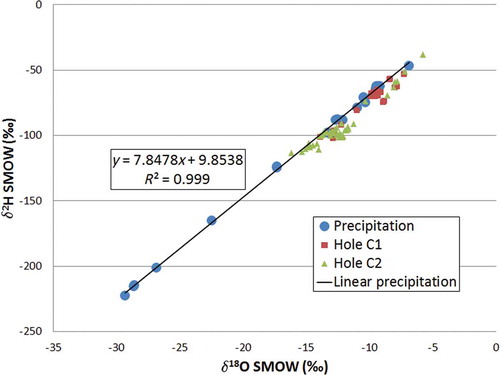
The LMWL and the water isotope ratios of the soil water of sites C1 and C2 are given in . This figure makes it possible to compare the isotope ratios of rainwater and snow water with the isotope ratios of soil water measured in the vadose zones C1 and C2.
The regression for the LMWL gives δ2H = 7.85δ18O + 9.85‰, which is close to the global meteoric water line (GMWL), which is δ2H = 8δ18O + 10‰, or the LMWL in Chapais (δ2H = 7.81δ18O + 9.21‰). The values of pore water samples of the two sites plot below the LMWL (), which indicates non-equilibrium fractionation processes for some samples. The fractionation can result either from snow sublimation and evaporation processes or from isotopic fractionation during cryogenic extraction (Orlowski et al. Citation2013). It is important to note that none of the soil samples had isotope values lower than −17‰ for δ18O. Isotope ratios are more variable (higher range) at Site C2 compared to Site C1. This phenomenon is also apparent when looking at the depth profiles (). Note that the two y-axes in were designed to match the isotope ratios of the two soil profiles and allow the representation of a comparable timing of infiltration. This makes it possible to track differences in infiltration of the same water at the two sites and it also shows that the same water infiltrated into larger depths at Site C1 compared to Site C2. Further, it indicates that recharge is faster at Site C1 and it may even indicate – assuming similar soil hydraulic conditions at the sites – that more water is recharged at Site C1 than at Site C2.
Figure 3. Water isotope profiles of (a) δ2H and (b) δ18O determined at sites C1 and C2. Note that y-axes have different scales and that the water isotope ratio profiles of pore-infiltrated water read chronologically from bottom to top of the vadose zone. Correspondences between isotope-profile-identified behaviours and time periods are noted in the figure.
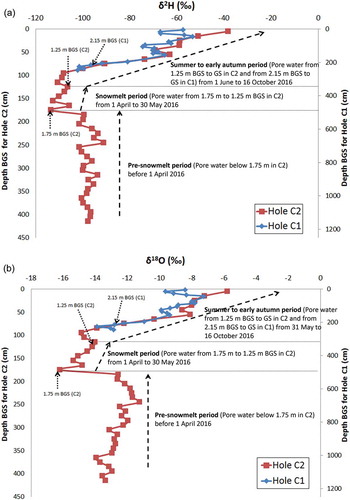
From top of soil (ground surface) to depth, first observed is the water infiltrated during summer/early autumn 2016, since the holes C1 and C2 were both drilled in mid-October 2016. Deeper pore water should then be representative of the 2016 snowmelt, whereas even deeper water should be representative of water infiltrated before the snowmelt period of 2016. Thus, the origin of pore water that has infiltrated into the soil can be back-tracked based on its water isotope composition. The thicker the vadose zone and the slower the rate of infiltration (which depends on soil hydraulic conditions) or the higher the water content, the longer is the observed infiltration time period; this is true when neglecting the factors of dispersion and mixing with lateral flow components. The two water isotope ratio profiles of C1 and C2, either of δ2H or δ18O, have similar distributions when considering two different depth scales (left-hand scale for C2 and right-hand scale for C1 in ). This means that the same precipitation events reached different depths at sites C1 and C2. Indeed, shows that the infiltration in Site C1 is much faster than in Site C2: two infiltrated particles of water having the same origin (same isotope values and same time zero of infiltration) will not take the same time to percolate to the same depth in C1 and in C2. In contrast, similar precipitation events were found at greater depths at site C1 compared to site C2. shows that the mean water flux is 2.78 times greater for C1 than for C2 (the right-hand scale representing C1 is 2.78 times greater than the left-hand scale representing C2). Consequently, the pore water isotope ratio profiles in C1 from the surface to the groundwater table denote a much shorter period of infiltration than in C2, considering the combined effects of a faster infiltration in C1 and a lesser thickness of the vadose zone in C1.
Observing the water isotope ratio profiles in C2, three zones can be identified: (i) the pore water between the ground surface (GS) and 1.25 m b.g.s. is water infiltrated after the snowmelt period (June) to mid-October (summer to early autumn period), with δ2H and δ18O values increasing from −108.1 to −38.3‰ and from −14.87 to −5.79‰, respectively; (ii) the pore water contained between 1.25 and 1.75 m b.g.s. is water infiltrated during the snowmelt period (spring), with δ2H and δ18O values from −113.6 to −108.1‰ and from −16.20 to −14.87‰, respectively; and (iii) the pore water deeper than 1.75 m b.g.s. represents infiltration having occurred before the snowmelt of 2016. It is important to note, however, that the smallest isotope values in the soil profile were still greater compared to the average, unweighted isotope values (−125.1 and −17.23‰ for δ2H and δ18O, respectively) in winter precipitation (October–May).
As mentioned earlier, the vadose zone in C1 being thinner and the infiltration faster than in C2, a shorter time period of infiltration is observed in C1. The water isotope ratio profile in C1 shows that only a limited time period is fingerprinted due to a faster infiltration and a smaller vadose zone: only the water isotope values from early summer to mid-October can be observed at this site.
3.2 Volumetric water content profiles and interpretations
The volumetric water content profiles and the degree of saturation profiles at Site C1 and Site C2 are presented in . These profiles are presented in the same manner as the water isotope ratio profiles in Fig
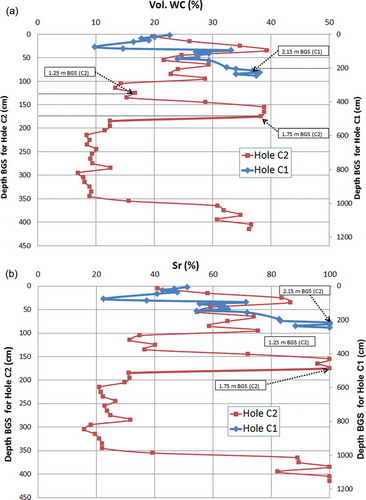
Figure 4. (a) Volumetric water content profiles at sites C1 and C2, and (b) degree of saturation (Sr) profiles at sites C1 and C2. The left-hand scale of depth is for the C2 profile and the right-hand scale is for the C1 profile.
ure 3, using the same two different scales, so that the two profiles in represent a comparable timing of infiltration.
Based on the previous study of the isotope ratio profiles at sites C1 and C2, it is now possible to establish correspondences between the Vol. WC profiles and the different periods of infiltration that were previously identified from the water isotope data. For C2, the pore water from between 0 and 1.25 m b.g.s. corresponds to water infiltrated from the end of the snowmelt to 16 October; in that case, the high variability of water content results from different infiltration events during this time period. The pore water from between 1.25 and 1.75 m b.g.s. corresponds to water infiltrated during the snowmelt, and in this case the highest water contents were observed. Indeed, ) shows that the vadose zone is fully saturated (degree of saturation Sr of 100%) between 1.55 and 1.75 m b.g.s.
At Site C2, at depths greater than 1.75 m b.g.s., it can be observed in ) that the Sr decreases to reach a mean value of approximately 25% (corresponding to a Vol. WC value of 7% in )) at a depth of 3.45 m b.g.s. Finally, from 3.65 to 3.85 m b.g.s., the Sr at C2 ()) increases with depth to reach 100% saturation from 3.85 m b.g.s. Below this depth, the soil at C2 remains fully saturated, indicating that the capillary fringe and then the water table (4.05 m) are reached. This third zone below snowmelt infiltration and above the water table showed no variation in isotopic composition nor water content. In combination with low water contents, this suggests that percolation in this zone is limited and water content above the groundwater level is rather in equilibrium with the groundwater table. These observations further indicate that the saturation zone located between 1.55 and 1.75 m could be acting as a perched aquifer, potentially resulting in a horizontally-draining capillary barrier. Consequently, the pore water at Site C2 that is located below 1.75 m b.g.s. cannot be used for calculating infiltration, since there is no observable infiltration.
At Site C1, water content varied over the entire profile ()) and reached full saturation at 2.15 m b.g.s. ()). These fluctuations in degree of saturation profiles at both C1 and C2 are controlled by the fluctuations of infiltration consequent to variable precipitations during the post-snowmelt period from June to mid-October.
3.3 Calculating the flux of infiltration and climate data observations
The flux of infiltration can now be calculated at Site C2, considering that the isotopic pore water measurements and the Vol. WC measurements have made it possible to identify the different time periods that can be associated with climatic conditions. In the previous section the following chronological conclusions were made: (i) no or low (negligible) infiltration is observed during the period before the snowmelt; (ii) during the 2-month snowmelt period (April/May 2016: 61 days), infiltrated water is contained between 1.25 and 1.75 m b.g.s., which corresponds to a mean rate of infiltration of 0.82 cm/d; and (iii) after the snowmelt, during the summer/early autumn period (June to mid-October: 140 days), infiltrated water is contained between GS and 1.25 m b.g.s., which corresponds to a mean rate of infiltration of 0.89 cm/d. It is interesting to note that overall the rate of infiltration at C2 appears to be slightly higher during the summer/early autumn period than during the snowmelt period.
At Site C1, where snowmelt-infiltrated water is not observed in pore water and where only infiltrated water of a shorter period (compared to C2) of the summer/early autumn is observed, the calculation of the time period that corresponds to infiltration between GS to 2.15 m b.g.s. cannot be directly calculated as in C2. However, since the mean infiltration velocity is 2.78 times higher for C1 than for C2 during the summer/early autumn (results previously obtained from ), the precise duration of the fingerprinted infiltration in the pore water at C1 can be assessed based on the calculated rate of infiltration for the summer/early autumn at C2. Consequently, considering a mean rate of infiltration of 0.89 cm/d for the summer/early autumn period at C2, the mean rate of infiltration at C1 for the same period is of 2.47 cm/d. This indicates that for infiltrated water to travel the 2.15 m thickness of the unsaturated zone at C1, it takes 86 days for precipitation water to infiltrate from the GS to 2.15 m b.g.s. This time lapse is close to 3 months, which indicates that the pore water reaching 2.15 m b.g.s. at site C1 was water infiltrated at the GS at the end of July. To conclude, pore water observed at C1 fingerprints 86 days of history of precipitation for the summer/early autumn period whereas pore water observed at C2 fingerprints 140 days of history of precipitation for the same period.
summarizes the dynamics of the infiltration of water through the vadose zones at C2 and C1, in relation to precipitation data. The figure makes it possible to compare the relationship between the pore water profile and its origin (precipitation and/or snowmelt) as a function of time. Site C2 is first presented in ) and Site C1 is presented in ). The profiles in C2 and C1 are represented using two different scales of depth (right-hand y-axis), with a scale difference of the depth b.g.s. between ) and (b) that corresponds to the same scale difference shown in . In both cases, the precipitation and snowmelt data are represented on the x-axis with the daily amount of precipitation preceding 16 October 2016 when the samples were collected. The climate data are related to the time that is represented on the left-hand y-axis. Note that the total quantity of water was estimated from the total amount of snow that fell over the winter. A conversion was applied considering an equivalent height of snow/height of precipitation of 10. The calculated total equivalent water of snowmelt was then equally distributed over the entire snowmelt period (from 1 April to 31 May). Note that peaks during the snowmelt period represent rain combined with snowmelt.
Figure 5. Volumetric water content profiles and snowmelt and precipitation data at (a) Site C2 and (b) Site C1. The correspondence between the infiltrated water and its origin (time period and age) is indicated on the two volumetric water content profiles.
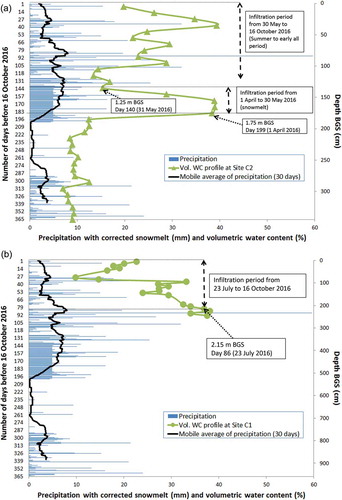
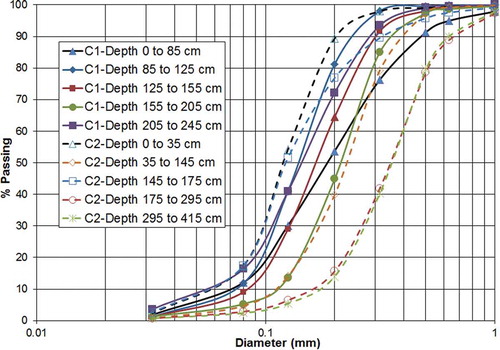
Figure 6. Grain-size sieve analysis results for sites C1 and C2 for the different ranges where the samples were identified to be similar and belonging to the same class of soil.
shows that there is a good agreement in both cases (a) and (b) (respectively for Site C2 and C1) of the volumetric pore water content profile and the precipitation data. Indeed, in ) a good fit is observed between the zone that is saturated (1.25–1.75 m b.g.s.) and the snowmelt period when there is intense infiltration. After the snowmelt period, a good fit is observed between the peaks of rainfall and the peaks of Vol. WC in the profiles for C2 and C1, respectively, in ) and (b). The same is true for the pre-snowmelt period in the case of Site C2, where it can be observed that the portion of the Vol. WC profile that is low (observed below 1.75 m b.g.s.) also corresponds to low precipitation amounts. The fact that the water content stays at about 10% in this lower zone and only partially corresponds to precipitation events can be explained by two possible factors: either (i) the assumption of constant flow velocities in the profile is not met, or (ii) the low-permeable barrier in 1.75 m b.g.s. forces infiltrating water to drain horizontally and prevents water from infiltrating deeper than 1.75 m b.g.s.
In conclusion, the good agreement between the Vol. WC profiles and the origin and timing of infiltration () confirms the conclusions previous obtained from the water isotope ratios and the pore water analyses.
3.4 Hydraulic properties of the sediments
The soil and hydraulic properties of the two vadose zones at sites C1 and C2 were analysed in order to verify and confirm the dynamics of the infiltration as well as the Vol. WC properties that were observed when interpreting water isotope ratios and pore water profiles. presents the results of the grain-size analysis on the core samples at sites C1 and C2 for the different ranges of depths where soil characteristics were observed to be consistent. In both cases at sites C1 and C2, five different ranges were observed and the samples were grouped in each range to conduct the sieve analysis.
shows that the soil is composed of fine sand to silty sand. Based on the grain-size curves, combined with the calculation of soil porosity (based on known data for gravimetric and volumetric water content of the samples), average hydraulic conductivities were calculated for C1 and C2 () using the six empirical methods.
Table 2. Soil properties obtained from grain-size sieve analysis and from soil drying.
shows that the average (harmonic mean) predicted saturated hydraulic conductivity at Site C2 (8.47 × 10⁻³ m/s) is higher than at Site C1 (5.26 × 10⁻³ m/s). and illustrate the heterogeneity of the vadose zone at both sites. Particularly at Site C2, the presence of a less permeable layer can be observed between 1.45 and 1.75 m b.g.s. This confirms the previous observations and conclusions obtained from the Vol. WC profiles (), which indicated a potential horizontal flow at saturated conditions above the 1.25–1.75 m b.g.s. zone. Indeed, this zone presents the lowest hydraulic conductivity at saturation (2.54 × 10⁻³ m/s) at Site C2 and is composed of the finest material (higher presence of silt than the other layers), as observed in .
The Vol. WC and the hydraulic conductivity curves as a function of the matric suction at equilibrium are then predicted at C1 and C2, using the Van Genuchten model based on average conditions in each vadose zone (average predicted saturated hydraulic conductivity). These curves are presented, respectively, in ) and (b).
Figure 7. (a) Predicted Vol. WC curves at equilibrium for sites C1 and C2 and (b) predicted hydraulic conductivity curves at equilibrium for sites C1 and C2.
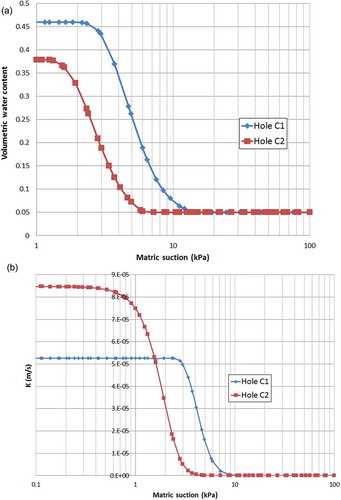
) shows that the vadose zone at Site C1 exhibits higher soil water retention than that at site C2, and with a higher profile of Vol. WC. Indeed, the soil at Site C1 (average conditions) is finer than the soil at Site C2, which explains the lower hydraulic conductivity at saturation in C1 but at the same time a higher capacity of pore water retention in unsaturated conditions. This higher capacity of water retention at C1 translates into a higher hydraulic conductivity of the C1 vadose zone in unsaturated conditions, as shown by the predicted hydraulic conductivity curves as a function of the matric suction in ). This explains that the rate of infiltration is expected to be higher at Site C1 than at Site C2, and this was indeed observed in (infiltration rate at C1 is 2.78 times faster than at C2). It is also interesting to mention that the rate of infiltration at C2, observed to be higher during the summer/early autumn period than during the snowmelt period (respectively 0.89 cm/d vs 0.82 cm/d), can be explained by the fact that the soil had a higher Vol. WC after the snowmelt infiltration, conferring a higher hydraulic conductivity and ultimately a faster infiltration of the summer precipitation following snowmelt infiltration. The other assumption is that the Vol. WC profiles do not cover the entire snowmelt period, due to the presence of the horizontal flow between 1.25 and 1.75 m b.g.s.
Finally, in ), a predicted residual Vol. WC of 5% is observed; this value rather agrees with the value of 7% that was observed in the measured Vol. WC profile at C2 below the low-permeable layer (1.75 m b.g.s.), when the Vol. WC almost reaches residual saturation. The estimated water retention function – a characteristic feature specific to site C2 – also fits the measured water content conditions above the water table, suggesting a drop from saturation to residual water content within 60 cm under equilibrium conditions.
3.5 Recharge calculations
Recharge is calculated from Equation (3) for the different periods identified on the Vol. WC profiles at sites C1 and C2 (). The residual water content value is considered to be constant for both profiles at C1 and C2 and a value of 5% is chosen according to the results obtained in ). The results for recharge at the two sites and for the different periods considered are compiled in . It is important to underline once more that these rates are considered to be actual recharge rates because the estimations were calculated from the time-integrated data information obtained at the end of the vegetation period.
Table 3. Recharge for sites C1 and C2 calculated for different periods.
For Site C1, recharge is calculated from data shown in ) from 23 July to 16 October (86 days) 2016 and a value of 284 mm is obtained. During the same period, total precipitation was 299 mm. These results therefore indicate a recharge level of 95% of precipitation for this period. Such a high level appears feasible, considering the soil texture as well as limited evaporation and the absence of transpiration at this site, such as was observed in lysimeter studies containing similar coarse sediments (Maciejewski et al. Citation2006, Maloszewski et al. Citation2006). Still, this high recharge level could also be explained by the specific location of Site C1 at the bottom of a hill and collecting runoff water from the hill. This was observed in the field during a rainy day, when rainwater was flowing in the form of small creeks down the hill to the flat bottom of the hill, where it ultimately infiltrates in the area of Site C1. So, in the case of Site C1, the relative percentage of recharge in comparison to precipitation cannot be accurately estimated by the proposed method due to what could be qualified as a “site effect”: an effect that implies a bias on the estimation of recharge due to a specific local feature of the investigated site. Nevertheless, the absolute recharge rate may still be calculated.
For Site C2, recharge levels are distinct for the two different periods, i.e. summer/early autumn and snowmelt:
Summer/early autumn: The recharge calculated after the snowmelt period (1 June–16 October 2016) was 239 mm (Equation (2) and )), whereas precipitation during the same period was 571 mm. Thus, 42% of precipitation was recharged at this site. Compared to other studies in nearby regions (Huet et al. Citation2016), this rate of recharge is comparable.
Snowmelt period: The recharge calculated during the two months of snowmelt, April/May, was 120 mm (Equation (2) and )), whereas the water available for infiltration (snowmelt plus rainwater precipitation) during this period was 300 mm. This represents a recharge level of 40%, a value that is comparable to the amount of recharge of 42% observed during the summer/early autumn period for this same site. A much higher infiltration and thus recharge rate during the snowmelt would have been expected considering that transpiration is limited during that period (the growing season not having started yet). However, this low recharge value confirms the assumption of horizontally draining water suggested by observations made regarding soil texture, hydraulic properties and saturation profile for site C2. The zone between 1.25 and 1.75 m b.g.s. is composed of a less permeable material (the vadose zone is heterogeneous), which acts as an “impermeable” barrier to infiltration. Consequently, a certain quantity of water originating from snowmelt and infiltrating at Site C2 is lost in the vertical profile by horizontal drainage (preferential flow) above the low-permeable barrier. This drained water cannot be accounted for as recharge water using the peak shift method. Ultimately, this situation leads to an underestimation of recharge. To conclude, a “site effect” is also observed at Site C2, and in this case it is caused by soil heterogeneity.
4 Discussion
The peak shift method for calculating recharge has produced satisfactory results for the post-snowmelt period. The value of recharge of 42% for site C2 (239 mm) corresponds to what could be expected for the aquifer of St-Honoré composed of fine sand with silt (Boumaiza et al. Citation2015). Values of recharge of 95% for site C1 during summer/autumn (284 mm) are high, but still comparable to recharge rates (80–94%) found for similar sediments (Maciejewski et al. Citation2006, Maloszewski et al. Citation2006). Site effects, such as surface runoff processes due to the location of the site at the foot of a hillslope, suggest the relative recharge values obtained are overestimated.
In the case of a humid Nordic climate dominated by high infiltration rates due to snowmelt, the peak shift method is only recommended when deep homogeneous sedimentary vadose zones are available, especially when sediments present good permeability and homogeneity. Using this method, seasonal characteristics of the isotopes may only be observed when the unsaturated zone is deep. The study of seasonal isotopes in shallow, high permeable soils would require a different approach, such as combining the analysis of isotopes in precipitation over time and sampling several soil cores over time, combined with transient flow and transport modelling (Sprenger et al. Citation2016b).
In the province of Quebec, Canada, the peak shift method is deemed applicable because of the predictable water isotope ratio seasonality in precipitation (snow precipitation vs. summer precipitation). Water isotope ratio input amplitudes are large enough to distinguish between winter (snowfall) and summer (rainfall) precipitation. Thus, measuring water isotope ratios in precipitation on-site and with high temporal resolution is not necessarily required. In these conditions, the peak shift method constitutes a simple approach to be used in remote areas for estimating average recharge rates. In regions with less pronounced differences in the input signal and soils with higher dispersion, the absence of a clear distinction between snowmelt and precipitation can limit the method’s applicability.
In this study, the accuracy of estimated relative recharge rates by means of the peak shift method was limited mainly by local site effects (i.e. heterogeneity and surface runoff/runon). The method has indeed shown itself to yield inaccurate results when the vadose zone is heterogeneous and causing lateral horizontal flow. In such conditions, considering only vertical infiltration leads to an underestimation of actual recharge. At Site C2, the results from the peak shift method indicated a recharge of 120 mm from snowmelt, which is certainly too low considering a potential recharge of 300 mm. Assuming a sublimation/evaporation rate of 25% characteristic for these Nordic regions (Huet et al. Citation2016), the potential quantity of water drained horizontally at Site C2 reached 105 mm.
This study has also revealed a second site effect and thus limiting factor for the accuracy of recharge calculations. Topographical features may lead to erroneous results in estimating relative recharge due to surface runoff/runon processes. Two distinct processes occur in Nordic regions: (i) snowmelt over frozen soil; (ii) surface flow on hillslopes (commonly, visually observed during high precipitation events). When snowmelt occurs while the soil is still partially frozen, the result is patchy infiltration patterns and additional surface runoff (e.g. Hayashi et al. Citation2003). To identify both of these processes, transects for isotope analysis in pore water would be required (Stumpp and Hendry Citation2012, Mueller et al. Citation2014).
In ideal homogeneous conditions absent any site effects, the peak shift method may also make it possible to assess transpiration by comparing two different sites, one with bare soil and one with vegetation. Differences in recharge rates could then be directly attributed to transpiration rates where surface runoff is negligible. More studies targeting specific chosen sites would help to investigate these aspects.
For more complex systems featuring preferential flow or flow through fractures, the peak shift method could be expanded by separately considering flow through the matrix and the preferential flow paths/fractures. However, because preferential flow can be strongly variable and it is difficult to distinguish between both fractions, other methods for quantification of recharge might be more useful, such as artificial tracer tests (Rosenbom et al. Citation2008).
5 Conclusion and recommendations
The results of the presented study illustrate how it is important to combine water isotope data with an analysis of the water balance and soil properties, especially to explain heterogeneity and observe the limitations of the peak shift method in sandy soils in Nordic climates, for estimating groundwater recharge rates. In their recent review on the estimation of groundwater recharge by means of soil water isotope analysis, Koeniger et al. (Citation2016) identified the following “future research opportunities”: (1) conducting further research on preferential flow and questioning the piston flow approach used with the peak shift displacement method for calculating recharge; (2) determining soil hydraulic properties and increasing the accuracy of the method by considering residual pore water; and (3) sampling multiple soil cores instead of only one representative profile.
In addressing these three points, this study has confirmed not only the reliability of the peak shift method for assessing recharge in homogeneous soils, but it has also identified certain specific limitations of this most widely used method for estimating recharge. Although reliable recharge rates were determined for summer/autumn recharge, this study has shown that, when estimating groundwater recharge rates in sandy soils in Nordic climates, the peak shift method presents certain limitations, especially in the presence of topographical irregularities or soil heterogeneities. Local heterogeneities in texture in one of the two study sites caused lateral flow within the unsaturated zone and led to the underestimation of recharge for the snowmelt period.
Future research efforts in the field of recharge estimation could focus on measuring the applicability of the peak shift method in different conditions of environment, climate and local site effects. Furthermore, it remains to be tested whether other types of data relative to the water budget (evaporation/transpiration/sublimation) can be reliably obtained from depth profiles.
Here, core soil sampling sites with specific characteristics need to be chosen considering homogeneous soils, thick vadose zones, vegetation/no vegetation conditions. In addition, water isotope ratios of pore water from transects along hillslopes or when knowing structural heterogeneities in the subsurface (e.g. though geophysical analysis) would be beneficial to understand patchy infiltration or lateral flow in the subsurface. Such an approach would allow better optimization of the information that could be obtained from water isotope ratio/water content soil profiles in order to estimate the parameters of the water budget cycle.
Acknowledgements
This study was conducted in the framework of a strategic research collaboration between Bavaria (Munich) in Germany and Quebec (Chicoutimi) in Canada. David Noël and Petra Seibel are acknowledged for having respectively contributed to the core sampling in Quebec and the isotope measurements in Bavaria that are presented herein. Josée Kaufmann is acknowledged for the editing and the proofreading of the manuscript. The authors also thank the Associate editor, Dr Felipe de Barros, and reviewers Dr Matthys A. Dippenaar and Dr Marcel Gaj for the review of the manuscript. Ms Frances Watkins and Ms Shelley Barry are thanked for a final reading of the text.
Disclosure statement
No potential conflict of interest was reported by the authors.
Additional information
Funding
References
- Adomako, D., et al., 2010. Estimating groundwater recharge from water isotope (δ2H, δ18O) profiles in the Densu River basin, Ghana. Hydrological Sciences Journal, 55 (8), 1405–1416. doi:10.1080/02626667.2010.527847
- Allison, G.B., Gee, G.W., and Tyler, S.W., 1994. Vadose-Zone techniques for Estimating groundwater recharge in arid and semiarid regions. Soil Science Society of America Journal, 58 (1), 6–14. doi:10.2136/sssaj1994.03615995005800010002x
- Beyer, W., 1964. Zur bestimmung der wasserdurchlässigkeit von kiesen und sanden aus der kornverteilungskurve. WWT-Wasserwirtschaft Wassertechnik, 14, 165–168.
- Boumaiza, L., Rouleau, A., and Cousineau, P.A. 2015. Estimation de la conductivité hydraulique et de la porosité des lithofaciès identifiés dans les dépôts granulaires du paléodelta de la rivière Valin dans la région du Saguenay au Québec. In: Proceedings of GeoQuebec 2015, 20–23 September, Quebec City, Canada. Richmond, BC, Canada: The Canadian Geotechnical Society, 9.
- Bredehoeft, J., 2009. It is the discharge. Ground Water, 45 (5), 523. doi:10.1111/gwat.2007.45.issue-5
- Chapuis, R.P., 2004. Predicting the saturated hydraulic conductivity of sand and gravel using effective diameter and void ratio. Canadian Geotechnical Journal, 41, 787–795. doi:10.1139/t04-022
- Chesnaux, R., 2013. Regional recharge assessment in the crystalline bedrock aquifer of the Kenogami uplands, Canada. Hydrological Sciences Journal, 58 (2), 421–436. doi:10.1080/02626667.2012.754100
- de Vries, J.J. and Simmers, I., 2002. Groundwater recharge: an overview of processes and challenges. Hydrogeology Journal, 10 (1), 5–17. doi:10.1007/s10040-001-0171-7
- Delin, G.N., et al., 2007. Comparison of local to regional-scale estimates of ground-water recharge in Minnesota, USA. Journal of Hydrology, 334 (1–2), 231–249. doi:10.1016/j.jhydrol.2006.10.010
- Environment Canada, 2011. Canada’s National Climate Archive. http://www.climate.weatheroffice.ec.gc.ca/climate_normals/ [Accessed 15 November 2016].
- Gaj, M., et al., 2016. In situ unsaturated zone water stable isotope (2H and 18O) measurements in semi-arid environments: a soil water balance. Hydrology and Earth System Sciences, 20, 715–731. doi:10.5194/hess-20-715-2016
- Gogolev, M.I., 2002. Assessing groundwater recharge with two unsaturated zone modeling technologies. Environmental. Geology, 42 (2–3), 248–258. doi:10.1007/s00254-001-0494-7
- Hayashi, M., van der Kamp, G., and Schmidt, R., 2003. Focused infiltration of snowmelt water in partially frozen soil under small depressions. Journal of Hydrology, 270 (3–4), 214–229. doi:10.1016/S0022-1694(02)00287-1
- Hazen, A. 1892. Some physical properties of sand and gravel, with special reference to their use in filtration. 24th annual report. Boston: Massachussetts State Board of Health, Pub. Doc. No. 34, 539–556.
- Healy, R.W. and Cook, P.G., 2002. Using groundwater levels to estimate recharge. Hydrogeology Journal, 10 (1), 91–109. doi:10.1007/s10040-001-0178-0
- Huet, M., et al., 2016. Comparing various approaches for assessing groundwater recharge at a regional scale in the Canadian Shield. Hydrological Sciences Journal, 61 (12), 2267–2283. doi:10.1080/02626667.2015.1106544
- Koeniger, P., 2003. Tracer hydrological investigations on groundwater recharge. Freiburg: Institut für Hydrologie, Freiburger Schriften zur Hydrologie No. 16 (in German).
- Koeniger, P., et al., 2016. Review on soil water isotope-based groundwater recharge estimations. Hydrological Processes, 30 (16), 2817–2834. doi:10.1002/hyp.v30.16
- Leibundgut, L., Maloszewski, P., and Külls, C., 2010. Tracers in hydrology. John Wiley & Sons Ltd. doi:10.1002/9780470747148
- Maciejewski, S., et al., 2006. Modelling of water flow through typical Bavarian soils (Germany) based on lysimeter experiments: 1. Estimation of hydraulic characteristics of the unsaturated zone. Hydrological Sciences Journal, 51, 285–297. doi:10.1623/hysj.51.2.285
- Maloszewski, P., et al., 2006. Modelling of water flow through typical Bavarian soils based on lysimeter experiments: 2. Environmental deuterium transport. Hydrological Sciences Journal, 51, 298–313. doi:10.1623/hysj.51.2.298
- McConville, C., et al., 2001. Evaluation of recharge in a small temperate catchment using natural and applied δ18O profiles in the unsaturated zone. Ground Water, 39 (4), 616–623. doi:10.1111/gwat.2001.39.issue-4
- Ministère du Développement durable, de l’Environnement et de la Lutte contre les changements climatiques, 2016. Données du Programme de Surveillance du climat. Québec: Direction générale du suivi de l’état de l’environnement.
- Mueller, M.H., et al., 2014. Tracking water pathways in steep hillslopes by δ18O soil depth profiles of soil water. Journal of Hydrology, 519, 340–352. doi:10.1016/j.jhydrol.2014.07.031
- NAVFAC DM7, 1974. Design manual – soil mechanics, foundations, and earth structures. Washington, DC: U.S. Government Printing Office.
- Orlowski, N., et al., 2013. Validation and application of a cryogenic vacuum extraction system for soil and plant water extraction for isotope analysis. Journal of Sensors and Sensor Systems, 2, 179–193. doi:10.5194/jsss-2-179-2013
- Rosenbom, A.E., et al., 2008. Fluorescence imaging applied to tracer distributions in variably saturated fractured clayey till. Journal of Environment Quality, 37, 448–458. doi:10.2134/jeq2007.0145
- Rothfuss, Y., Vereecken, H., and Brüggemann, N., 2013. Monitoring water stable isotopic composition in soils using gas-permeable tubing and infrared laser absorption spectroscopy. Water Resources Research, 49, 3747–3755. doi:10.1002/wrcr.20311
- Rutledge, A.T., 2007. Update on the use of the RORA program for recharge estimation. Ground Water, 45 (3), 374–382. doi:10.1111/gwat.2007.45.issue-3
- Saxena, R.K. and Dressie, Z. 1984. Estimation of groundwater recharge and moisture movement in sandy formations by tracing natural oxygen-18 and injected tritium profiles in the unsaturated zone. In: International Atomic Energy Agency (IAEA) Proceedings Series 270/46, 12–16 September 1983, Vienna, Austria, 139–150. ISBN 92-0-040084-1. Vienna: International Atomic Energy Agency (IAEA).
- Scanlon, B.R., Healy, R.W., and Cook, P.G., 2002. Choosing appropriate techniques for quantifying groundwater recharge. Hydrogeology Journal, 10 (1), 18–39. doi:10.1007/s10040-001-0176-2
- Sprenger, M., et al., 2015a. Estimating flow and transport parameters in the unsaturated zone with pore water stable isotopes. Hydrology and Earth System Sciences, 19, 2617–2635. doi:10.5194/hess-19-2617-2015
- Sprenger, M., et al., 2016a. Illuminating hydrological processes at the soil-vegetation-atmosphere interface with water stable isotopes. Reviews of Geophysics, 54, 674–704. doi:10.1002/2015RG000515
- Sprenger, M., et al., 2016b. Travel times in the vadose zone: variability in space and time. Water Resources Research, 52, 5727–5754. doi:10.1002/2015WR018077
- Sprenger, M., Herbstritt, B., and Weiler, M., 2015b. Established methods and new opportunities for pore water stable isotope analysis. Hydrological Processes, 29, 5174–5192. doi:10.1002/hyp.10643
- Stumpp, C., et al., 2009. Environmental isotope (δ18O) and hydrological data to assess water flow in unsaturated soils planted with different crops: case study lysimeter station “Wagna” (Austria). Journal of Hydrology, 369, 198–208. doi:10.1016/j.jhydrol.2009.02.047
- Stumpp, C., et al., 2012. Effects of land cover and fertilization method on water flow and solute transport in five lysimeters: a long-term study using stable water isotopes. Vadose Zone Journal, 11. doi:10.2136/vzj2011.0075
- Stumpp, C. and Hendry, J., 2012. Spatial and temporal dynamics of water flow and solute transport in a heterogeneous glacial till: the application of high-resolution profiles of δ18O and δ2H in pore waters. Journal of Hydrology, 438-439, 203–214. doi:10.1016/j.jhydrol.2012.03.024
- Stumpp, C. and Maloszewski, P., 2010. Quantification of preferential flow and flow heterogeneities in an unsaturated soil planted with different crops using the environmental isotope δ18O. Journal of Hydrology, 394, 407–415. doi:10.1016/j.jhydrol.2010.09.014
- Van Genuchten, M.T., 1980. A closed-form equation for predicting the hydraulic conductivity of unsaturated soils. Soil Science Society of America Journal, 44, 892–898.
- Volkmann, T.H.M. and Weiler, M., 2014. Continual in situ monitoring of pore water stable isotopes in the subsurface. Hydrology and Earth System Sciences, 18, 1819–1833. doi:10.5194/hess-18-1819-2014
- Vukovic, M. and Soro, A., 1992. Determination of hydraulic conductivity of porous media from grain-size composition. Littletown, CO: Water Resources Publications, 83 p.
- Wassenaar, L.I., et al., 2008. High resolution pore water δ2H and δ18O measurements by H2O (liquid)-H2O (vapor) equilibration laser spectroscopy. Environmental Science & Technology, 42, 9262–9267. doi:10.1021/es802065s
- Yin, L., et al., 2011. Groundwater-recharge estimation in the Ordos Plateau, China: comparison of methods. Hydrogeology Journal, 19 (8), 1563–1575. doi:10.1007/s10040-011-0777-3