
ABSTRACT
Emulation modelling can be an effective alternative to traditional mechanistic approaches for complex environmental systems and, if carefully conceived, can offer significantly reduced run times and user expertise requirements. We present a case study of dynamic emulation for the domain of estuarine water quality modelling, by reporting the development and evaluation of a one-dimensional hydrodynamic model emulator. The proposed “neuroemulator” retains the dynamic nature of the process-based model utilizing a set of artificial neural networks. The underlying hydrodynamic model is routinely used for analysis and management of the northern reach of the San Francisco Bay-Delta estuary, a large complex region of strategic importance for water supply and ecosystem services on the Pacific coast of California, USA. The reduced computational expense of the emulator affords opportunities for direct use, as well as embedded use within other modelling frameworks such as those developed for reservoir operations and socio-hydrology.
Editor R. Woods; Associate editor A. Efstratiadis
Introduction
Computer models are playing an ever increasing role in fostering our understanding of natural systems behaviour. Advances in computational capabilities have contributed to the successful development and application of sophisticated process-based models for the analysis and management of large-scale, complex environmental systems. However, the computational expense and esoteric user expertise associated with these mechanistic models often limit their practical usage, particularly in applications that evaluate long periods of record (e.g. due to the use of synthetic data) or require extensive sensitivity or scenario analysis. Emulation modelling (also termed surrogate modelling) can be an effective alternative to these more traditional process-based modelling approaches. Castelletti et al. (Citation2012) defined an emulation model as a “low-order approximation of the process-based model that can be substituted for it in order to solve a high resource-demanding problem”. In this paper we present a case study of dynamic emulation modelling for the domain of estuarine water quality; the case study summarizes the development and evaluation of a hydrodynamic model emulator using a set of artificial neural networks (ANNs), a subset of model emulation that has been termed “neuroemulation” (Abrahart et al. Citation2012a). Although the term neuroemulation is relatively new, the concept is not, and several model emulation studies using ANNs have been documented over the past two decades (e.g. Minns and Hall Citation1996, Londhe and Deo Citation2003, Wilby et al. Citation2003).
This case study is focused on the development of an emulator for a mechanistic one-dimensional hydrodynamic model representing estuarine mixing and water quality in the northern reach of the San Francisco Bay-Delta estuary (hereafter the Delta) on the Pacific coast in California, USA. Water quality management in the Delta is of importance, as it is the single largest freshwater supply for municipal and agricultural uses in California and is a region of great ecological significance (Norgaard et al. Citation2009, Luoma et al. Citation2015). The Delta is characterized by complex hydrodynamics, with multiple islands and branched channels, and is subject to strong daily and sub-daily variations in tidal and freshwater inflows from several sources. Although a wide variety of model emulators have been reported in the literature, the particular case of estuarine water quality models (with highly dynamic tidal and freshwater flow interactions) has not been reported. The general literature uses a variety of terminology for this field of study, including surrogate modelling, meta-modelling, and model approximation (e.g. Zhang et al. Citation2009, Carnevale et al. Citation2012, Villa-Vialaneix et al. Citation2012, Razavi et al. Citation2012a, Citationb, Sun et al. Citation2015). Not all emulation modelling is concerned with dynamic processes; even when a dynamic process is the focus of study, retaining the full dynamic behaviour of the underlying process model may or may not be necessary to meet the study-specific emulation goal. The term dynamic emulation modelling is specifically applicable to the work presented in this case study. A further classification of this case study is as a hybrid ANN model (Abrahart et al. Citation2012b, Wu et al. Citation2014) because it is not based on observed data; instead, it merges the output of a process-based mechanistic model with an ANN framework.
In this paper, ANNs were used for the emulation modelling – this specific approach was termed neuroemulation by Abrahart et al. (Citation2012a) – for several reasons. First, ANNs have demonstrated success in emulating complex transport processes in several key sub-regions of the Delta (Finch and Sandhu Citation1995, Sandhu et al. Citation1999, Seneviratne et al. Citation2008, Chen and Roy Citation2014, Rath et al. Citation2017). Second, ANNs were adopted because of the extensive body of literature demonstrating their use in general water resources applications with complex, nonlinear relationships between inputs and outputs (e.g. Maier et al. Citation2010, Wu et al. Citation2014). Third, ANNs are reported to be one of the more common emulation approaches (Razavi et al. Citation2012a). Finally, ANNs were adopted given their potential benefits for enabling structural diagnostics, performing sensitivity analysis, and facilitating scenario analysis and decision making (Abrahart et al. Citation2012b).
Besides ANNs, a variety of mathematical frameworks have been deployed for model emulation across different environmental disciplines, ranging from simple polynomial approximation to more complex approximation, such as kriging, support vector machines, and gaussian process emulation; for example, the reader is referred to Razavi et al. (Citation2012a) for a literature review on water resources, and Lee et al. (Citation2011) and Castruccio et al. (Citation2014) for applications in other domains. Each of these emulation methods has strengths and weaknesses, some of which have been reported in comparative studies where the same process model is emulated using different techniques (Zhang et al. Citation2009, Villa-Vialaneix et al. Citation2012). Despite the availability of this increasingly robust literature on emulation modelling, there is no general guidance as to the best approach for an arbitrary problem, and study results are typically tied to the nature of the individual problem or model under consideration. Thus, one might utilize the reported experience for emulation of a particular type of model (e.g. watershed models) to direct future work on related models and systems. To the best of our knowledge, there are no published studies of dynamic emulation modelling of water quality in other estuarine settings that could inform this case study; thus, the selection of neuroemulation was guided by the Delta-specific experiences noted above.
The research objective of this work was to develop a suitable emulator – meeting the key criteria of rapid run times and relatively easy user access – for a complex, real-world mechanistic model that is used widely in support of water resources and quality management in California. The one-dimensional Delta Simulation Model (DSM2) (Liu and Sandhu Citation2012) was selected as the emulator prototype from among several available estuarine hydrodynamic models because of its widespread use in operations and planning by the California water community. The emulation method chosen (ANNs using the multi-layer perceptron, or MLP structure) was based on the extensive application and success of this approach in modelling dynamic water resources problems, and the availability of a commercial software framework for implementation. The primary challenges encountered during this work were the complexity of the underlying model, the large datasets required for training, and the absence of a priori guidance on the best approach for model emulation in the domain of estuarine water quality. The practical outcomes of this work include: (1) a methodology that is shown to effectively emulate a spatially and mechanistically complex model, with potential application to other similarly structured models; (2) an emulation tool with potential application by a broad user base concerned with water quality and water resources issues in California; and (3) the potential development of a new class of future applications wherein the emulator is embedded within other larger modelling frameworks, e.g. reservoir modelling and socio-hydrology, among others. Although ANNs have been used for modelling subsets of Delta processes as noted above (e.g. Chen and Roy Citation2014, Rath et al. Citation2017), there is no published information on the emulation of the entire Delta Simulation Model framework.
In the remainder of this paper, we first provide background on the case study’s environmental setting and the hydrodynamic model that numerically represents the setting. Next we describe the methods employed to develop a neuroemulator of the process-based model. The general emulation methodology follows the procedural steps outlined in Castelletti et al. (Citation2012), thus placing this work in the broader context of contemporary emulation literature. Evaluation of the ANN emulation model follows general guidelines (Maier et al. Citation2010, Wu et al. Citation2014), which were based on an extensive review of the application of ANNs in the water resources literature. We present results from the case study with a dual focus on quality of fit (predictive validation) and response to key inputs (structural validation). We note that, in the context of neuroemulation, structural validation can be assessed explicitly in a manner not available to ANN models fit with field observations. Specifically, structural validation of neuroemulators can be assessed directly by re-running the process-based model to develop additional data for a different set of inputs, a step for which there is no analogue when fitting with field observations. Finally, we discuss the relevance of this work to the wider literature on model emulation and on modelling of estuarine processes.
Background
Environmental setting
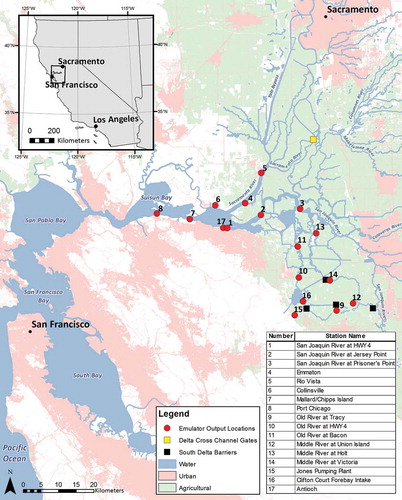
The Delta, a complex estuarine system distinguished by several freshwater inflows and tidal exchange with the Pacific Ocean, is an intricate network of channels and islands spanning 740 000 acres that supports a diverse ecosystem and a predominantly agricultural land use (Fig. 1). The Central Valley Project (CVP) and State Water Project (SWP) export water from the Delta to irrigate more than 3 million acres of farmland in the San Joaquin Valley and south coast of California and provide municipal supply for more than 20 million people. Freshwater exports from the Delta are the single largest source of water for diverse human uses in the state of California, which, as a unit, ranks as the eighth largest economy in the world (Delta Plan Citation2013, Luoma et al. Citation2015). California is also the largest agricultural producing state in the USA, and some of the most productive counties in the state (2012 Census of US Agriculture, USDA 2017) are supported in part by water exports from the Delta. The Delta is also a region of great ecological importance, with more than 750 plant and animal species present, including some that are endangered or threatened (Delta smelt, Hypomesus transpacificus; Longfin smelt, Spirinchus thaleichthys) and others that are commercially important (e.g. chinook salmon, Oncorhynchus tshawytscha) (Luoma et al. Citation2015, Moyle et al. Citation2016, Nobriga and Rosenfield Citation2016).
Freshwater inflows to the Delta are provided by the Sacramento River, the San Joaquin River, and smaller east-side tributaries, including the Mokelumne, Cosumnes, and Calaveras rivers (). Within the Delta, flow patterns and water quality are affected by hundreds of agricultural withdrawals and agricultural return flows. Freshwater flows exit the Delta into San Francisco Bay and the Pacific Ocean at Golden Gate. The Delta is tidally influenced, and seawater intrudes and disperses as a function of freshwater flows and tidal water levels. In addition to releases from upstream reservoirs, flow control facilities, including rock barriers and operable gates, are used to manage flows and associated water quality characteristics in the Delta. This complex system has been developed over the past century, in part to manage the multiple flow and water quality requirements for humans and the ecosystem in the estuary.
Figure 1. Geographic setting of the San Francisco Bay-Delta Estuary (Delta) and 17 pre-defined hydrodynamic model emulator output locations. Delta land use is predominantly agricultural although the Bay margins are highly urbanized. Locations of key structures used to control water flow and quality, i.e. the Delta Cross Channel (DCC) gates and the south Delta barriers, are also shown.
Delta water quality
At any given location in the Delta, the water is a complex mixture of freshwater inflows and seawater, each with its characteristic water quality, and is affected by natural drivers and management actions. As an estuary in a relatively arid region, salinity is the primary water quality parameter of concern in the Delta, for both human and ecological uses. However, other constituents are also of interest from the standpoint of drinking water quality and ecosystems, and have been monitored extensively over the past three decades. For example, the California Department of Water Resources (CDWR) Municipal Water Quality Investigation (MWQI) programme monitors Delta water quality for drinking water constituents of interest; the programme collects data at 12 stations for many constituents, such as chloride (Cl), bromide (Br), sulphate (SO42−), base cations (calcium, Ca2+, potassium, K+, etc.), organic carbon, and total dissolved solids (TDS) (MWQI Citation2017). Most of these constituents may be considered to be conservative (non-reactive) in Delta waters; other ones, such as dissolved organic carbon (DOC), may be considered approximately conservative (Hutton et al. Citation1996). These conservative and near-conservative constituents are the focus of the present study. Other reactive water quality constituents (e.g. nutrients and trace elements, such as mercury and selenium) are also the subject of active monitoring and research in the Delta through the MWQI and other programmes, but they are beyond the scope of the present modelling effort.
Drinking water quality is primarily related to the conservative constituents identified above (Chen et al. Citation2010). Salinity can cause taste problems, affect water recycling, and raise costs to water users due to corrosion. Bromide, as a component of salinity, is a constituent of concern due to its potential to form several brominated disinfection by-products (DBPs), such as trihalomethanes (THMs), halo-acetic acids (HAAs), and bromate during drinking water treatment (Hutton and Chung Citation1994, Hutton et al. Citation1996). The major source of bromide in the Delta is seawater intrusion. Organic carbon is another constituent of concern, due to its potential to react with chlorine and ozone during disinfection processes to form DBPs (Roy et al. Citation2006, Chow et al. Citation2008). Major sources of organic carbon in the Delta include tributary inputs, agricultural drainage, algae, tidal marshes, wastewater discharge, and urban runoff. Local delta island drainage from peat soils is another important source of organic carbon to the Delta (Deverel et al. Citation2007). To minimize the formation of THMs and other DBPs, most utilities that use Delta water employ ozonation for disinfection (Chen et al. Citation2010). However, during ozonation, bromide remains a constituent of concern because it can react with ozone and organic carbon to produce potent brominated forms of DBPs during disinfection (Krasner et al. Citation2006).
The variable ionic composition and total dissolved solids in the three major water sources in the Delta are shown in . The salinity of seawater is predominantly sodium and chloride; salinity in the Sacramento River is predominantly bicarbonate; and salinity in the San Joaquin River is characterized by a homogenous blend of minerals, including a significant sulphate fraction resulting from agricultural drainage. The TDS concentrations of the three source waters are approximately 34 500 mg/L for seawater, 100 mg/L for the Sacramento River, and 300 mg/L for the San Joaquin River (Hutton Citation2006). Delta water quality at any point in space and time will reflect the signals from these major water sources, as well as the signals from volumetrically smaller sources (e.g. smaller tributaries and in-Delta agricultural return flows). However, given that the TDS of seawater is more than two orders of magnitude greater than the other source waters, the intrusion of even a small percentage of seawater by volume will lead to high ionic concentrations in the Delta.
Delta water quality modelling
Given the significance of the Delta to California’s water supplies and ecology, there has been a long history of modelling of the system to support management and for basic research. The earliest models date back nearly five decades (e.g. Orlob and Shubinski Citation1969, Di Toro et al. Citation1971), and an active modelling community supports a variety of one-dimensional (1D), two-dimensional (2D), and three-dimensional (3D) simulation tools, especially for hydrodynamics and salinity transport (e.g. Liu and Sandhu Citation2012, Achete et al. Citation2015, MacWilliams et al. Citation2015, Andrews et al. Citation2017, Martyr-Koller et al. Citation2017).
Of the above simulation tools, this work is focused on the emulation of the Delta Simulation Model (DSM2) (Liu and Sandhu Citation2012), because it is the most widely used of the Delta water quality models, particularly for management-related applications. The DSM2 model, first developed in 1998 from an earlier generation of models, is subject to regular process representation updates and calibration improvements (CDWR Citation1998, Liu and Sandhu Citation2012, Finch Citation2014). The DSM2 model represents mixing of freshwater and saltwater flows and exchanges across the Delta islands through a channel network. Also, it represents various flow control gates and barriers that are used to maintain desirable water quality at key locations in the Delta. Using a set of boundary flows and concentrations, DSM2 can compute the resulting concentrations across space and time within the Delta; see the model schematic shown in . Water quality constituents that have been modelled, typically tied to one or more beneficial uses for Delta waters, include conservative constituents, such as specific conductance as a surrogate for salinity, individual cations and anions, as well as non-conservative constituents, such as nitrate (the majority of applications are institutional reports in the public domain, e.g. Pandey Citation2001, Liu and Suits Citation2012, Liu and Sandhu Citation2012, MWH Citation2012). Given their longer run times, simulation results from high-dimensional models are generally reported for short durations (e.g. 2–5 years; MacWilliams et al. Citation2015, Martyr-Koller et al. Citation2017) relative to DSM2. While high-dimensional models are being applied to explore the more complex issues of the region, at present they are not used for routine operations and planning analysis, and thus they were not considered in the present study.
Model calibration is typically performed by running the model and adjusting the channel friction (Manning’s n) coefficient and the dispersion coefficients (Liu and Sandhu Citation2012). Model calibration was recently refined by adjusting a larger number of system components, including channel geometry details and poorly quantified island exchanges (Finch Citation2014). The DSM2 version used for the present analysis is v8.0.6 with the source code and executable files available in the public domain (CDWR Citation2017).
Fingerprinting
Because of the complex mixing of water from different sources (e.g. seawater, San Joaquin River, Sacramento River) and long residence time in the Delta, there is an occasional need to know the relative contribution of the different sources at a particular location. Tracking the water quality signal of different boundary sources at particular points in space and time in the Delta is herein referred to as “fingerprinting”, shown schematically in . To address this need, an additional DSM2 module was developed to allow for fingerprinting of individual sources across the Delta (Anderson Citation2002, Anderson and Wilde Citation2005). The assumption behind the DSM2 fingerprint calculation is that constituent transport is conservative and does not change as a result of any reactions (such as decomposition, volatilization, or other transformation). Theoretically, the approach is applicable for specific conductance (SC) and major cations and anions, such as Na+, Ca2+, Cl−, and Br−, and approximately valid for a constituent such as DOC, which can be assumed to be minimally reactive in the Delta (Hutton et al. Citation1996).
The fingerprint concept can also be stated mathematically. At any given location in the Delta, the water volume will be a mixture of the contributions from the boundary flows. The contributions may be from the current time step and/or from previous time steps. The constituent concentrations can be calculated at each Delta location through superposition as the sum of the products of volumetric contributions and boundary concentrations, as defined below:
where Ccc(t) is the concentration of a conservative constituent at a specified location and time, Ci,-j is the concentration of a conservative constituent from a boundary source i at time −j, n is the total number of boundary sources, m is the length of the system memory (assumed to be up to 6 months), and V%i,−j is the percentage volume at a specified location from source i at time −j.
Note that once the volumetric contribution from different inflows has been obtained from DSM2 for each defined output location (V%i,−j), the calculation of concentration is only a matrix multiplication with the boundary concentration values, and does not require the DSM2 water quality model to be run.
The DSM2 model, including the fingerprint component, is well established in the stakeholder community, considered credible and used widely for studies to understand water quality impacts associated with changes in flows, operational conditions and infrastructure. However, it requires a fairly high level of user expertise and computational resources to run, limiting its application among the larger community of individuals concerned with water quality management in the Delta. The goal of this work was to develop and evaluate an emulator for DSM2 using a set of artificial neural networks (ANNs), which retains the dynamic nature of the original model.
Methods
For consistency with the broader literature on dynamic emulation modelling, methods associated with the case study are broadly introduced within the context of a general framework proposed by Castelletti et al. (Citation2012). Next we describe the development of ANN training data using the process-based model, i.e. DSM2. First, we pre-selected a set of hydrological conditions and gate/barrier operations and ran the model using these inputs to produce time series of volumetric fingerprints at pre-selected training locations. The resulting time series data were split randomly into three categories, for training, validation and testing, although the quantity of data in each group was fixed at 70, 15 and 15%, respectively. Working with these data, an appropriate structure for the emulation model was developed through extensive trial and error; the overall structure included individual sets of ANNs for each source and location. The training process resulted in a set of ANNs that emulated the response in terms of volumetric fingerprint (V%i,−j in Equation (1)) at 17 pre-defined locations shown in . The volumetric fingerprint computed by the ANNs was multiplied with the boundary source concentrations to estimate the concentration at each pre-defined location. Thus, the emulation of concentrations at a given location consists of an ANN emulation of the volumetric contribution of individual sources and a matrix multiplication of the fingerprints with the boundary concentrations. Model results were evaluated by comparing the quality of fit to the DSM2 output for the same inputs (termed predictive validation by Wu et al. Citation2014) and by evaluating the response of the model to fixed changes in inputs (akin to structural validation, as defined by Wu et al. Citation2014). These methods are described in more detail below.
Emulator conceptual framework
This neuroemulation case study falls into the general category of dynamic emulation (Castelletti et al. Citation2012). For consistency with the literature, identifies the relationship of the general elements of this framework with components of our case study. The broad goal of the study is to emulate the DSM2 model for the purposes of decision making and scenario analysis, with a specific goal of exploring the response of the process-based model at pre-defined locations in the Delta, as a function of the exogenous drivers and different conditions of the control vector. The problem category being addressed does not require recalibration of the underlying process-based model, and the model parameters in DSM2 (e.g. Manning’s n, dispersion coefficients, and channel geometry) are not adjusted during the development of the DSM2 emulation. Because the model emulation is performed with an ANN framework using DSM2-generated data, the case study’s broad goal is accomplished through development of a data-based emulator (Castelletti et al. Citation2012), independent of the mechanistic process equations within DSM2.
Table 1. Case study design in the context of a general framework proposed for dynamic emulation modelling (Castelletti et al. Citation2012).
A set of DSM2 simulations with a range of flow operation scenarios, including gate conditions and with Delta water exports included or excluded, were developed to represent the volumetric contribution of the boundary flows (). A set of hydrological conditions was defined and the DSM2 model was run using these inputs to produce the values of volumetric contribution at previously specified locations. The same hydrological inputs were set to a feedforward ANN and the training performed to match the DSM2 output data. Multiple ANNs were used to represent each station and the volumetric contribution associated with each of the major sources. The training procedure resulted in a set of ANNs that emulated the response at the 17 pre-defined locations. The ANN-component was focused on estimating the volumetric fingerprint. The ANN-based volumetric fingerprint was associated with the constituent concentrations at the boundaries, as in Equation (1), to calculate the resulting concentrations at the output locations. Thus, the emulation of concentration includes two discrete parts: (1) an ANN emulation of the volumetric fingerprints, and (2) a matrix multiplication of the fingerprints with the corresponding boundary concentrations.
ANN training data
The first step in this work was to design and run a series of DSM2 hydrodynamic and water quality simulations, to generate an ANN training dataset of 24-hour daily averaged model results that represents a wide range of Delta hydrological and water management conditions. This step is also termed the “design of experiments” in the modelling emulation literature (e.g. Razavi et al. Citation2012b). The DSM2 model was run to simulate unique volumetric contributions from 15 boundary sources over a period spanning from October 1990 to April 2010. This simulation period was selected because (a) of the availability of a well-calibrated model with inputs and outputs and (b) its widely varying hydrology represents all five water year classifications defined for regulatory and planning purposes in the basin (i.e. wet, above normal, below normal, dry, and critical) (Hutton et al. Citation2015). We would expect a similar training outcome if a different time period was selected, so long as it was similarly representative of the basin’s hydrology.
Ten scenarios, bounding the range of possible water management operations (), were simulated over the two-decade hydrological sequence. These scenarios represent the full range of water management operations that may be simulated with the DSM2 model: implementation of temporary barriers (historical operations, barriers always in place, and barriers always taken out), operation of Delta Cross Channel (DCC) gates (historical operations, gates always closed, gates always open), and south Delta exports (historical exports and no exports). The first scenario represents the historical condition and assumes inflows and operations that occurred in the past. The remaining scenarios represent various adjustments to the historical water management operations. Multiple DSM2 scenarios were defined to create an ANN training dataset that was not only large, but also captured a wide range of flow and water management conditions. The motivation driving the case study’s scenario design is that ANNs, like other empirical formulations, perform better at representing conditions that are within their training horizon, and their performance outside this range is not well defined.
Table 2. Synopsis of process-based model (DSM2) scenarios that were used to provide a wide range of conditions for ANN training. DCC: Delta Cross Channel.
The resulting ANN training dataset represents volumetric contributions from 15 sources (), including the Sacramento River at Freeport, the San Joaquin River at Vernalis, the Mokelumne River downstream of the Cosumnes River confluence, the Calaveras River, the Yolo Bypass, the downstream tidal boundary at Martinez, and nine source groups from the Delta islands (). These sources were linked to 17 pre-defined locations (considered important from the standpoint of water quality regulation and management). Volumetric contributions by source were calculated by simulating a conservative tracer in DSM2. A conservative tracer is assigned to each source location for each month, and the concentration of this tracer is tracked to calculate the volumetric contribution of the corresponding source. For each location, we obtained the DSM2-generated volumetric fingerprint from a source for the current month (V1%) and the five preceding months (V2%–V6%). The simulated volumetric contributions from the 90 tracers (15 sources with six time stamps) for each of the 17 locations were used in the ANN training. The Delta has an approximate system memory (i.e. water residence time) of 6 months or less; therefore, additional antecedent values were assumed insignificant. After 6 months, the tracers were re-used, i.e. the same tracer number was used for the months of January and July, February and August, and so on.
Table 3. List of boundary sources used within the process-based model (DSM2) to simulate unique volumetric contributions.
Table 4. Input variables for the process-based model (DSM2) emulation, including continuous flow and water level values and discrete gate status values. cfs: cubic feet per second; MSL: mean sea level.
For the ANN model training, an aggregated set of hydrodynamic time series variables (in terms of flow or tidal stage) were used as inputs (). In order to better represent the impacts of flow control structures and exports on Delta hydrodynamics, the operation of south Delta barriers (0: closed; 1: open), the DCC gates (0: closed; 1: one gate open; 2: two gates open) and Delta exports were also included in the ANN model training inputs. The tidal time series represents the historical mean daily sea level at Martinez. The Delta combined exports time series represents water diversions associated with the SWP, CVP, Contra Costa Canal (CCC) and the Contra Costa Water District diversion at Los Vaqueros (LVR). As itemized in , a total of 14 variables were used as the ANN model inputs, which constitute a simplified representation of the full suite of hydrodynamic boundary conditions utilized by the process-based model.
Model structure
The dynamic nature of flow and mixing in the Delta is represented by a network structure that allows for a time series input, with current and previous values of inputs being considered. This is done using an architecture called multilayer perceptrons (MLPs). Although other network structures, such as generalized regression neural networks (GRNNs), modular ANNs, and fuzzy hybrid ANNs, have received attention in the recent hydrological literature (Cigizoglu Citation2005, Wu et al. Citation2010, Chen et al. Citation2015), historically, MLPs are by far the most popular ANN network structure used in similar water resources applications; particularly, they represent more than 90% of peer-reviewed applications in this field (Maier et al. Citation2010). The overall structure of the ANNs, as described below, was based on extensive trial and error, with the goal of reasonably representing the dynamic outputs of DSM2.
All ANNs were run with the same inputs but were trained for different outputs. We trained ANNs for each of the boundary sources identified in , resulting in 20 ANNs for each of the 17 Delta output locations: six ANNs for Sacramento River at Freeport (representing tracers from the current and five previous months), nine ANNs for Delta agricultural return flow (representing nine Delta sub-regions), and one ANN for each of the remaining boundary sources (i.e. San Joaquin River at Vernalis, Calaveras River, Mokelumne River downstream of Cosumnes River confluence, Yolo Bypass, and tidal boundary at Martinez). With the exception of the Sacramento River ANNs, each ANN produces six columns of outputs representing six tracers from the month and five previous months corresponding to that boundary source. For example, the San Joaquin River ANN produces the output for V1%–V6% at a specific Delta location for tracers originating at Vernalis. Thus, for the 17 output locations, 340 (17 × 20) ANNs were utilized.
For each ANN, the input layer contained a time series of 14 input variables (). The hidden layer uses 30 neurons, which is formulated based on input variables using a set of weights and biases. Each neuron is calculated using weights and inputs from each input variable. For the 30 neurons and 14 input variables, this yielded a total of 420 (14 × 30) weights and 420 bias parameters that were adjusted during training. An input time delay of 180 days was used to account for the contribution of inputs from previous time steps, given the residence time in the Delta, which could be up to 6 months. The output layer contained the volumetric contributions over 6 months for a specific source.
Training technique and dataset division
The ANN training was performed using a commercially available product, the MATLAB Neural Network Toolbox (Beale et al. Citation2011). While other commercial and non-commercial tools may have similar functionality, a formal evaluation of these tools was beyond the scope of our case study. The general approach for training is shown in . With the large dataset used in the training (outputs from 15 sources at six time steps, 17 output locations, and 10 DSM2 scenarios), ANN training was conducted separately for different stations and sources. Each training set consisted of 71 480 daily sets (rows) of data. For each training run, 70, 15, and 15% of the data were used for training, validation, and testing, respectively. The training, validation, and testing sets were randomly selected from the entire dataset for each training cycle. Since the training outputs are six variables representing percentage volumetric contribution from six time periods, the output magnitudes can be very different, depending on the location and time period. It is not unusual for the volumetric contribution from one time period to be much greater than other ones. The DSM2-simulated percentage volumetric contribution could vary over several orders of magnitude, i.e. from 90% to less than 0.09%. Given the large variation among the six volumetric tracers, as a training error minimization approach we selected the mean standard error (MSE) with “percent” normalization rather than the normal MSE. Using this approach, the error was normalized to the range of [–1, +1] across different variables during training (Beale et al. Citation2011). The normalization accommodated fitting variables that are small in magnitude. Training was stopped when the improvement in performance between the training and validation data was below a pre-defined threshold.
Because of the network extent and the long time lags (180 days) incorporated in the training, the requirements for computer system memory and speed were substantial. Within ANN training we selected the scaled conjugated gradient (SCG) method, because it has been reported to provide faster convergence than other error minimization approaches, such as Levenberg-Marquardt (LM), for large training datasets (Beale et al. Citation2011). Nevertheless, a formal evaluation of the efficiency of other error minimization algorithms could be a topic for future research.
Model evaluation
The final ANNs were evaluated based on their goodness of fit to the water quality data generated from the DSM2 model, with interim testing performed on the data subsets during the training procedure. While this step, defined as predictive validation by Wu et al. (Citation2014), provides information on the overall performance of the ANN at representing the underlying data, it does not provide structural information as to the relationships between inputs and outputs (Wu et al. Citation2014). To further evaluate whether the ANNs reasonably represented the DSM2 model, we performed two additional tests. In the first test, we extended the DSM2 simulation through 2010–2012, i.e. a hydrological period that was distinct (independent hydrology and gate conditions) from the training/testing/validation set described in Section 3.2. In the second test, we evaluated the response of the ANN models to specific input changes (by means of gate operations, Sacramento River flows, and export volumes), and compared the ANN response to the response of the DSM2 model for the same input changes. This second step may be considered similar to the concept of structural validation, as described by Wu et al. (Citation2014).
Model application
The volumetric fingerprint simulation results of the ANNs were applied to estimate the specific conductance (SC) at the 17 output locations within the Delta. The SC was chosen as an illustrative tracer for this study because salinity is a key variable in an estuarine setting, and also because SC is the most common field measure of salinity in the Delta. Emulator results were compared to SC estimates derived from the DSM2-simulated volumetric contribution using the same calculation method. The SC, a common measure of how well water can conduct an electrical current, is highly correlated with ionic concentrations in water. An Excel interface has been developed to estimate SC or DOC at given locations, using user inputs of flow and concentrations from source boundaries. For model validation, the ANN-estimated and DSM2-simulated volumetric contribution from each source, along with SC concentrations at source locations, were used to calculate SC at predicted locations within the Delta. A similar application was conducted for bromide and DOC.
The SC values at Martinez (user input to the emulator) were derived as a function of Delta outflow (Hutton et al. Citation2015), while SC associated with other boundary inflows (e.g. Sacramento River at Freeport, San Joaquin River at Vernalis, agricultural return flows) were derived from DSM2 inputs. Similarly, bromide and DOC concentrations associated with boundary inflows were derived from DSM2 inputs.
Results
ANN performance
The ANN-simulated volumetric contributions were compared to DSM2-simulated volumetric contributions for each of the modelled flow sources. The fit in terms of correlation coefficient was usually above 0.90 with a few exceptions (additional details are provided by Chen and Roy Citation2015). Generally, the stations on the Sacramento River and San Joaquin River tributaries have better fits than stations along Old and Middle rivers. This result is easily explained by the fact that the former are highly influenced by a single source (either Sacramento or San Joaquin river flow). Time series plots at different scales provide additional insight into the operation of the ANNs. shows the comparison of DSM2 and ANN calculated volumetric contributions at one representative location, Old River at Bacon Island (ORB; Station 11 in ; see Supplementary material for input and output data for this station). In general, the ANNs are able to predict very well the contributions from an individual source at different time periods. The ANN model captures the relative dominance of the Sacramento River at this location, with smaller contributions from the tidal boundary at Martinez, flows from the San Joaquin and Mokelumne rivers, and agricultural return flows.
Predictive validation
The emulator can be applied to simulate SC at the 17 pre-defined Delta locations by multiplying the ANN-generated volumetric fingerprints with user-provided boundary concentrations. The emulator results were compared to SC, derived from DSM2 fingerprint results at each of the 17 trained locations (). The correlation between emulator and DSM2-simulated SC is high (usually r2 > 0.90), demonstrating that the emulator is able to simulate SC variations at most locations. A similar application was conducted to simulate bromide (Br) and DOC at different locations in the Delta. Bromide concentrations at source boundaries were derived from SC based on relationships between Br with SC at these boundary locations, developed by MWH (Citation2012). DOC concentrations at boundaries were derived from DSM2 model inputs (Liu and Sandhu Citation2012). Similarly good agreement between emulator- and DSM2-simulated concentrations for Br and DOC were found across all output locations (see Appendix, and ). The correlation between emulator- and DSM2-simulated concentrations is generally strong (usually r2 > 0.85).
Table 5. Comparison of emulator outputs with process-based model (DSM2) outputs for specific conductance (SC, in μS/cm) at 17 output locations. Slope, intercept and r2 refer to a straight-line best fit between emulator and DSM2 values. RMSE: Root mean square error.
As previously noted, DSM2 model inputs and outputs from the 1990–2010 hydrological period were used for ANN development. As a further test of the emulation model, the hydrological period was extended through 2012 to generate DSM2-simulated SC directly (i.e. without the use of fingerprinting). The trained ANN models were run for the extended period of 2010–2012. Because the input conditions from 2010–2012 were independent of the data previously provided to the ANNs, the agreement is indicative of a reasonable underlying representation of the original model. The results showed good agreement over the period of 2010–2012 ().
Structural validation of ANN emulation
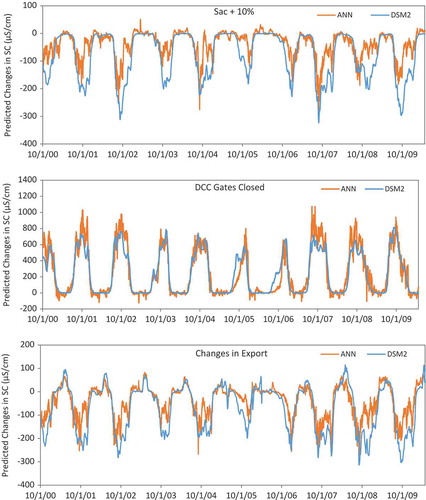
To explore the structural validity of ANNs, the trained models were tested for sensitivity to the following three perturbations and their performance was compared with that of the original DSM2 model:
Closure of DCC gates;
Increase of Sacramento River flow by 10%;
Reduction in Delta exports by 1000 cfs.
Sensitivity analysis results are reported for the ORB station, as a representative example (). For instance, increasing the Sacramento River flow by 10% results in decreases in SC at ORB, as predicted by both models, although there is some discrepancy in the magnitude of decrease during high-flow months. With the closure of the DCC gates, both ANNs and DSM2 predicted increases in SC (). The amount of the predicted increases in SC is similar between the two models. For a fixed decrease in exports of 1000 cfs, the response for ANNs and DSM2 is quite similar. In general, the sensitivity test suggests a reasonable (although not exact) response to these perturbations. Furthermore, the sensitivity test helps provide an understanding of the strengths and limitations of the ANN emulation approach for this particular application.
Figure 2. Different salinity characteristics of Delta source waters in terms of relative composition as well as total dissolved solids: (top) seawater – predominantly sodium and chloride; (middle) Sacramento River – predominantly bicarbonate; and (bottom) San Joaquin River – characterized by a homogenous blend of minerals, including a significant sulphate fraction resulting from agricultural drainage.
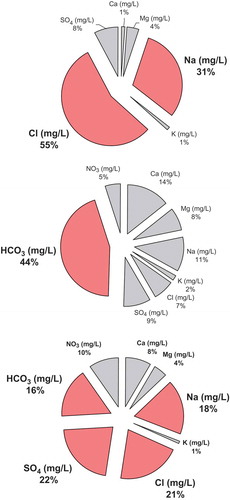
Figure 3. Schematic layout of the 1D Delta Simulation Model (DSM2) domain, showing the channels (black lines) and nodes (black circles). The (red) dots identify the 17 pre-defined hydrodynamic model emulator output locations (as itemized in ).
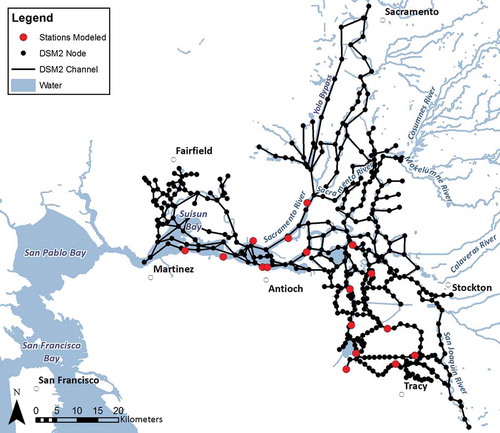
Figure 4. Conceptual representation of fingerprinting of chemical constituents in the Delta, aiming to assess the contributions of individual sources at an output location.
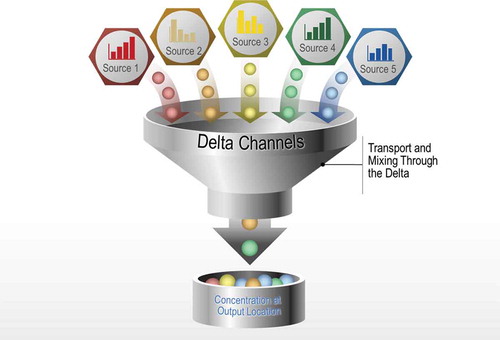
Figure 5. Conceptual framework of DSM2 emulator. Key inputs are freshwater inflows to the Delta, exports of water outside the Delta, downstream tidal stage at Martinez, net channel depletions from Delta islands, and the status of flow control structures (gates and barriers) used to manage interior Delta flows (see ). This is used to compute the volumetric contribution and water quality at a location “X”.
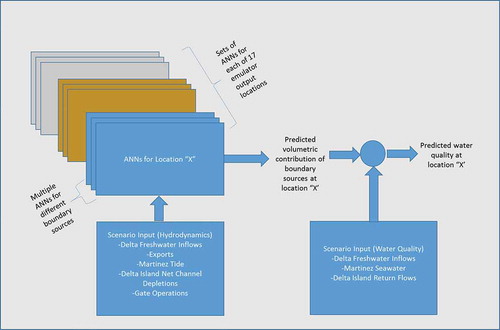
Figure 6. ANN training approach. The same input scenarios () were provided as input to the DSM2 model and the ANN. Multiple ANNs were trained to represent different flows and locations, as explained in the text. Training involved fitting the ANN-calculated volumetric fingerprints to the DSM volumetric fingerprint.
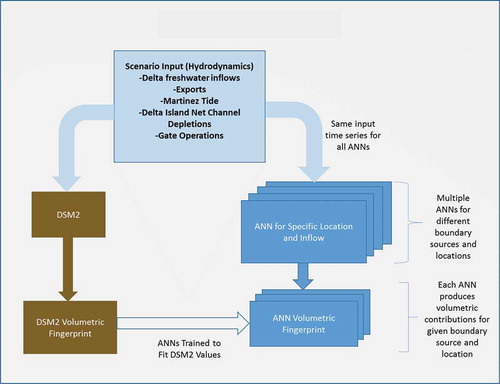
Figure 7. Comparison of volumetric contribution time series at the Old River at Bacon (ORB) output location as predicted by (top) the process-based model and (bottom) the emulation model. Sources are as defined in . SAC: Sacramento River at Freeport; SJR: San Joaquin River at Vernalis; MOK: Mokelumne River downstream of the Cosumnes River confluence; CAL: Calaveras River; Yolo: Yolo Bypass; Ag: Delta island return flows; and MTZ: seawater intrusion at the downstream tidal boundary at Martinez.
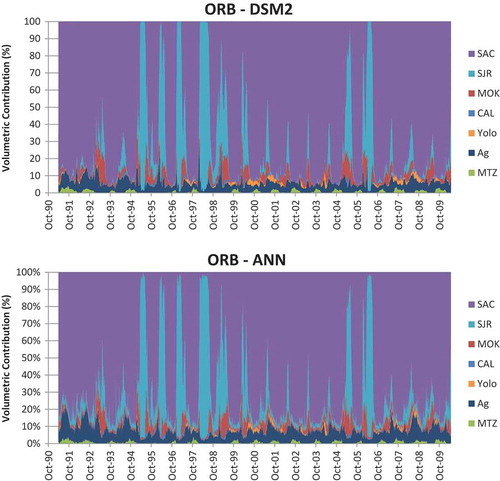
Figure 8. Comparison of specific conductance (SC) time series at the Old River at Bacon (ORB) station from the emulator (ANN), the DSM2 historical run ending in April 2010 which was part of the ANN training dataset (DSM2 original), and an extended DSM2 run for 2010–2012 (DSM2 ext) that was completely independent of the training dataset.
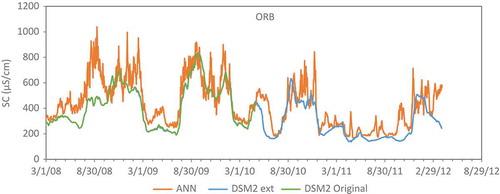
Figure 9. Evaluation of changes in process-based model output (DSM2) and emulator output (ANN) for three fixed input perturbations at ORB station: (top) Sacramento River flows increased by 10%, (middle) DCC gates closed, and (bottom) Delta exports decreased by 1000 cfs. The y-axis shows the corresponding change in specific conductance (in μS/cm).
Model run times and access
The primary reasons for exploring emulation in the case study were to provide easier access to the DSM2 tool and to reduce run times. For access, the ANNs were incorporated as functions, provided with a MATLAB redistributable version (no cost to users) that could be called through an Excel interface. The input data needs are those specified for the ANNs, and are considerably reduced from the original DSM2 model. The model run times were also considerably faster; for comparison on the same machine, a 20-year simulation of the DSM2 hydrodynamic and water quality model required 3 hours, as compared to about 1 minute for a single-location ANN run.
Discussion
This work, presented as a dynamic emulation case study, demonstrates the potential utility of ANN-based emulation (i.e. neuroemulation) to complex, real-world problems, specifically those related to the modelling of estuarine systems. No a priori definition of success is available for such a modelling effort. However, one may define success based on a variety of considerations, including the quality of model fit, the performance enhancement in terms of computer run times, the resources required for emulator development, and the credibility of the emulator relative to the original process-based model. These considerations are discussed below.
The emulator represents with high accuracy the source-receptor response of the underlying process model; it mimics the various source fingerprints over nearly two orders of magnitude at multiple locations across an estuarine gradient with a complexity of flow patterns. Simulation results match the observed behaviour of selected conservative constituents over a two-decade period. Given the spatial complexity incorporated in the process model, a large number of ANNs were necessary to emulate the model’s dynamic response at 17 pre-defined locations. While the model development was nontrivial, it was performed using off-the-shelf commercial software (Beale et al. Citation2011), thereby reducing overall risk and development time and accommodating replication in potential follow-up efforts.
The neuroemulator provides a significant enhancement of the run times compared to the process-based model; enhancements are even more significant when a user is interested in model responses at a small number of locations. Focus on a small number of locations is not an unusual model application, given the importance of water supply intakes and regulatory compliance points relative to other locations in the estuary. When used to evaluate response at a single station, the emulator run times are less than 1% of the time of the corresponding DSM2 run. The model emulation is characterized by a minor loss in fidelity; however, significant run-time improvements, coupled with a stand-alone interface focused on a subset of inputs, greatly enhance the access of the DSM2 model to the broader stakeholder community. Access to DSM2 results through the emulator can provide new opportunities for analysis, where the emulator is embedded within more complex modelling frameworks. We envision that this approach will find use among a broader community of users who want to explore the effects of individual boundary sources on specific locations, to understand relationships under varying conditions, and also to pre-screen scenarios before embarking on fully fledged DSM2 runs. The emulator could be embedded within operational modelling frameworks where rapid run times are needed, and for which no readily available tool exists for general locations within the Delta. The emulator could also be part of more complex frameworks, where the hydrological response is only one component of the analysis, such as those being envisioned for socio-hydrological analysis (Mount et al. Citation2016).
Although the emulator and applications described here suggest a valuable addition to the modelling toolkit for Delta water quality management, four important limitations are worthy of discussion. Important limitations associated with this approach include: (1) the case study’s limited focus on the MLP ANN approach; (2) the emulator’s application to fixed locations; (3) the emulator’s necessary linkage to a fixed physical configuration; and (4) the human resources required to develop the emulator. This case study applied the MLP approach because of its broad application in the literature and its prior success in other Delta water quality problems, as described previously. A comparative evaluation of multiple emulation approaches was precluded in the present scope by the scale and complexity of the original DSM2 model. However, the success and potential use of the present application may stimulate further research into alternative emulation approaches in future work. The emulator was developed for specific locations within the Delta, based on their importance in water quality management; if outputs at additional locations are required in the future, a new set of ANNs will need to be trained. To maximize the efficiency of the emulator development, it is therefore important that careful thought be given in advance to the output locations that are to be emulated. A further limitation of this work is that it is closely tied to the calibration and channel configuration in the original process-based model. Any changes in model parameters and channel geometry or connectivity are not represented mechanistically; thus, emulation of alternative physical configurations requires additional runs of the original process-based model and re-training of the ANNs. This is a considerable effort, and for this reason, emulator development is only practical where the original model has achieved certain stability in its calibration, as was the case with the present DSM2 application. Finally, although we emphasize the efficiency enhancement of the emulator relative to the original model from the standpoint of execution times, it is important to note the considerable analyst effort that is needed for the development and validation of the emulator. This effort is justified only when there is a sufficiently broad user base that will benefit from the efficiency enhancement.
Black box approaches, such as this neuroemulator, are inherently difficult to validate definitively, except through a comprehensive testing approach. Based on the types of tests presented here, the emulator appears to provide a reasonable response to changes in specific inputs, although in some cases there are apparent differences between the process-based model response and the emulator response. No emulator can be expected to fully replicate a complex model, and in the experience of the authors, the minor loss of fidelity is compensated by the significant improvement in run-time efficiency; the simplification of inputs that allows a much larger user base to apply the model; the ability to perform inverse model runs, where the management actions to obtain a desired water quality can be explored efficiently; and the potential of incorporating the emulator within a larger modelling framework that considers drivers besides physical hydrology, a direction being increasingly adopted through the field of socio-hydrology.
Sample output
Download MS Excel (699.4 KB)Sample input
Download MS Excel (707.8 KB)Acknowledgements
The authors wish to thank Deanna Sereno (Contra Costa Water District) for her review of an earlier version of the emulation model described in this paper, and Ms Carrie Munill for preparing and . We appreciate the constructive review comments of K. W. Chau, S. N. Londhe and Associate Editor, Andreas Efstratiadis.
Disclosure statement
No potential conflict of interest was reported by the authors.
Supplementary material
Supplementary data for this article can be accessed here.
Additional information
Funding
Related Research Data
References
- Abrahart, R.J., Mount, N.J., and Shamseldin, A.Y., 2012a. Neuroemulation: definition and key benefits for water resources research. Hydrological Sciences Journal, 57 (3), 407–423. doi:10.1080/02626667.2012.658401
- Abrahart, R.J., et al., 2012b. Two decades of anarchy? Emerging themes and outstanding challenges for neural network river forecasting. Progress in Physical Geography, 36 (4), 480–513. doi:10.1177/0309133312444943
- Achete, F.M., et al., 2015. A 2-D process-based model for suspended sediment dynamics: a first step towards ecological modeling. Hydrology and Earth System Sciences, 19 (6), 2837–2857. doi:10.5194/hess-19-2837-2015
- Anderson, J., 2002. DSM2 fingerprinting methodology, chapter 14 in methodology for flow and salinity estimates in the Sacramento – San Joaquin Delta and Suisun Marsh. 23rd Annual Progress Report to the State Water Resources Control Board. Available from: http://baydeltaoffice.water.ca.gov/modeling/deltamodeling/delta/reports/annrpt/2002/2002Ch14.pdf [Accessed 8 Aug 2017].
- Anderson, J. and Wilde, J., 2005. Fingerprinting: clarifications and recent applications, chapter 6 in methodology for flow and salinity estimates in the Sacramento-San Joaquin Delta and Suisun Marsh. 26th Annual Progress Report to the State Water Resources Control Board. Available from: http://baydeltaoffice.water.ca.gov/modeling/deltamodeling/delta/reports/annrpt/2005/2005.pdf [Accessed 8 Aug 2017].
- Andrews, S.W., Gross, E.S., and Hutton, P.H., 2017. Modeling salt intrusion in the San Francisco estuary prior to anthropogenic influence. Continental Shelf Research, 146, 58–81. doi:10.1016/j.csr.2017.07.010
- Beale, M.H., Hagan, M.T., and Demuth, H.B., 2011. Neural network toolbox. Natick, MA: Mathworks Inc.
- California Department of Water Resources (CDWR), 1998. Methodology for flow and salinity estimates in the Sacramento-San Joaquin Delta and Suisun Marsh. 19th Annual Progress Report to the State Water Resources Control Board. Available from: http://baydeltaoffice.water.ca.gov/modeling/deltamodeling/delta/reports/annrpt/1998/1998.pdf [Accessed 1 Apr 2016].
- California Department of Water Resources (CDWR), 2017. Delta Simulation Model II – DSM2. Available from: http://baydeltaoffice.water.ca.gov/modeling/deltamodeling/models/dsm2/dsm2.cfm [Accessed 1 Aug 2017].
- Carnevale, C., et al., 2012. Surrogate models to compute optimal air quality planning policies at a regional scale. Environmental Modelling and Software, 34, 44–50. doi:10.1016/j.envsoft.2011.04.007
- Castelletti, A., et al., 2012. A general framework for dynamic emulation modelling in environmental problems. Environmental Modelling and Software, 34, 5–18. doi:10.1016/j.envsoft.2012.01.002
- Castruccio, S., et al., 2014. Statistical emulation of climate model projections based on precomputed GCM runs. Journal of Climate, 27 (5), 1829–1844. doi:10.1175/JCLI-D-13-00099.1
- Chen, L. and Roy, S.B., 2014. Delta turbidity ANN model (DASM-T) development using DSM2: phase 3 results. Final Report to Metropolitan Water District of Southern California. Available from: http://www.baydeltalive.com/docs/10050 [Accessed 8 Aug 2017].
- Chen, L. and Roy, S.B., 2015. Generalized delta conservative constituent modeling using artificial neural networks. Final Report to Metropolitan Water District of Southern California. Available from: http://www.baydeltalive.com/docs/10005 [Accessed 8 Aug 2017].
- Chen, W.H., Haunschild, K., and Lund, J.R., 2010. Current and long-term effects of delta water quality on drinking water treatment costs from disinfection by-product formation. San Francisco Estuary & Watershed Science, 8, 3. doi:10.15447/sfews.2010v8iss3art4
- Chen, X.Y., Chau, K.W., and Busari, A.O., 2015. A comparative study of population-based optimization algorithms for downstream river flow forecasting by a hybrid neural network model. Engineering Applications of Artificial Intelligence, 46, 258–268. doi:10.1016/j.engappai.2015.09.010
- Chow, A.T., et al., 2008. Relationships between specific ultraviolet absorbance and trihalomethane precursors of different carbon sources. Journal of Water Supply: Research and Technology-AQUA, 57 (7), 471–480. doi:10.2166/AQUA.2008.064
- Cigizoglu, H.K., 2005. Application of generalized regression neural networks to intermittent flow forecasting and estimation. Journal of Hydrologic Engineering, 10 (4), 336–341. doi:10.1061/(ASCE)1084-0699(2005)10:4(336)
- Delta Plan, 2013. Published by the Delta Stewardship Council. Available from: http://deltacouncil.ca.gov/delta-plan-0 [Accessed 11 Jul 2017].
- Deverel, S.J., Leighton, D.A., and Finlay, M.R., 2007, Processes affecting agricultural drainwater quality and organic carbon loads in California’s Sacramento-San Joaquin Delta. San Francisco Estuary & Watershed Science, 5(2). Article 2. doi:10.15447/sfews
- Di Toro, D.M., O’Connor, D.J., and Thomann, R.V., 1971. A dynamic model of the phytoplankton population in the Sacramento San Joaquin Delta. Advancement Chemical Series, 106, 131–180.
- Finch, R., 2014. Quantitative calibration of DSM2, chapter 2 in methodology for flow and salinity estimates in the Sacramento-San Joaquin Delta and Suisun Marsh. 35th Annual Progress Report to the State Water Resources Control Board. Available from: http://baydeltaoffice.water.ca.gov/modeling/deltamodeling/AR2014/Method_2014_Ch2.pdf [Accessed 8 Aug 2017].
- Finch, R. and Sandhu, N., 1995. Artificial neural networks with application to the Sacramento – San Joaquin Delta. California Department of Water Resources, Delta Modeling Section, Division of Planning. Available from: http://baydeltaoffice.water.ca.gov/modeling/deltamodeling/models/ann/ann-delta1.pdf [Accessed 8 Aug 2017].
- Hutton, P., 2006. Validation of DSM2 volumetric fingerprints using grab sample mineral data. Power point presentation at CWEMF annual meeting, March 2006. Available from: http://www.cwemf.org/Asilomar/PaulHuttonPresentation.pdf [Accessed 8 Aug 2017].
- Hutton, P.H., et al., 2015. Nine decades of salinity observations in the San Francisco Bay and Delta: modeling and trend evaluation. ASCE Journal of Water Resources Planning and Management, 04015069. doi:10.1061/(ASCE)WR.1943-5452.0000617
- Hutton, P.H. and Chung, F.I., 1994. Bromine distribution factors in THM formation. ASCE Journal of Water Resources Planning Management – ASCE, 120 (1), 1–16. doi:10.1061/(ASCE)0733-9496(1994)120:1(1)
- Hutton, P.H., Mahadevan, N., and Chung, F.I., 1996. Simulating DBP precursor transport in Sacramento Delta. In: Proceedings 1996 North American Water and Environment Congress, ASCE, C.T. Bathala, Ed.
- Krasner, S.W., et al., 2006. Occurrence of a new generation of disinfection byproducts. Environmental Science and Technology, 40 (23), 7175–7185. doi:10.1021/es060353j
- Lee, L.A., et al., 2011. Emulation of a complex global aerosol model to quantify sensitivity to uncertain parameters. Atmospheric Chemistry and Physics, 11 (23), 12253–12273. doi:10.5194/acp-11-12253-2011
- Liu, L., and Sandhu, N., 2012. DSM2 version 8.1 Recalibration. Chapter 3 in: methodology for flow and salinity estimates in the Sacramento-San Joaquin Delta and Suisun Marsh. 33rd Annual Progress Report to the State Water Resources Control Board. Available from: http://baydeltaoffice.water.ca.gov/modeling/deltamodeling/AR2012/Chapter%203_2012_Web.pdf [Accessed 8 Aug 2017].
- Londhe, S.N. and Deo, M.C., 2003. Wave tranquility studies using neural networks. Marine Structures, 16 (6), 419–436. doi:10.1016/j.marstruc.2003.09.001
- Luoma, S.N., et al., 2015. Challenges facing the Sacramento-San Joaquin Delta: complex, chaotic, or simply cantankerous? San Francisco Estuary and Watershed Science, 13, 3. doi:10.15447/sfews.2015v13iss3art7
- MacWilliams, M.L., et al., 2015. Three-dimensional modelling of hydrodynamics and salinity in the San Francisco estuary: an evaluation of model accuracy, X2, and the low–salinity zone. San Francisco Estuary and Watershed Science, 13, 1. doi:10.15447/sfews.2015v13iss1art2
- Maier, H.R., et al., 2010. Methods used for the development of neural networks for the prediction of water resource variables in river systems: current status and future directions. Environmental Modelling and Software, 25 (8), 891–909. doi:10.1016/j.envsoft.2010.02.003
- Martyr-Koller, R.C., et al., 2017. Application of an unstructured 3D finite volume numerical model to flows and salinity dynamics in the San Francisco Bay-Delta. Estuarine, Coastal and Shelf Science, 192, 86–107. doi:10.1016/j.ecss.2017.04.024
- Minns, A.W. and Hall, M.J., 1996. Artificial neural networks as rainfall–runoff models. Hydrological Sciences Journal, 41 (3), 399–417. doi:10.1080/02626669609491511
- Mount, N.J., et al., 2016. Data-driven modelling approaches for socio-hydrology: opportunities and challenges within the Panta Rhei Science Plan. Hydrological Sciences Journal, 61 (7), 1192–1208.
- Moyle, P.B., et al., 2016. Delta Smelt: life history and decline of a once-abundant species in the San Francisco Estuary. San Francisco Estuary and Watershed Science, 14, 2. doi:10.15447/sfews
- Municipal Water Quality Investigations (MWQI) Program, 2017. Drinking water quality. Available from: http://www.water.ca.gov/waterquality/drinkingwater/rtdf_sites_constit.cfm [Accessed 10 Jul 2017].
- MWH, 2012. Validation of DSM2 QUAL for simulation of various cations and anions. Final Report prepared for Metropolitan Water District of Southern California. Available from: http://www.baydeltalive.com/docs/10092 [Accessed 8 Aug 2017].
- Nobriga, M.L. and Rosenfield, J.A., 2016. Population dynamics of an estuarine forage fish: disaggregating forces driving long-term decline of Longfin Smelt in California’s San Francisco Estuary. Transactions of the American Fisheries Society, 145 (1), 44–58. doi:10.1080/00028487.2015.1100136
- Norgaard, R.B., Kallis, G., and Kiparsky, M., 2009. Collectively engaging complex socio-ecological systems: re-envisioning science, governance, and the California delta. Environmental Science & Policy, 12 (6), 644–652. doi:10.1016/j.envsci.2008.10.004
- Orlob, G.T. and Shubinski, R.P. 1969. Water quality modelling of estuaries. In: Proc. IAHS Int. Conf. on Hydrology of Deltas.
- Pandey, G. 2001. Simulation of historical DOC and UVA conditions in the delta. Chapter 3 in: methodology for flow and salinity estimates in the Sacramento-San Joaquin Delta and Suisun Marsh. 22nd Annual Progress Report to the State Water Resources Control Board. Available from: http://baydeltaoffice.water.ca.gov/modeling/deltamodeling/delta/reports/annrpt/2001/2001Ch3.pdf [Accessed 7 Aug 2017].
- Rath, J.S., et al., 2017. A hybrid empirical – Bayesian artificial neural network model of salinity in the San Francisco Bay – delta estuary. Environmental Modelling and Software, 93, 193–208. doi:10.1016/j.envsoft.2017.03.022
- Razavi, S., Tolson, B.A., and Burn, D.H., 2012a. Numerical assessment of metamodelling strategies in computationally intensive optimization. Environmental Modelling and Software, 34, 67–86. doi:10.1016/j.envsoft.2011.09.010
- Razavi, S., Tolson, B.A., and Burn, D.H., 2012b. Review of surrogate modeling in water resources. Water Resources Research, 48, 7. doi:10.1029/2011WR011527
- Roy, S.B., et al., 2006. Conceptual model for organic carbon in the Central Valley and Sacramento-San Joaquin Delta. Report prepared for the US Environmental Protection Agency, Region IX and the Central Valley Drinking Water Policy Workgroup. Available from: http://www.waterboards.ca.gov/centralvalley/water_issues/drinking_water_policy/organic_carbon/cover_toc_es.pdf [ Accessed 19 Jul 2017].
- Sandhu, N., Wilson, D., and Finch, R., 1999. Modelling flow-salinity relationships in the Sacramento – San Joaquin Delta using artificial neural networks. Technical Information Record OSP-99-1. Sacramento, CA: California Department of Water Resources.
- Seneviratne, S., Wu, S., and Liang, Y., 2008. Impacts of sea level rise and amplitude change on Delta operations. Chapter 3 in: methodology for flow and salinity estimates in the Sacramento-San Joaquin Delta and Suisun Marsh. 29th Annual Progress Report to the State Water Resources Control Board. Available from: http://baydeltaoffice.water.ca.gov/modeling/deltamodeling/AR2008/2008_Annual_Report_Final.pdf [Accessed 7 Aug 2017].
- Sun, A.Y., Miranda, R.M., and Xu, X., 2015. Development of multi-metamodels to support surface water quality management and decision making. Environmental Earth Sciences, 73 (1), 423–434. doi:10.1007/s12665-014-3448-6
- Villa-Vialaneix, N., et al., 2012. A comparison of eight metamodeling techniques for the simulation of N 2 O fluxes and N leaching from corn crops. Environmental Modelling and Software, 34, 51–66. doi:10.1016/j.envsoft.2011.05.003
- Wilby, R.L., Abrahart, R.J., and Dawson, C.W., 2003. Detection of conceptual model rainfall–runoff processes inside an artificial neural network. Hydrological Sciences Journal, 48 (2), 163–181. doi:10.1623/hysj.48.2.163.44699
- Wu, C.L., Chau, K.W., and Fan, C., 2010. Prediction of rainfall time series using modular artificial neural networks coupled with data-preprocessing techniques. Journal of Hydrology, 389 (1), 146–167. doi:10.1016/j.jhydrol.2010.05.040
- Wu, W., Dandy, G.C., and Maier, H.R., 2014. Protocol for developing ANN models and its application to the assessment of the quality of the ANN model development process in drinking water quality modelling. Environmental Modelling and Software, 54, 108–127. doi:10.1016/j.envsoft.2013.12.016
- Zhang, X., Srinivasan, R., and Van Liew, M., 2009. Approximating SWAT model using artificial neural network and support vector machine1. JAWRA Journal of the American Water Resources Association, 45 (2), 460–474. doi:10.1111/jawr.2009.45.issue-2
Appendix
Table A1. Comparison of bromide estimated from volumetric contribution simulated by ANN and DSM2.
Table A2. Comparison of DOC estimated from volumetric contribution simulated by ANN and DSM2.