
ABSTRACT
Identification of factors controlling sediment dynamics under natural flow regimes can establish a baseline for quantifying effects of present day hydrological alteration and future climate change on sediment delivery and associated flooding. The process-based INCA-Sediment model was used to simulate Ganga River sediment transport under baseline conditions and to quantify possible future changes using three contrasting climate scenarios. Construction of barrages and canals has significantly altered natural flow regimes, with profound consequences for sediment transport. Projected increases in future monsoonal precipitation will lead to higher peak flows, increasing flood frequency and greater water availability. Increased groundwater recharge during monsoon periods and greater rates of evaporation due to increased temperature complicate projections of water availability in non-monsoon periods. Rainfall and land surface interaction in high-relief areas drive uncertainties in Upper Ganga sediment loads. However, higher monsoonal peak flows will increase erosion and sediment delivery in western and lower reaches.
Editor A. Castellarin Associate editor N. Ilich
1 Introduction
Hydrological and sediment dynamics of tropical rivers is an important research area (Subramanian Citation1979, Chakrapani and Subramanian Citation1993, Kale et al. Citation1994, Dettinger and Diaz Citation2000, Thorne Citation2002, Latrubesse et al. Citation2005). Due to the combination of high population (about 665 million people), high dependency on agriculture and flood risk, the Ganga basin is seen as one of the most vulnerable areas of the world in terms of climate change (Maplecroft Citation2011). However, there are significant knowledge gaps in the understanding of hydrology and sediment flux in the Ganga basin, which is an epicentre of fluvial disasters (Wells and Dorr Citation1987, Sinha and Jain Citation1998, Sinha et al. Citation2008, Sinha Citation2009). This study has been designed to advance our understanding and supplement the existing knowledge of the hydrological and sediment transport processes of large river systems such as the Ganga. For this purpose, we analysed the available observed flow and sediment data and then set up a semi-distributed, process-based model to simulate the fluvial dynamics of the Ganga system and to project future flows and sediment dynamics for the middle and the end of this century. There is an extreme paucity of information on the fluvial characteristics of the individual reaches of the Ganga system, and there is no model set-up capturing the reach-scale sediment dynamics of this critical river basin. This study aims to provide first-hand information regarding the prediction of sediment load of the Ganga for the middle and end of this century.
Watershed hydrology and river water quality models are widely regarded as important modern tools for watershed management for both research and operational programmes (Quilbé and Rousseau Citation2007). A number of sediment transport models have been developed for small-scale or event-based erosional process (Knisel Citation1980, Williams Citation1980, Borah Citation1989, Young et al. Citation1995). Models that are widely applicable in space and time are data intensive or designed for ungauged basins. The application of these models becomes challenging in basins such as the Ganga because of its large size, high spatiotemporal variability and lack of high-quality data. Earlier attempts to simulate sediment yield for the entire Ganga have not been satisfactory (World Bank Citation2012) and there has been very little process-based research in the Ganga basin with respect to sediment modelling. This is despite the fact that extensive hinterland and channel erosion occurs throughout the Ganga basin. In this study, we modelled sediment yield in the Ganga River catchment and its response in the river system using a process-based, semi-distributed model, the Integrated Catchment Model for Phosphorus and Sediments (INCA-P/Sed version 1.4.8). The semi-distributed nature of the INCA model minimizes its data requirement and makes it ideal for use in an Indian context. We considered potential future changes in climate to assess future sediment delivery in the Ganga River system.
2 The Ganga River system: the sediment dispersal system
Hydrology in the Ganga River system manifests a complex interplay of monsoon runoff, groundwater resources, glacier melt and snowmelt. Along with the Brahmaputra and the Meghna rivers, the Ganga forms one of the greatest deltas in the world which is highly vulnerable to climate change. Supporting a huge population, the Ganga plains () are drained by numerous Himalayan rivers from the north, including the Yamuna, Ramganga, Gomati, Ghagara, Rapti, Gandak, Kosi, Burhi Gandak, Baghmati, Mahananda and Ghagara. Rivers draining into the Ganga from the south include the Chambal, Sind, Betwa, Ken, Tons, Sone, Damodar and Kasai. Approximately 57% of the basin is devoted to agriculture, followed by 20% barren land, especially in the eastern and western lowlands, 15.2% forests, 6.6% grasslands, and nearly 1% is covered by urban areas (). The Ganga is the lifeline of a major portion of the Indian subcontinent and climate change in this critical basin is likely to have an enormous impact on food production, water availability (both surface water and groundwater), sediment transport and downstream flooding. There are several dams, barrages and canals on the Ganga that affect the flow and sediment characteristics of the system. provides a schematic representation of the major human-imposed interventions on the Ganga system (their specifications and uses are enumerated in the Supplementary material, Table S1). The manmade interventions influence the natural flow of water and sediment in the river leading to episodic events such as river migration and avulsion. The presence of interventions across the river hinders the free movement of sediments to downstream reaches, leading to siltation of the upstream reaches and tremendous bank erosion in the downstream reaches due to release of water at high velocities. Also, a reservoir upstream of a dam significantly reduces the settling velocity due to tranquil flow conditions, which accelerate siltation in the reservoir and the river bed. The abstraction of water from the river through canals also reduces the flows, and this in turn influences the sediment carrying capacity.
Figure 1. The Ganga basin and major drainage lines. Major gauging stations, dams and barrages along the trunk rivers are shown and sub-catchment divisions are marked. Average annual rainfall (in mm) is marked zone-wise. CWC gauge locations (red diamonds), from top to bottom: Uttarkashi, Devprayag, Rishikesh, Garhmukteshwar, Kachlabridge, Fatehgarh, Ankinghat, Kanpur, Bhitaura, Allahabad, Mirzapur, Varanasi, Farakka. Interventions (yellow circles), from top to bottom: Maneri Dam, Tehri Dam, Rishikesh Barrage, Bhimgauda Barrage, Madhya Ganga Barrage, Narora Barrage, Kanpur Barrage, Palmer Barrage, Farakka Barrage. G: Ganga trunk stream, Y: Yamuna, C: Chambal, Kr: Karnali, Gh: Ghagara, Ko: Kosi, S: Sone, UG: Upper Gandaki, Bg: Bagmati, R: Rihand, K: Koel, Ka: Kasai, My: Mayurakshi, T: Tons, M: Mahananda.
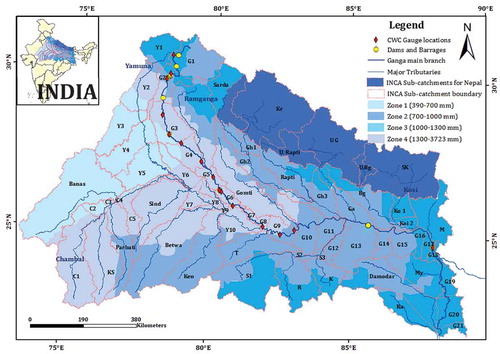
Figure 2. Land-use–land-cover map for the Ganga basin in India and Nepal. A major part of the alluvial part of the basin is covered by agricultural land, while the high-altitude Himalayan part is dominated by forests.
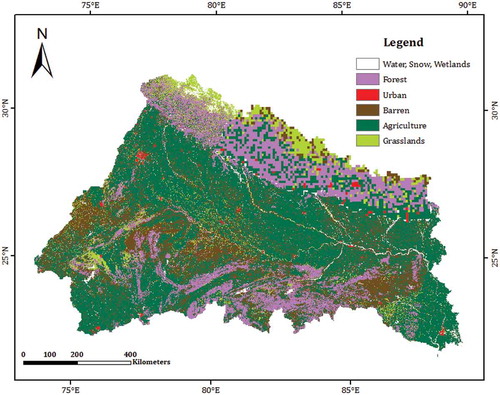
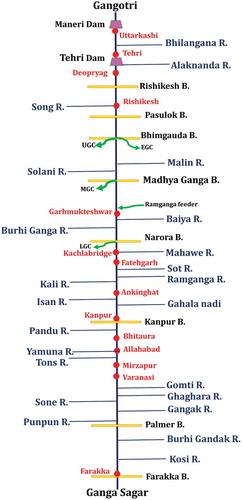
Figure 3. Schematic diagram showing the Ganga main channel and its major tributaries, the gauge stations (red circles) and major interventions (dams, barrages and canals). Note: the diagram is not to scale.
The Ganga River system ranks 18th worldwide in terms of basin area and second in terms of total suspended load (Milliman and Syvitski Citation1992, Hovius Citation1998). The Himalayas are the major supplier of sediments to the Ganga plain but the southern peninsular rivers have also contributed significantly to alluvial fills in the geological past (Sinha and Sarkar Citation2009). The Himalayan rivers are characterized by higher flows, higher basin relief, larger catchment area, greater basin instability involving landslides and earthquakes, and younger geological formations as compared to the peninsular rivers. In addition, they also differ in terms of climatic conditions, degree of urbanization and in the use of water resources, which affect the magnitude and nature of sediment transport (Subramanian Citation1996). Sinha and Friend (Citation1994) categorized the Himalayan River system into three distinct classes on the basis of the source area: mountain-fed, foothills-fed and plains-fed river systems. The mountain-fed rivers (e.g. Kosi, Gandak) derive their water and sediments from the High Himalayas and they have a much larger hinterland compared to the alluvial part. The foothills-fed (e.g. Baghmati, Rapti) and plains-fed rivers (e.g. Burhi Gandak, Gomti) drain the inter-fluve region between the fans and derive sediments partly from the foothills but mostly within the plains. The plains-fed rivers cause rigorous and repeated reworking of the sediments deposited by the mountain-fed or foothills-fed rivers. In the Himalayan region, natural hazards such as floods, landslides (triggered by heavy monsoon and tectonic activity) and glacial lake outburst floods (GLOFs) are frequent and they contribute large volumes of sediments. Human activity has significantly altered the unregulated flow characteristics of the Ganga River system. Hossain (Citation1991) observed that dams on the Ganga have decreased riverine sediment loads, whereas increased erosion in the mountains of Nepal due to deforestation has increased sediment loads of the confluent Brahmaputra.
The Ganga River is one of the world’s largest sediment dispersal systems, with a channel length of 2974 km and a basin area of 965 936 km2, transporting an extremely high suspended sediment load of 356 × 106 t year−1. The Ganga and Brahmaputra rivers yield approximately 109 t year−1 of suspended sediment at a point in Bangladesh about 200 km from the ocean, which is perhaps the highest suspended load carried by any river system in the world (Wasson Citation2003). Abbas and Subramanian (Citation1984) estimated the sediment load of the Ganga at Farakka to be nearly 7.29 × 10⁸ t year−1 of which 328 × 106 t year−1 is transported down the Hooghly River.
Modelling in the Ganga system has so far focused primarily on climate change impacts on hydrology and water quality (Bharati et al. Citation2011, Gosain et al. Citation2011, World Bank, Citation2012, Whitehead et al. Citation2015a, Jin et al. Citation2015), flood forecasting in Bangladesh (Hopson and Webster Citation2010), environmental flow requirements (Tare et al. Citation2017) and policy issues including investigation of the National River Linking Project and Ganga Action Plan on river water quantity and quality (Lacy Citation2006, Gourdji et al. Citation2008). Despite the importance of the Ganga River system and the significant amount of modelling activities undertaken till now, little has been done to model the basin-scale sediment dynamics. A number of researchers have satisfactorily modelled the sediment dynamics of smaller sub-catchments (Singh et al. Citation2006, Citation2011, Pandey et al. Citation2008). Gosain et al. (Citation2011) modelled the percentage changes in sediment erosion during the middle and end of the century, but as the model was not calibrated, the reliability of the results is questionable. Darby et al. (Citation2015) analysed the influence of anthropogenic climate change on future sediment delivery to the Ganga–Brahmaputra–Meghna (GBM) Delta using a lumped catchment modelling approach. They suggested that sediment loads in the Ganga River would increase by 16–18% in the middle part of the 21st century and by 34–37% by the end of the 21st century compared to the baseline (1981–2000) period. The overall input of sediments into the GBM Delta is expected to increase significantly, but the authors also noted large uncertainties in their estimates attributed mainly to uncertainties in the climate projections as well as uncertain future human impacts in the catchment.
3 Data, methods and modelling approach
3.1 Hydrological data and analysis
In tropical areas, the primary controls on the landscape are known to be climate, tectonics, lithology and human-induced changes such as interventions, abstraction and river engineering structures that are constructed across the river system. lists the datasets that were procured from various government agencies. The daily flow and 10-day or monthly aggregated sediment data obtained from the Central Water Commission, India (CWC) were analysed for several stations along the Ganga River (, ). Consistency checks were performed to remove inconsistent data identified from daily hydrographs and the double mass curve technique. Flow data were available for stations from the Upper Ganga: Uttarkashi, Tehri, Devprayag and Rishikesh; Middle Ganga: Garhmukteshwar, Kachlaridge, Fatehgarh, Ankinghat, Kanpur, Bhitaura, Allahabad, Mirzapur and Varanasi; and Lower Ganga: Farakka (). Sediment data were available for seven stations located on the Ganga mainstream, namely, Garhmukteshwar, Kachlabridge, Fatehgarh, Ankinghat, Kanpur, Bhitaura and Farakka (). It should be noted that the data on flow diversions through canals and information on barrage operation policy were inaccessible.
Table 1. Dataset specification, source and purpose.
Table 2. Available observed data (from Central Water Commission, India).
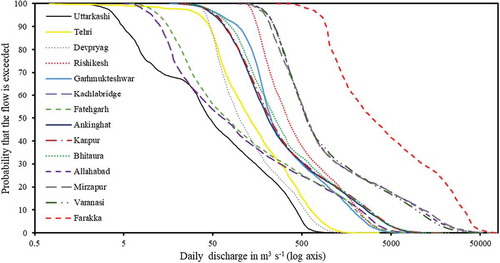
The flow–duration curve (FDC) is a cumulative frequency curve that shows the percentage time during which a particular discharge in a river is equalled or exceeded in a particular time frame. Flow characteristics of a stream are reflected in the FDC regardless of their sequence of occurrence (Whitehead et al. Citation2015b). Hence, the catchment characteristics, meteorological forcing and human impacts (anthropogenic land cover, interventions, abstractions and other disturbances) are all manifested in the FDC of a particular stream (Maheshwari et al. Citation1995, Vogel and Fennessey Citation1995).
Daily flow data were used for synthesis of the FDCs. Daily discharge for each station was arranged in descending order of magnitude and assigned a rank (1 to m). The percentage of the probability that a flow is exceeded is given by:
where Pp is the percentage probability that a given flow will be equalled or exceeded, m is the rank and N is the total number of data points. The results of flow–duration analysis are shown as a semi-logarithmic plot in which the horizontal axis (discharge) is plotted on a logarithmic scale and vertical axis (percentage of exceedence) is normal.
Further, we used the ratio of peak discharge (Qmax) to lean discharge (Qmin) to represent annual-scale discharge variability and the ratio of Qmax to average annual discharge (Qav) to quantify the flood magnitude of a river (Latrubesse et al. Citation2005).
3.2 INCA modelling
3.2.1 Physical principles
A dynamic, process-based, semi-distributed, medium-complexity model such as INCA can be a potential tool for predicting unregulated or natural flows and instream sediment loads of large and complex river systems. Initially, the INCA model was developed for hydrology, nitrate–nitrogen and ammonia (Whitehead et al. Citation1998) and phosphorus (Wade et al. Citation2002), models which have been successfully tested for the Ganga system (Jin et al. Citation2015, Whitehead et al. Citation2015c). The INCA model simulates flow and water quality and tracks the flow paths operating in both land and riverine phases (Lazar et al. Citation2010, Jackson-Blake et al. Citation2016). This version of the INCA model implements a series of first-order differential equations that account for the spatial and temporal complexities of the system. The sediment model links the terrestrial and aquatic components of catchments in terms of sediment generation and transport. As sediments in rivers are not only dependent on the flow conditions, but also on the drainage basin characteristics, sediment modelling studies are highly challenging. Young et al. (Citation1996) concluded that relatively low order models can easily simulate a complex system by capturing the dominant behavioural mechanisms, and this is the basis of the INCA philosophy. The INCA model is designed to work with a semi-distributed description of a river system and to account for reach lengths, rate coefficients, land use, velocity–flow relationships and varying input loads. The model requires an input of daily time series of precipitation, temperature, hydrologically effective rainfall and soil moisture deficit. The last two are calculated through another semi-distributed, rainfall–runoff model called PERSiST, specifically designed to provide input series for the INCA family of models (Futter et al. Citation2014). Model structure and equations are given in Jackson-Blake et al. (Citation2016) and described in the Supplementary material.
3.2.2 INCA-Sed set-up for the Ganga River system
For the INCA-Sed model set-up, the same scheme for reach and sub-catchment division was used as presented by Jin et al. (Citation2015) and Whitehead et al. (Citation2015c). The Ganga River was divided into 70 reaches based on key locations and availability of monitoring data. Watershed delineation was performed using the SRTM (Shuttle Radar Topographic Mission) digital elevation model (DEM) at 90 m resolution to identify sub-catchment areas and average slopes for each reach (). It should be noted that INCA simulates the flow and sediment processes at a sub-catchment/reach scale. Various catchment and reach characteristics, such as slope, river width, reach length and sub-catchment area, are introduced in INCA as an average for the particular sub-catchment/reach. Hence, a relatively higher reach division significantly increases the model resolution. The meteorological data for calibrating and running the model were obtained from the Indian Meteorological Department (IMD). The daily IMD point data for the Ganga catchment were interpolated on a 0.25° × 0.25° grid using the Theissen polygon method, which was further used for dividing the entire study area into four zones on the basis of increasing rainfall from west to east (). The IMD data were further processed through MATLAB and PERSiST models (Futter et al. Citation2015) to obtain daily time series of hydrologically effective rainfall and soil moisture deficit data. Land-use and land-cover maps for the Indian part of the Ganga basin were obtained from the National Remote Sensing Agency (NRSC) and for the Nepalese part from the Food and Agriculture Organization (FAO) website (). River width was calculated from Landsat images. The observed flow and suspended data required for model calibration were obtained from the CWC, India. The monitored data (), especially the sediment data were sparse and available only for the western Ganga plains. No sediment data were available for the Upper and eastern Ganga plains except for Farakka, which was taken as the catchment outlet. Flow and sediment characteristics of various reaches along the Ganga main channel are given in .
3.2.3 Model sensitivity analysis
Firstly, a general sensitivity analysis was employed on the INCA-Sed for the River Ganga (Spear and Hornberger Citation1980, Whitehead et al. Citation2015c, Bussi et al. Citation2016). On the basis of the sensitivity analysis, literature on previous applications of INCA and the modeller’s knowledge of the hydrological processes, the model was calibrated by adjusting its parameters. The land-phase parameters were adjusted on the basis of the land-use and land-cover (LULC) classification: urban, forest, grassland, barren and agriculture. The sub-catchment parameters were adjusted zone-wise to reduce the complexity involved in calibrating each of the 70 sub-catchments. Daily flows and sediment concentrations were estimated for each reach and sub-catchment. Calibrated model parameters are summarized in . The most influential land-phase parameters affecting sediment dynamics were: soil-type-dependent soil-splash erosion potential (ESP), soil-type-dependent flow erosion potential (EFL), and splash detachment scaling parameter (cx1); influential reach parameters included: shear velocity scaling factor (a7), entrainment scaling factor (a8), bank erosion scaling factor (a9), and bank erosion nonlinear coefficient (a10); and influential sub-catchment parameters included: flow erosion scaling factor (a1), flow erosion direct runoff threshold (a2), flow erosion nonlinear coefficient (a3), transport capacity scaling factor (a4), transport capacity direct runoff threshold (a5), and transport capacity nonlinear coefficient (a6).
Table 3. Flow and sediment characteristics of various reaches along the Ganga main channel (based on data compiled from Central Water Commission).
Table 4. Calibrated values for most influential flow and sediment parameters.
3.2.4 Climate scenarios
Three different scenarios were used for projecting future changes in flow and suspended sediment load. Model simulations used in this study were derived from the Special Report on Emissions Scenarios (SRES) A1B scenario developed by the Intergovernmental Panel on Climate Change (Third Assessment Report, AR3; IPCC Citation2001). In the IPCC Fifth Assessment Report (AR5; IPCC Citation2014), a new set of scenarios called Representative Concentration Pathways (RCPs) was used (Moss et al. Citation2010). The SRES A1B scenario lies between RCP6.0 and RCP8.5 with respect to the end of the 21st century projected temperature increases and atmospheric carbon dioxide concentrations (Rogelj et al. Citation2012). Further details of the description and validation of the regional climate model (RCM) can be found in Caesar et al. (Citation2015). The three climate change realizations were acquired from the 17-member set (Q0–Q16) from the Met Office Hadley Centre RCM, HadRM3P, for south Asia, which represents a range of possible future outcomes from the SRES A1B scenario. Three average climate datasets, namely Q0, Q8 and Q16, for time periods 1981–2000, 2041–2060 (2050s) and 2080–2099 (2090s) were selected, as summarized in , and described by Whitehead et al. (Citation2015c). Dataset Q0 has the same parameter values as those used in the standard HadCM3 coupled GCM (global climate model), and Q1–Q16 were arranged in order of increasing global climate sensitivity in the HadCM3 model. The high precipitation increases of 15, 22 and 33% for the Q0, Q8 and Q16 scenarios, respectively, by century end are quite significant as compared to the current rainfall pattern. These three scenarios are based on effective climate sensitivities: Q0 for 3.5°C, Q8 for 3.54°C and Q16 for 5.46°C.
Table 5. Climate scenarios from the Met Office Hadley Centre RCM (HadRM3P) for the Ganga basin.
4 Results and analysis
4.1 Hydrological characteristics
Hydrological characteristics were analysed using hydrographs (), flow–duration curves (), discharge variability (Qmax/Qmin) and flood magnitude (Qmax/Qav) statistics (see ). The most striking observation about the hydrographs in the Ganga River is their dependency on rainfall or the monsoonal pattern. Almost 80–90% of the rainfall takes place in the monsoon months of June, July, August and September, and this is clearly reflected in the hydrographs. From upstream to downstream, flow increases due to upstream runoff and tributary contributions. All stations experience peak flow in August except Allahabad, Mirzapur and Varanasi in the Middle Ganga system, which show similar flows in August and September reflecting an increase in rainfall from the western to eastern Ganga system (). From January to June, flow is low along all reaches, but after that, contrasting high flow behaviours are observed.
Figure 4. Hydrographs showing mean monthly variation using a 15-year dataset (1995–2009).
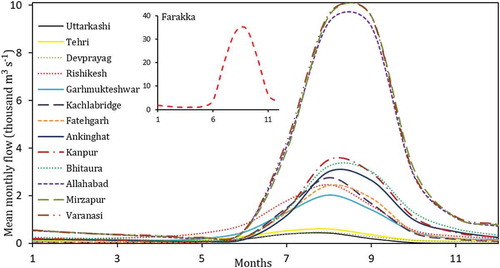
Figure 5. Flow duration curves (FDCs) for all the stations on the Ganga main channel. Note the variability in FDCs of different stations in upstream, midstream and downstream reaches in response to tributary influences and/or abstractions through barrages.
Based on the hydrograph analysis, the available stations can be categorized into three distinct categories. The first category includes stations of the Upper Ganga system (Tehri, Uttarkashi and Devprayag). Considerable inconsistency in flow at these stations is attributed to the presence of the hydro-electric dam at Tehri, with a reservoir capacity of around 4 km3. Devprayag, which is situated downstream of Tehri, should have relatively higher flows, but actually the ordinates of Devprayag are lower than those of Tehri.
The second category includes stations of the Upper-Middle Ganga system, namely Rishikesh, Garhmukteshwar, Kachlabridge, Fatehgarh, Ankinghat, Kanpur and Bhitaura. Large inconsistencies are observed here and may be attributed to the presence of an extensive canal network facilitating abstraction for irrigation, industrial and municipal purpose. Flow at Rishikesh is much higher than at Garhmukteshwar and is similar to Fatehgarh, although Rishikesh is upstream of Garhmukteshwar. Significant abstraction between Rishikesh and Garhmukteshwar through the Upper, eastern, and Middle Ganga canals could explain the anomaly. Another flow inconsistency exists between Kanpur and Bhitaura, which could be attributed to the Kanpur barrage.
Stations at Allahabad, Mirzapur and Varanasi, with similar and significantly higher flows, comprise the third category. All these stations are located downstream of the confluence of the Ganga with the Yamuna at Allahabad.
A clear demarcation of flow characteristics can be seen in the Upper and Middle Ganga reaches. The FDCs () for Uttarkashi, Tehri and Devprayag are very steep compared to other downstream stations. This shows that the flow is highly variable in the downstream reaches. In the Upper Ganga, slopes are very steep, and hence the catchment is extremely responsive to allow efficient transfer of water flux due to steep catchment slope and minimum tributary effect. As a result, the range of discharge variability is relatively small as compared to downstream stations.
In the next cluster, Rishikesh, Garhmukteshwar, Kachlabridge, Fatehgarh, Ankinghat, Kanpur and Bhitaura stations show greater variability in discharge as compared to the upstream stations. The steepest FDC at Rishikesh is followed by those for Garhmukteshwar, Kachlabridge, Fatehgarh, Ankinghat, Kanpur and Bhitaura (), where slopes decrease and more and more tributaries contribute to downstream flows.
Further downstream, the Middle Ganga stations, Allahbad, Mirzapur and Varanasi, show a very similar trend, with flow that varies from around 100 to 65 000 m3 s−1. Farakka, the lowermost station, experiences flows ranging from 300 to 75 000 m3 s−1.
In the Upper Ganga system, Uttarkashi shows the highest flow and flood magnitude variability (), while Bhagirathi is a glacial-fed perennial system. It is likely that the presence of the Tehri Dam reduces the flow variability at Tehri, Devprayag and Rishikesh. Further, the slopes in the Upper Ganga are steeper with narrow river valleys, and there are minimal abstractions compared to the lower reaches. This results in an efficient flow transport causing lower discharge variability and less overtopping of the banks as compared to the stations in the Middle Ganga. Garhmukteshwar, Kachlabridge and Fatehgarh experience remarkable flow variability (), which can be attributed to tributary influences and inconsistent barrage operation policy. Further downstream, slope reduces considerably, and river bank width increases (), resulting in large floodplains. Such a system seems to favour higher flood magnitude, as observed at Ankinghat, Kanpur, Bhitaura, Allahabad and Mirzapur.
4.2 Sediment transport characteristics
The proportion of flow and sediments in an alluvial channel governs its morphological characteristics. Any change in the water-to-sediment ratio throughout the channel alters its morphology significantly, leading to channel readjustment (Lane Citation1955, Schumm Citation1977, Ashmore Citation1982, Citation1991, Ferguson Citation1993, Jain and Sinha Citation2004, Brierley and Fryirs Citation2013, Wheaton et al. Citation2013, Lisenby and Fryirs Citation2016). The relationship between sediment concentration and discharge is linear at Garhmukteshwar, Fatehgarh and Kanpur (). At Ankinghat, the sediment concentration reaches a maximum value at bankfull discharge. Among all these stations, the Ganga is widest at Ankinghat () with the highest width to depth ratio, which makes the banks more susceptible to erosion and subsequent release of large quantities of wash load at a relatively lower stream power. It is likely that such high sediment supply leads to transport-limited behaviour of the river resulting in higher instream sediment concentration at high flows. A wide range of low-flow sediment concentrations are observed at Kachlabridge, Bhitaura and Farakka downstream of barrages.
Figure 6. Flow vs sediment concentration relationship at Garhmukteshwar, Fatehgarh, Kachlabridge, Ankinghat, Kanpur, Bhitaura and Farakka. Most stations show a linear relationship, albeit with large spread at some stations, such as Kachlabridge and Farakka, and this may be attributed to the barrages upstream.
4.3 INCA modelling results for present flow and sediment
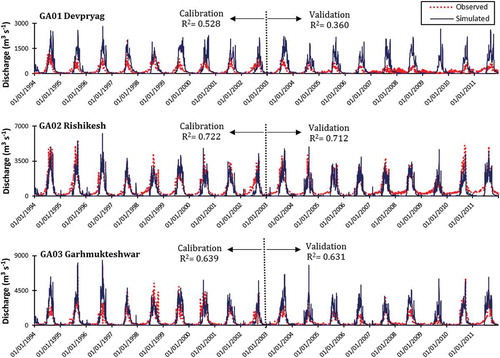
A general pattern in which simulated flows were higher than observations was seen at Devprayag, Rishikesh, Garhmukteshwar, Kachlabridge, Ankinghat, Kanpur and Farakka (). A considerable discrepancy is apparent in the observed flows from 2006 onwards at Devprayag, which coincides with the commencement of the Tehri Dam operation in 2006. The model output shows a good match with the observed flows at Rishikesh (GA02), with R2 values of 0.722 and 0.712 for calibration and validation, respectively. Satisfactory matches between simulated and observed flows were obtained at Garhmukteshwar, Kachlabridge, Ankinghat, Kanpur and Farakka. The effect of abstraction is apparent (simulated flows higher than the observed) at stations downstream of Rishikesh from where the canal system operates.
Figure 7. Simulated vs observed discharge for different stations in the Ganga basin.
shows daily simulated suspended sediment concentrations along with 10-day or monthly observed data at Garhmukteshwar, Kachlabridge, Ankinghat, Kanpur and Farakka. The INCA model is able to capture the seasonal variability in suspended sediment concentration quite well, although, in some cases, sediment concentrations are over-predicted or under-predicted. As stream power represents the force driving the sediments in a river, plots between observed and simulated stream power were made for further validation (). At both Kanpur and Farakka, the simulated stream power is greater than the observed due to the use of unregulated flow conditions in our modelling.
Figure 7. Continued.
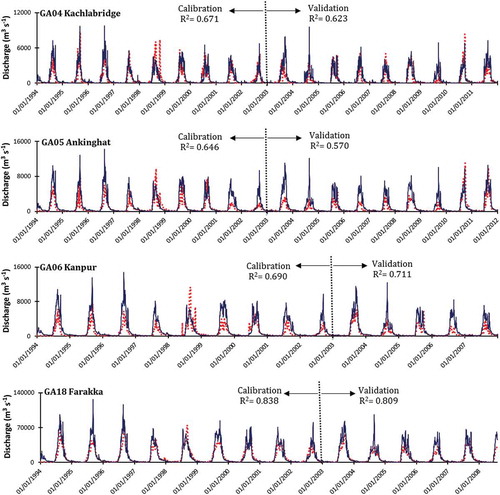
Figure 8. Simulated vs observed suspended sediment concentration (in mg/L) for different stations in the Ganga basin.
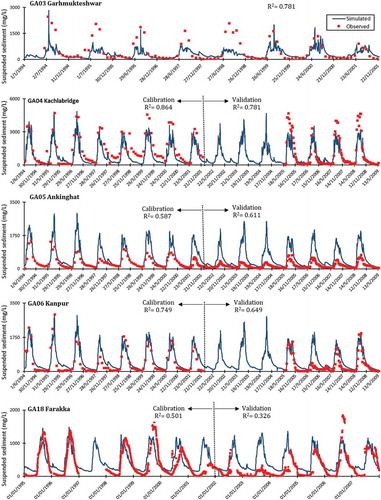
The simulated non-monsoon sediment concentrations fit very well the observations for all of the stations of the western Ganga plains. Satisfactory matches between observed and simulated data are obtained at Garhmukteshwar, Kachlabridge and Kanpur, with R2 values of 0.781, 0.864 and 0.749, respectively, for calibration, and 0.781 and 0.649 for validation at Kachlabridge and Kanpur, respectively (). However, the observed and simulated monsoon concentration peaks are different, especially at Ankinghat and Farakka. It should be noted that both of these stations are located between barrages. Ankinghat lies between Narora and Kanpur barrages and Farakka barrage is well known to have modified the natural flows. At Farakka, the simulated suspended sediment concentration is over-predicted for low-flow periods.
The INCA model calculated the total annual suspended sediment yield of 369 t km−2 year−1 at Farakka. The major contribution to instream sediment load was 57.1% from agricultural lands (covering 57.2% of the total area), followed by approximately 30% from the barren lands (20% of total area), 13.5% from the grasslands (6.6% of total area), nearly 1% from the forested landscape (15.2% of total area) and about 0.34% from urban areas (0.9% of total area).
4.4 INCA modelling results for climate change scenario
The calibrated INCA model was run with mid- and end-century data for three effective climate realizations: Q0, Q8 and Q16. The resultant projections for flow and suspended sediment at Farakka are discussed in detail below.
4.4.1. Climate projection at Farakka
The results for climate projections at Farakka suggest that both flows and suspended sediments will increase in the future for all the three scenarios ().
For the mid-century, flow is maximal for the Q0 scenario followed by the Q8 and Q16 scenarios. In contrast, for the end-century, flow is maximal for the Q8 scenario followed by the Q0 and Q16 scenarios. Peak flows are projected to increase significantly in monsoonal months, whereas not much change is expected during the lean period from January to May. The contrast between baseline and projected flows is highest for the Q16 scenario followed by the Q8 and Q0 scenarios. The rising limb of the hydrograph is steepest for the Q16 scenario due to the sudden jump in rainfall quantities from July to August as compared to the other two scenarios.
For the Q0 scenario, the 2050s and 2090s flows are almost similar until August. After that, a slight increase in 2090s flows is observed. For the Q8 scenario, projected flows for the 2050s are similar to baseline flows until July, and relatively higher differences are observed after that. The projected flows for the 2090s are distinctly higher than the baseline flows for the entire monsoon period. In the case of the Q16 scenario, both 2050s and 2090s flows are significantly higher than the baseline flows after June.
Our simulations suggest that instream sediment loads will also increase for all three scenarios, albeit with different trends. Projected sediment load in the 2090s is 35, 45 and 79% higher than the baseline for the Q0, Q8 and Q16 scenarios, respectively. In the 2050s, loads are expected to be 26, 10 and 40% higher for the three scenarios. However, the sediment concentration during the lean months is lower than that during the monsoon months. For the mid-century, the sediment load is maximum for the Q0 scenario, followed by the Q8 and Q16 scenarios, respectively. However, for the end-century, the load is maximum for the Q8 scenario followed by the Q0 and Q16 scenarios. For the three scenarios, the maximum contrast between the three timelines is observed for the Q16 scenario followed by the Q8 and Q0 scenarios, respectively, due to variation in temperature and rainfall between the three scenarios. During the lean period, maximum contrast between the three timelines is obtained for the Q8 scenario, followed by Q16 and negligible variation in the Q0 scenario. The rising limb of the sediment concentration plot is observed to be steepest for the Q16 scenario.
4.4.2 Reach-scale variability of flow and sediment load
At Garhmukteshwar, Kachlabridge, Ankinghat and Kanpur stations, increased flow and sediment load increase are projected for all stations except for Garhmukteshwar, which is an upstream station (). By the mid-century, the maximum increase in both flow and instream sediment load will be for the Q0 scenario followed by the Q8 and Q16 scenarios, respectively. In the end-century case, the maximum increase in both flow and instream sediment load will be for Q8 followed by Q0 and Q16.
Figure 9. Observed vs simulated (a, b) stream power and (c, d) sediment load at Kanpur (GA06) and Farakka (GA18).
Figure 10. Flow, instream sediment concentration and load under the climate change scenarios Q 0, Q8 and Q16 for baseline, 2050 and 2099 at Farakka.
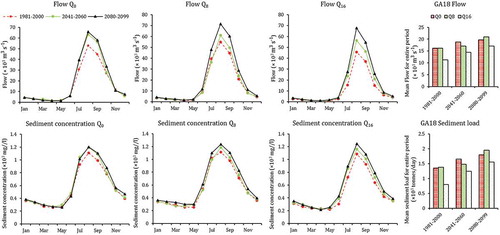
Figure 11. Spatial variability in predicting flow and sediment load at Garhmukteshwar (GA03), Kachlabridge (GA04), Ankinghat (GA05), Kanpur (GA06) and Farakka (GA18) for the baseline, 2050 and 2099 under Q0, Q8 and Q16 scenarios.
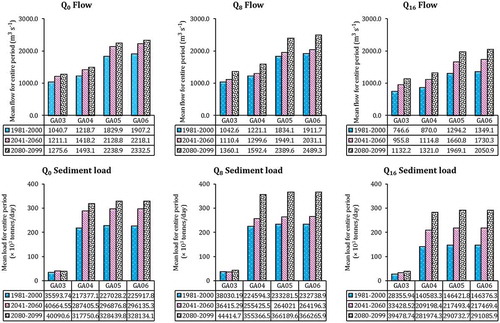
At all stations, annual flows are projected to increase by the 2050s and 2090s. The changes in flow and sediment concentration at all stations are quite similar for a particular scenario in both the time lines (). However, Garhmukteshwar, an upstream station, shows a decrease in sediment concentration by the end-century for all three scenarios. By mid-century, concentration is projected to decrease for the Q8 and Q16 scenarios, and increase for the Q0 scenario. For the stations in the Middle Ganga plain, namely Kachlabridge, Ankinghat and Kanpur, the increase in projected mid-century sediment concentration is maximum for the Q16 scenario followed by Q0 and then Q8 scenarios. However, by the end of the century, the increase in sediment concentration is maximum for Q16 followed by Q8 and then by Q0 scenarios.
Table 6. Percentage change in flow and suspended sediment concentration under the Q0, Q8 and Q16 scenarios.
5 Discussion
This study aimed to understand reference conditions of flow and sediment dynamics in the Ganga River system and use this understanding to model the flow and instream suspended sediment concentrations under a changing climate. Modern flows and sediment dynamics of the Ganga are far from natural. Urbanization and modernization through construction of dams and canals have exerted a heavy toll on the Ganga River system.
5.1 Flow and sediment characteristics for present-day conditions
The canal system in the Upper Ganga catchment commences from the mouth of the Bhimagauda Barrage, which serves as a headwork for the Upper Ganga and the Eastern Ganga canal system. Significant abstraction takes place from the Ganga River through these canals. Also, the canals and dams throughout the system alter the natural sediment flow characteristics of the system. On one hand, human activities such as deforestation and poor soil conservation techniques aggravate the erosional capacity of the river systems, while on the other hand, increased diversion and damming decrease the sediment load dramatically. In an analysis of environmental flows, Bharti et al. (Citation2011) concluded that dams and canals on the Ganga have not only reduced the high flows, but have also changed the timings of extreme flow events.
Our results show that after calibration the INCA model is able to capture the seasonal variability of flow very well. During non-monsoon flow conditions, the simulated and observed flow match exceptionally well as negligible abstraction is performed during this period. However, for stations downstream of Bhimgauda Barrage, the effect of abstraction is prominent as the observed flows are lower than the simulated flows. As good quality abstraction data were not available, this discrepancy could not be evaluated further; however, it may be the result of the extensive canal network in the region.
Sediment simulations are much more complex than those for flows, as the processes affecting sediment dynamics are themselves so intricate and perhaps not yet fully understood (Wolman Citation1977, Meade Citation1982, Walling Citation1983, Ebisemiju Citation1990, Syvitski Citation2003, De Vente and Poesen Citation2005, Fryirs Citation2017). Also, the presence of barriers and diversions on the river system has a profound impact on the sediment dynamics. Dams and canals do not allow the upstream sediments to traverse freely and render greater flow velocities downstream, causing considerable bank erosion. For the catchment outlet at Farakka, INCA computes total annual suspended sediment load as 356 × 106 t year−1 resulting in sediment yield of 369 t km−2 year−1. The main contributors to such high sediment yield are the agricultural and barren lands. Agricultural lands covering 57.2% of total area contribute 57.1% of total sediment yield and barren lands covering 20% of total area contribute approximately 30% of sediment yield.
Simulated values of sediment load match well with the observed data, with R2 ≥ 0.6, especially at Kachlabridge and Kanpur. For the model results at Garhmukteshwar and Ankinghat, the extreme suspended sediment peaks were not well simulated by the model. A potential reason for this is the sediment disconnectivity owing to the presence of human interventions (dams and canals), which are situated both upstream and downstream of Garhmukteshwar and Ankinghat. Also, the Ganga widens at Ankinghat such that the extent of the floodplains increases () and more sediment load is accommodated at higher discharge ().
At Farakka, in contrast to other stations, suspended sediment concentrations during the low flow period are over-predicted. Also, the peak concentration is variable, sometimes over-predicted or under-predicted. This high degree of day-to-day variability and lack of persistence seen with the discharge time series suggest that the Farakka Barrage, along with the abstraction channel diverting water to the Hooghly, alters the flow conditions such that the sediment dynamics is highly unpredictable. Using CWC daily flow and suspended sediment concentration data, the sediment load calculated downstream of Farakka from 1995–2007 was 200.53 × 10⁶ t year−1. In contrast, INCA computed the sediment load in the same window as 356.36 × 10⁶ t year−1. This difference in sediment load computed by INCA and CWC data is attributed to the effect of the Farakka Barrage. The Farakka Barrage became operational from 1975, and large quantities of water were diverted to the Hooghly for improving the navigability of the Kolkata port. As a result of this intervention, extensive siltation has taken place upstream of the barrage in the past few decades, resulting in lower downstream sediment loads. This has been manifested in significant changes in river morphology both upstream and downstream of the Farakka Barrage. Since the construction of the barrage, the upstream river channel has migrated eastwards appreciably, resulting in a mighty bend, and continuous oscillations and severe bank erosion have been observed in downstream reaches in Maldah district and the Indo-Bangladesh border (Rudra Citation2006, Citation2010, Sinha and Ghosh Citation2012). The Ganga River has become very unstable in this stretch, and there has been apprehension that it might flank the barrage. As the simulations presented here are based on unregulated flow conditions, i.e. in the absence of the Farakka Barrage, the sediment load simulated downstream of Farakka is greater than that calculated using the CWC data. However, the INCA simulated sediment load is in good agreement with the sediment load data before the commencement of the Farakka Barrage published by previous workers (Coleman Citation1969, Singh Citation1988, Hossain Citation1991, Islam et al. Citation1999).
5.2 Future flows and sediment load prediction with changing climate
With increases in precipitation and temperature in the future, INCA predicts an increase in flows during the monsoon months, with insignificant changes during the non-monsoon period (). Higher rainfall will result in higher flooding events and may enhance the groundwater recharge that can support water requirements during the lean months. Other hydrological modelling studies also predicted an intensification of extreme events such as floods and droughts in the future. Using SWAT, Gosain et al. (Citation2006) predicted that the Ganga system will face seasonal water stressed conditions in the future. Sharma et al. (Citation2010) and Raje et al. (Citation2014) also predicted that average annual streamflow in the Ganga will increase without much variation in the low flow months.
Along with increased flow, INCA predicts that the instream suspended sediment concentrations will also increase in the Ganga. In comparison to the present scenario, this study predicts an increase of 10–40% in the sediment load by mid-century and an increase of 35–79% by the end century from the three scenarios. This is because, with higher rainfall, splash erosion as well as flow erosion on land will increase due to an increase in the transport capacity of the system. In the river channel, higher flows will result in higher bank erosion as well as higher frequency of flooding, which will result in higher sediment generation from the floodplains. With increased runoff, the river catchment is expected to face accelerated erosion rates along with bank degradation, which will result in higher sediment load instream. The reservoir capacity of the river is expected to reduce, providing a positive feedback to the already flood-prone system and also reducing the stability of the river course, exacerbating high magnitude events such as river migration and avulsion. Also, higher instream sediment concentrations degrade water quality and ecology. The above percentage increases in sediment load for the 2050s and 2090s are higher than that predicted by Darby et al. (Citation2015) using an empirical lumped catchment model. They predicted increases of 16–18% for the mid-century and 34–37% for the end of the century. The main reason for this variability is the selection of the future climate scenarios. For the mid-century, Darby et al. (Citation2015) considered rainfall variation ranging from −9.9 to 12.2% and for the end of the century ranging from 5.1 to 29.5% with respect to the baseline. In the present study, the climate models used predict much higher increases in precipitation (). Nevertheless, the reach-scale calibration along with the use of monitored climate data results generated by INCA can be regarded as highly reliable.
As Garhmukteshwar is the most upstream station, the slopes there are the steepest and the valleys are deeply incised. In such a case, the stream power is high and the river spends more energy in cutting the river bed while the bank erosion is reduced. Inundation of the riparian area is minimal due to the cliff sections that reduce the floodplain erosion. Thus, heavy rainfall is expected to increase flows, but the instream suspended sediment concentrations may decline. In summary, with the intensification of monsoons, the sediment load will reduce in the Upper Ganga reaches, but increase in the downstream reaches due to river morphology and hinterland erosive processes.
6 Conclusion and recommendations
This study has provided insight on the current status of the hydrology of the Ganga River using the available observed data and has attempted to use a semi-distributed, process-based model to simulate the flows and fine suspended sediment dynamics of this large and complex catchment. The results for non-monsoon flow and sediment are highly satisfactory, as during this period, disturbances due to abstraction and human obstructions are minimal. During the monsoon period, several disturbances in flow and suspended sediment concentration were observed. However, for long durations, the INCA model yields highly acceptable results.
The observed CWC data give a sediment load of 200.53 × 10⁶ t year−1 downstream of Farakka, whereas the unregulated load simulated by INCA is 356.36 × 10⁶ t year−1. This suggests that an additional ~156 million tonnes of sediments are being deposited in this stretch, primarily due to the Farakka Barrage, and this underlines the impact of the Farakka Barrage on sediment regime. This also means that large-scale sediment removal is urgently required in this stretch to maintain the sediment regime of the river to an acceptable level and to prevent any serious disaster. Further, INCA calculated that 30% of the total sediment yield is contributed by the barren lands covering 20% of the basin. Hence, there is an urgent need for converting the barren lands through afforestation (preferably) or agriculture to curb the soil erosion. The INCA model predicts an increase in flow for the monsoonal period but minor changes in the non-monsoon period for all the three scenarios during both the time periods. This points towards increased rates of flooding of the Ganga in the future, with small changes in the water-stressed conditions during the low-flow period. For the suspended sediment load prediction, INCA shows an increase in sediment load for the western Ganga system during the monsoon and a decrease in the sediment load for the Upper Ganga stations. These projected changes of sediment load provide a first-hand estimate of the potential future sediment regime of the Ganga River. These results conclude that, along with meteorology, the topographical characteristics will play a significant role in determining the future sediment load of the Ganga.
These finding could be used for better management of the high-risk GBM Delta. Future sediment load and denudation rates of the delta can be calculated under changing boundary conditions. Other applications of this study can be foreseen as changing land-management properties and inclusion of interventions to yield possible future scenarios for better land and river management to deal with the changing climate, calculating erosion rates of various sub-basins, and determining the critical erosion-prone areas that need dire attention. With the availability of additional sediment data, particularly from the downstream stretches, a thorough calibration of the entire system can be performed, which can be used for calculating flows and instream suspended sediment for any time line with changing boundary conditions that can cater to filling data gaps for this river system. Another important aspect is to quantify the impact of each of the interventions on flows and sediment load more accurately, and compute the sediments being accumulated behind each of the interventions. This will be possible only if the data on flow diversions from various interventions are made available. These results can be used by the policy makers as a yardstick for future conditions of the Ganga River for managing the riparian ecosystem and designing hydraulic structures for sustainable development. Finally, it is seen that, using semi-distributed, physically-based models, sediment modelling can be performed in large, highly complex river systems with paucity of data. This opens the possibility of modelling other such catchments where availability of data is a critical issue.
Disclaimer
The views expressed in this work are those of the creators and do not necessarily represent those of DfID and IDRC or its Board of Governors.
Supplementary Material
Download MS Word (19.9 KB)Disclosure statement
No potential conflict of interest was reported by the authors.
Supplementary material
Supplemental data for this article can be accessed here.
Additional information
Funding
References
- Abbas, N. and Subramanian, V., 1984. Erosion and sediment transport in the Ganges river basin (India). Journal of Hydrology, 69 (1–4), 173–182. doi:10.1016/0022-1694(84)90162-8
- Ashmore, P.E., 1982. Laboratory modelling of gravel braided stream morphology. Earth Surface Processes and Landforms, 7 (3), 201–225. doi:10.1002/esp.3290070301
- Ashmore, P.E., 1991. How do gravel-bed rivers braid? Canadian Journal of Earth Sciences, 28 (3), 326–341. doi:10.1139/e91-030
- Bharati, L., et al., 2011. The impacts of water infrastructure and climate change on the hydrology of the Upper Ganges River Basin. Vol. 142. Colombo: IWMI.
- Borah, D.K., 1989. Sediment discharge model for small watersheds. Transactions of the ASAE, 32 (3), 874–0880. doi:10.13031/2013.31084
- Brierley, G.J. and Fryirs, K.A., 2013. Geomorphology and river management: applications of the river styles framework. New Jersey: John Wiley & Sons.
- Bussi, G., et al., 2016. Modelling the future impacts of climate and land-use change on suspended sediment transport in the River Thames (UK). Journal of Hydrology, 542, 357–372. doi:10.1016/j.jhydrol.2016.09.010
- Caesar, J., et al., 2015. Temperature and precipitation projections over Bangladesh and the upstream Ganges, Brahmaputra and Meghna systems. Environmental Science: Processes & Impacts, 17 (6), 1047–1056.
- Chakrapani, G.J. and Subramanian, V., 1993. Rates of erosion and sedimentation in the Mahanadi river basin, India. Journal of Hydrology, 149 (1–4), 39–48. doi:10.1016/0022-1694(93)90098-T
- Coleman, J.M., 1969. Brahmaputra River: channel processes and sedimentation. Sedimentary Geology, 3 (2–3), 129–239. doi:10.1016/0037-0738(69)90010-4
- Darby, S.E., et al., 2015. A first look at the influence of anthropogenic climate change on the future delivery of fluvial sediment to the Ganges–brahmaputra–Meghna delta. Environmental Science: Processes & Impacts, 17 (9), 1587–1600.
- De Vente, J. and Poesen, J., 2005. Predicting soil erosion and sediment yield at the basin scale: scale issues and semi-quantitative models. Earth-Science Reviews, 71 (1–2), 95–125. doi:10.1016/j.earscirev.2005.02.002
- Dettinger, M.D. and Diaz, H.F., 2000. Global characteristics of stream flow seasonality and variability. Journal of Hydrometeorology, 1 (4), 289–310. doi:10.1175/1525-7541(2000)001<0289:GCOSFS>2.0.CO;2
- Ebisemiju, F.S., 1990. Sediment delivery ratio prediction equations for short catchment slopes in a humid tropical environment. Journal of Hydrology, 114 (1–2), 191–208. doi:10.1016/0022-1694(90)90081-8
- Ferguson, R.I., 1993. Understanding braiding processes in gravel-bed rivers: progress and unsolved problems. Geological Society, London, Special Publications, 75 (1), 73–87. doi:10.1144/GSL.SP.1993.075.01.03
- Fryirs, K.A., 2017. River sensitivity: a lost foundation concept in fluvial geomorphology. Earth Surface Processes and Landforms, 42 (1), 55–70. doi:10.1002/esp.v42.1
- Futter, M.N., et al., 2014. PERSiST: a flexible rainfall-runoff modelling toolkit for use with the INCA family of models. Hydrology and Earth System Sciences, 18 (2), 855–873. doi:10.5194/hess-18-855-2014
- Futter, M.N., et al., 2015. Rainfall runoff modelling of the Upper Ganga and Brahmaputra basins using PERSiST. Environmental Science: Processes & Impacts, 17 (6), 1070–1081.
- Gosain, A.K., Aggarwal, P.K., and Rao, S., 2011. Linking water and agriculture in river basins: impacts of climate change. Unpublished Report.
- Gosain, A.K., Rao, S., and Basuray, D., 2006. Climate change impact assessment on hydrology of Indian river basins. Current Science, 90 (3), 346–353.
- Gourdji, S.M., et al., 2008. Modelling the interlinking of the Ganges River: simulated changes in flow. Chapter 7. In: M. Mirza and Q. Ahmed, eds. Interlinking of rivers in India: issues and concerns. London: CRC Press, Taylor and Francis, 107–128.
- Hopson, T.M. and Webster, P.J., 2010. A 1–10-day ensemble forecasting scheme for the major river basins of Bangladesh: forecasting severe floods of 2003–07. Journal of Hydrometeorology, 11 (3), 618–641. doi:10.1175/2009JHM1006.1
- Hossain, M.M., 1991. Total sediment load in the lower Ganges and Jumuna. Thesis. Bangladesh University of Engineering and Technology.
- Hovius, N., 1998. Controls on sediment supply by large rivers. In: K.W. Shanley and P.J. McCable, eds. Relative role of eustasy, climate and tectonism in continental rocks. Tulsa, OK: Society of Economic Paleontologists and Mineralogists, Special Publication 59, 3–16.
- IPCC (Intergovernmental Panel on Climate Change), 2001. Climate change: the scientific basis. Contribution of Working Group 1 to the Third Assessment Report of the Intergovermental Panel on Climate Change. Cambridge, UK: Cambridge University Press.
- IPCC (Intergovernmental Panel on Climate Change), 2014. Impacts, adaptation and vulnerability: global and sectoral aspects. Contribution of Working Group 2 to the Fifth Assessment Report of the Intergovermental Panel on Climate Change. Cambridge, UK: Cambridge University Press.
- Islam, M.R., et al., 1999. The Ganges and Brahmaputra rivers in Bangladesh: basin denudation and sedimentation. Hydrological Processes, 13 (17), 2907–2923. doi:10.1002/(ISSN)1099-1085
- Jackson-Blake, L.A., et al., 2016. The INtegrated CAtchment model of phosphorus dynamics (INCA-P): description and demonstration of new model structure and equations. Environmental Modelling & Software, 83, 356–386. doi:10.1016/j.envsoft.2016.05.022
- Jain, V. and Sinha, R., 2004. Fluvial dynamics of an anabranching river system in Himalayan foreland basin, Baghmati river, north Bihar plains, India. Geomorphology, 60 (1–2), 147–170. doi:10.1016/j.geomorph.2003.07.008
- Jin, L., et al., 2015. Assessing the impacts of climate change and socio-economic changes on flow and phosphorus flux in the Ganga River system. Environmental Science: Processes & Impacts, 17 (6), 1098–1110.
- Kale, V.S., et al., 1994. Geomorphic and hydrologic aspects of monsoon floods on the Narmada and Tapi Rivers in central India. Geomorphology, 10 (1–4), 157–168. doi:10.1016/0169-555X(94)90014-0
- Knisel, W.G., 1980. CREAMS: a field scale model for Chemicals, Runoff, and Erosion from Agricultural Management Systems [USA]. Washington, DC: US Department of Agriculture, Conservation Research Report.
- Lacy, S., 2006. Modeling the efficacy of the Ganga Action Plan’s restoration of the Ganga River, India. Doctoral dissertation. University of Michigan, USA.
- Lane, E.W., 1955. Importance of fluvial morphology in hydraulic engineering. Proceedings (American Society of Civil Engineers), 81 (745).
- Latrubesse, E.M., Stevaux, J.C., and Sinha, R., 2005. Tropical rivers. Geomorphology, 70 (3–4), 187–206. doi:10.1016/j.geomorph.2005.02.005
- Lazar, A.N., et al., 2010. An assessment of the fine sediment dynamics in an upland river system: INCA-Sed modifications and implications for fisheries. Science of the Total Environment, 408 (12), 2555–2566. doi:10.1016/j.scitotenv.2010.02.030
- Lisenby, P.E. and Fryirs, K.A., 2016. Catchment‐ and reach‐scale controls on the distribution and expectation of geomorphic channel adjustment. Water Resources Research, 52 (5), 3408–3427. doi:10.1002/2015WR017747
- Maheshwari, B.L., Walker, K.F., and McMahon, T.A., 1995. Effects of regulation on the flow regime of the River Murray, Australia. River Research and Applications, 10 (1), 15–38.
- Meade, R.H., 1982. Sources, sinks, and storage of river sediment in the Atlantic drainage of the United States. The Journal of Geology, 90 (3), 235–252. doi:10.1086/628677
- Milliman, J.D. and Syvitski, J.P., 1992. Geomorphic/tectonic control of sediment discharge to the ocean: the importance of small mountainous rivers. The Journal of Geology, 100 (5), 525–544. doi:10.1086/629606
- Moss, R.H., et al., 2010. The next generation of scenarios for climate change research and assessment. Nature, 463 (7282), 747–756. doi:10.1038/nature08823
- Pandey, A., et al., 2008. Runoff and sediment yield modeling from a small agricultural watershed in India using the WEPP model. Journal of Hydrology, 348 (3–4), 305–319. doi:10.1016/j.jhydrol.2007.10.010
- Quilbé, R. and Rousseau, A.N., 2007. GIBSI: an integrated modelling system for watershed management? Sample applications and current developments. Hydrology and Earth System Sciences Discussions, 4 (3), 1301–1335. doi:10.5194/hessd-4-1301-2007
- Raje, D., Priya, P., and Krishnan, R., 2014. Macroscale hydrological modelling approach for study of large scale hydrologic impacts under climate change in Indian river basins. Hydrological Processes, 28 (4), 1874–1889. doi:10.1002/hyp.9731
- Rogelj, J., Meinshausen, M., and Knutti, R., 2012. Global warming under old and new scenarios using IPCC climate sensitivity range estimates. Nature Climate Change, 2 (4), 248–253. doi:10.1038/nclimate1385
- Rudra, K., 2006. Shifting of the Ganga and land erosion in West Bengal: a socio-ecological viewpoint. Kolkata: Centre for Development and Environment Policy.
- Rudra, K., 2010. Dynamics of the Ganga in West Bengal, India (1764–2007): implications for science–policy interaction. Quaternary International, 227 (2), 161–169. doi:10.1016/j.quaint.2009.10.043
- Schumm, S.A., 1977. The fluvial system. NY: John Wiley.
- Sharma, B.R., Amarasinghe, U.A., and Ambili, G.K., 2010. Tackling water and food crisis in South Asia: Insights from the Indo-Gangetic Basin. Synthesis Report of the Basin Focal Project for the Indo-Gangetic Basin. Colombo, Sri Lanka: CGIAR Challenge Program on Water and Food (CPWF).
- Singh, R., Tiwari, K.N., and Mal, B.C., 2006. Hydrological studies for small watershed in India using the ANSWERS model. Journal of Hydrology, 318 (1–4), 184–199. doi:10.1016/j.jhydrol.2005.06.011
- Singh, R.K., et al., 2011. Simulation of runoff and sediment yield from a hilly watershed in the eastern Himalaya, India using the WEPP model. Journal of Hydrology, 405 (3–4), 261–276. doi:10.1016/j.jhydrol.2011.05.022
- Singh, S.K., 1988. Nature of chemical and sediment load in the Ganges River between Sone and Kosi. PhD Thesis. Jawaharlal Nehru University, New Delhi.
- Sinha, R., et al., 2008. Flood risk analysis in the Kosi river basin, north Bihar using multi-parametric approach of analytical hierarchy process (AHP). Journal of the Indian Society of Remote Sensing, 36 (4), 335–349. doi:10.1007/s12524-008-0034-y
- Sinha, R., 2009. The great avulsion of Kosi on 18 August 2008. Current Science, 97 (3), 429–433.
- Sinha, R. and Friend, P.F., 1994. River systems and their sediment flux, Indo‐Gangetic plains, Northern Bihar, India. Sedimentology, 41 (4), 825–845. doi:10.1111/sed.1994.41.issue-4
- Sinha, R. and Ghosh, S., 2012. Understanding dynamics of large rivers aided by satellite remote sensing: a case study from Lower Ganga plains, India. Geocarto International, 27 (3), 207–219. doi:10.1080/10106049.2011.620180
- Sinha, R. and Jain, V., 1998. Flood hazards of north Bihar rivers, Indo-Gangetic plains. Memoirs-Geological Society of India, (41), 27–52.
- Sinha, R. and Sarkar, S., 2009. Climate-induced variability in the Late Pleistocene–holocene fluvial and fluvio-deltaic successions in the Ganga plains, India: a synthesis. Geomorphology, 113 (3–4), 173–188. doi:10.1016/j.geomorph.2009.03.011
- Spear, R.C. and Hornberger, G.M., 1980. Eutrophication in Peel Inlet—II. Identification of critical uncertainties via generalized sensitivity analysis. Water Research, 14 (1), 43–49. doi:10.1016/0043-1354(80)90040-8
- Subramanian, V., 1979. Chemical and suspended-sediment characteristics of rivers of India. Journal of Hydrology, 44 (1–2), 37–55. doi:10.1016/0022-1694(79)90145-8
- Subramanian, V., 1996. The sediment load of Indian rivers – an update. In: D.E. Walling and B.W. Webb, eds., Erosion and sediment yield: Global and regional perspectives (Exeter Symposium). Wallingford, UK: International Associaion of Hydrological Sciences, IAHS Publ. vol. 236, 183–189. Available from: https://iahs.info/uploads/dms/iahs_236_0183.pdf [ Accessed 24 February 2018].
- Syvitski, J.P., 2003. Supply and flux of sediment along hydrological pathways: research for the 21st century. Global and Planetary Change, 39 (1–2), 1–11. doi:10.1016/S0921-8181(03)00008-0
- Tare, V., et al., 2017. Eco-geomorphological approach for environmental flow assessment in monsoon-driven Highland rivers: a case study of the Upper Ganga, India. Journal of Hydrology: Regional Studies, 13, 110–121.
- Thorne, C.R., 2002. Geomorphic analysis of large alluvial rivers. Geomorphology, 44 (3–4), 203–219. doi:10.1016/S0169-555X(01)00175-1
- Verisk Maplecroft, 2011. Climate change vulnerability index 2016. Bath, UK: Verisk Maplecroft.
- Vogel, R.M., and Fennessey, N.M., 1995. Flow duration curves II. Water Resources Bulletin, 31, 1029–1039.
- Wade, A.J., Whitehead, P.G., and Butterfield, D., 2002. The Integrated CAtchments model of Phosphorus dynamics (INCA-P), a new approach for multiple source assessment in heterogeneous river systems: model structure and equations. Hydrology and Earth System Sciences Discussions, 6 (3), 583–606. doi:10.5194/hess-6-583-2002
- Walling, D.E., 1983. The sediment delivery problem. Journal of Hydrology, 65 (1–3), 209–237. doi:10.1016/0022-1694(83)90217-2
- Wasson, R.J., 2003. A sediment budget for the Ganga–Brahmaputra catchment. Current Science, 84 (8), 1041–1047.
- Wells, N.A. and Dorr, J.A., 1987. Shifting of the Kosi river, northern India. Geology, 15 (3), 204–207. doi:10.1130/0091-7613(1987)15<204:SOTKRN>2.0.CO;2
- Wheaton, J.M., et al., 2013. Morphodynamic signatures of braiding mechanisms as expressed through change in sediment storage in a gravel‐bed river. Journal of Geophysical Research: Earth Surface, 118 (2), 759–779.
- Whitehead, P.G., et al., 2015a. Impacts of climate change and socio-economic scenarios on flow and water quality of the Ganges, Brahmaputra and Meghna (GBM) river systems: low flow and flood statistics. Environmental Science: Processes & Impacts, 17 (6), 1057–1069.
- Whitehead, P.G., et al., 2015b. Dynamic modelling of multiple phytoplankton groups in rivers with an application to the Thames river system in the UK. Environmental Modelling & Software, 74, 75–91. doi:10.1016/j.envsoft.2015.09.010
- Whitehead, P.G., et al., 2015c. Dynamic modeling of the Ganga River system: impacts of future climate and socio-economic change on flows and nitrogen fluxes in India and Bangladesh. Environmental Science: Processes & Impacts, 17 (6), 1082–1097.
- Whitehead, P.G., Wilson, E.J., and Butterfield, D., 1998. A semi-distributed Integrated Nitrogen model for multiple source assessment in Catchments (INCA): Part I—model structure and process equations. Science of the Total Environment, 210, 547–558. doi:10.1016/S0048-9697(98)00037-0
- Williams, J.R., 1980. SPNM, a model for predicting sediment, phosphorus, and nitrogen yields from agricultural basins. JAWRA Journal of the American Water Resources Association, 16 (5), 843–848. doi:10.1111/jawr.1980.16.issue-5
- Wolman, M.G., 1977. Changing needs and opportunities in the sediment field. Water Resources Research, 13 (1), 50–54. doi:10.1029/WR013i001p00050
- World Bank, 2012. Ganges strategic basin assessment: a discussion of regional opportunities and risks, March 2012. Washington, DC: World Bank.
- Young, P., Parkinson, S., and Lees, M., 1996. Simplicity out of complexity in environmental modelling: Occam’s razor revisited. Journal of Applied Statistics, 23 (2–3), 165–210. doi:10.1080/02664769624206
- Young, R.A., Onstad, C.A., and Bosch, D.D., 1995. AGNPS: an agricultural nonpoint source model. In: V.P. Singh, ed. Computermodels of watershed hydrology. Highlands Ranch, CO: WRP, 1001–1020.