ABSTRACT
Saturated hydraulic conductivity (Ks) affects the soil hydrological process and is influenced by many factors that exhibit strong spatial variations. To accurately measure Ks and its scale, spatial variability and relationship with collapsing gullies, we analysed four double-ring infiltrometer diameters in three soil layers during in situ experiments designed to measure Ks in two typical collapsing gullies (three slope sites) in Tongcheng County of China. The results showed that Ks increased with increasing inner ring diameter, but no significant difference existed between inner diameters of 30 and 40 cm. The Ks in red soil layers was higher than that in sandy soil layers, the transition layers had the lowest values. Ks also varied with slope position, gradually decreasing with distance from the gully head. The suggestion is that the spatial variation in Ks is affected not only by the intrinsic soil properties but also by the interaction with the collapsing gully.
Editor D. Koutsoyiannis ; Associate editor A. Fiori
1 Introduction
Saturated hydraulic conductivity (Ks) influences water storage and movement and is the single most important hydraulic property affecting water flow in soils (Bonsu Citation2013). Because it can affect the rates of water and solute transport through soil, it influences the patterns of infiltration and runoff generation (Ajaykumar et al. Citation1994). The Ks determines the maximum capacity of saturated soil water transport and reflects the soil infiltration and seepage properties that affect the migration of water and solutes in soil. Moreover, Ks controls not only all soil water dynamics but also the soil retention properties and the unsaturated conductivity. Therefore, the ability to accurately estimate Ks is of great theoretical and practical value. There are many types of determination methods for Ks; in general, these can be divided into field measurements and laboratory measurements (Rezaei et al. Citation2016). Field measurement instruments include tension disc infiltrometers, single- or double-ring infiltrometers, and mini-disc infiltrometers. Single- and double-ring infiltrometers are commonly used for in situ measurements of infiltration rate and Ks. The double-ring infiltrometer is the preferred choice. The use of the outer ring helps reduce errors that may result from lateral flow in soils (Fatehnia et al. Citation2016). When a double-ring infiltrometer is used to measure Ks, the inner diameter has a considerable influence on the measurement results. Because of the simplicity and accuracy of the double-ring infiltrometer apparatus, double-ring infiltrometers have been widely used.
For double-ring infiltrometer measurements of Ks, the soil is commonly assumed to be homogeneous within the measured area. Gregory et al. (Citation2005) concluded that, for a constant head test in the sandy soil common in northern and central Florida, USA, a double-ring infiltrometer with 15 cm inner diameter and 30 cm outer diameter is suitable. However, Lai and Ren (Citation2007) conducted a long-term tillage plot study in Gansu Province, northwestern China, and proposed that an inner ring diameter of at least 80 cm is needed to minimize the effects of lateral divergence. Ren et al. (Citation2012) examined the results of infiltration analysis measurements using different inner dimensions and reported that the soil texture of the hilly area of the Loess Plateau was relatively uniform. Therefore, an inner diameter of 20 cm and an outer diameter of 35 cm could be used in place of the conventional double-ring infiltrometers, which have an inner ring diameter of 30 cm. These results suggest that the change in texture affected Ks, and the optimal size required for a double-ring infiltrometer is therefore also different. In addition to soil texture, other factors influence the determination of Ks. Studies show that macropore distribution also affects Ks. Mohanty and Mousli (Citation2000) showed that the use of small samples with macropores increases the variability in the Ks measurements. Due to the uneven distribution of soil pores, the Ks results were different when double-ring infiltrometers with different diameters were selected. That is, Ks varied by more than an order of magnitude within a short distance due to the varying soil physical properties. This variability indicates that the measured results of double-ring infiltrometers may be scale dependent. To determine whether macropores affect Ks, the pore distributions of three test points (upper slope, middle slope and lower slope) were measured using a disc permeameter in our study. Considering the existence of macropores using larger inner ring diameters can provide reliable results but can be difficult, time-consuming and laborious, leading to new errors. Therefore, this option is not the best choice. Thus, it is necessary to select the best diameters for Ks measurements under different soil and topography conditions.
In addition to the effects of the size of the inner ring on Ks results, Ks exhibits strong spatial variability. Davis et al. (Citation1999) reported that Ks is commonly assigned single values over large areas in catchment models. Material handling, construction procedures and post-construction processes can influence the magnitude and spatial variability of Ks in recently constructed artificial ecosystems (Gwenzi et al. Citation2011). Geostatistics have been widely used to investigate the spatial variability of soil hydraulic properties in natural and agricultural soils, where coefficients of variation of 100–400% have been reported (Schwen et al. Citation2014). Sobieraj et al. (Citation2004) used a multi-scale analysis of a forested hillslope catena to demonstrate that there is little autocorrelation in Ks for sampling scales ranging from 25 to 0.25 m. The general lack of spatial structure in Ks suggests the dominance of small-scale processes, and the spatial variability in Ks is similar to that of the soil texture only when the sand component is ≥80%, suggesting that textural macroporosity is more important than bioporosity for extremely coarse textures. Wang et al. (Citation2013) indicated that using soil texture as a first approximation of the spatial patterns of Ks may be valid depending on the scale of observation. They collected undisturbed and disturbed soil samples from two soil layers and found that both surface Ks and subsurface Ks had log-normal distributions and exhibited strong spatial variability among the 382 selected sampling sites across the Loess Plateau of China (620 000 km2). One study noted the importance of flow through a larger pore size, which was confirmed in both the scale and variation of the spatial and seasonal perspectives, respectively (Gwak and Kim Citation2013). Previous studies have shown that Ks integrates numerous complex interactions among material properties, material handling and construction procedures, as well as the effects of biological activities such as bio-intrusion and macroporosity (Buczko et al. Citation2001, Buczko and Gerke Citation2005). These studies showed that Ks exhibits obvious spatial variability and that this variability is largely dependent on the soil properties, which determine whether the spatial variation in Ks is affected by other factors. Bogner et al. (Citation2014) detected a fissure network on a landslide that likely affected its hydrological behaviour. In one studied watershed, for rainfall-induced landslides, soil hydrological conditions such as soil moisture distribution were crucial (Guzzetti et al. Citation2008). Water flow in soils and the distribution of flow paths influence soil moisture. These findings illustrate that Ks exhibits strong spatial variability which may be due to the soil texture, bio-intrusion and macroporosity, erosional processes and so on.
The scale and spatial variation in Ks are affected by soil properties and local ecological processes. These spatial differences in Ks may then in turn profoundly affect the local hydrological and ecological processes of the landscape unit, thereby shaping or changing the landscape unit. For example, the variation in Ks is very important in terms of the erosion of a landscape unit through the combination of hydraulic and gravitational forces. Collapsing gullies, locally called benggang, are a form of eroding gully that is widespread in the granite bedrock areas of tropical and subtropical southern China (Jiang et al. Citation2014, Deng et al. Citation2017a). A typical mature collapsing gully consists of five parts: (i) the upper catchment, i.e. the slope above the gully head or the collapsing wall; (ii) the collapsing wall, where mass soil wasting, water erosion and gravity erosion are severe; (iii) colluvial deposits, which are formed by the deposition of residual material below the collapsing wall; (iv) the scour channel, i.e. the bottom of the deep and narrow channel, where sediment accumulation and transport occur; and (v) the alluvial fan, which is located in the lower reaches of the collapsing gully and below the gully mouth, where sediments transported by the collapse are deposited (Deng et al. Citation2017b). The slope above the collapsing wall is composed of a thick layer of deeply weathered granite and soil and can be divided into four levels: a red soil layer, a transition layer, a sandy soil layer and a detritus layer. At present, the mechanism and the cause of the formation of the collapse remain unclear, but slope hydrological processes have been determined to play an important role (Deng et al. Citation2017c). The differences in soil texture in each soil layer in the upper catchment are significant. Moreover, water infiltration and accumulation above the transition layer result in an increase in soil shear stress, leading to slope instability and stress reductions. Meanwhile, with the infiltration of water, the weight of the soil on the lower slope increases greatly, resulting in an increase in the sliding force of the soil unit and a decrease in the stability of the slope. The characteristics of Ks affect the soil hydrological processes and soil moisture status. Studying the spatial variability in Ks to determine reasonable Ks values for slope soils is highly valuable for further analyses of the mechanisms responsible for the development of collapsing gullies.
This paper measures the Ks of the soil at different slope sites on the upper catchment of collapsing gullies. The objectives of this study are to: (1) measure the soil Ks with different inner ring diameters to obtain the scale change of Ks, and determine the smallest required size of the inner ring for sampling; (2) explore spatial Ks variability over different depth levels and slope positions in the upper catchment of a collapsing gully; and (3) determine the potential relationship between the spatial variability in Ks and collapsing gully development.
2 Materials and methods
2.1 Description of the study area
Monitoring data reveal that collapsing gullies are widespread in the granitic red clay soil area of southern China, which stretches between 21°01ʹN–32°05ʹN and 106°49ʹE–120°27ʹE, and includes Hubei, Hunan, Jiangxi, Fujian and Guangdong provinces. The annual erosion in these provinces averages 50 kt/km, which is more than 50 times the erosion on gentler slopes or on slopes with a high vegetation cover (Zhong et al. Citation2013). Tongcheng County, in Hubei Province, has 1102 collapsing gullies. The county features a subtropical monsoon climate, with an average annual temperature of 15.5–16.7°C and an annual precipitation of 1450–1600 mm. Combined with a rainy climate and mountainous topography, a system of collapsing gullies has actively developed. These granite collapsing gullies are representative of the types of gullies common in southern China.
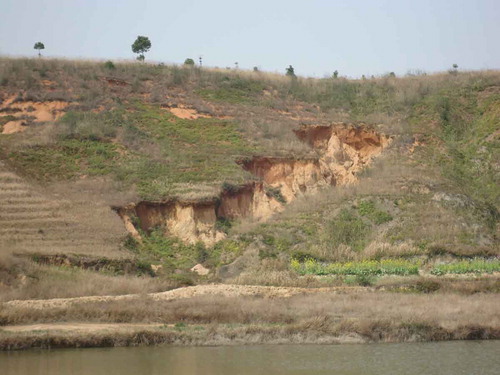
We selected two adjacent collapsing gullies in Tongcheng County as our experimental location (113°46′18″E, 29°20ʹ05″N), referred to as TC1 and TC2. Two-dimensional topographic maps of the two gullies are shown in . A photograph of the collapsing gully TC2 is presented in the Appendix (). The length of the slope of TC1 is 42 m, and the average slope of the watershed is 23°. The distances from the lower, middle and upper slopes to the collapsing wall (gully head) are 0.5, 10 and 16 m, respectively (). The length of the slope of TC2 is 80 m, and the average slope of the watershed is 25°. For TC2, the distance from the lower, middle and upper slopes to the collapsing wall is 0.5, 8.5 and 17.5 m, respectively (). At each slope site, we collected samples from three soil layers (red soil, transition and sandy soil) at three experimental sites in the upper catchments of both TC1 and TC2 (upper, middle and lower slopes). The basic physical properties of the soil for the two collapsing gullies TC1 and TC2 are shown in and , respectively.
Figure 1. Topographic maps of TC1 and TC2. The three slope sites (upper, middle and lower) and contour lines are presented. Numbers in brackets indicate distances from site to collapsing wall (gully head).
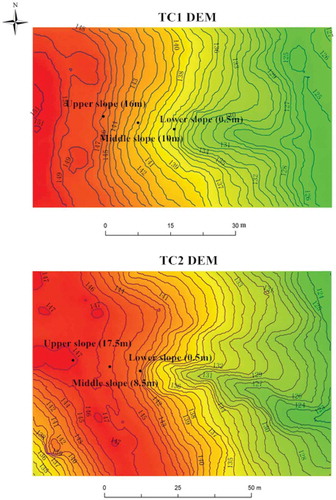
Table 1. Basic physical properties of soil in the test area for TC1.
Table 2. Basic physical properties of soil in the test area for TC2.
2.2 Infiltration measurements using the double-ring infiltrometer
The device for measuring the infiltration process consisted of two parts: a double-ring infiltrometer and a Markov bottle (length × width × height = 10 × 10 × 100 cm). The height of the stainless steel double ring was 20 cm. At each slope site, one measurement was taken with each of the four double-ring infiltrometers. The four inner diameters of the rings used in the field experiments were 10, 20, 30 and 40 cm, and corresponded to previous data with outer ring diameters of 20, 30, 40 and 50 cm, respectively. The average slopes of TC1 and TC2 are 25° and 23°, respectively. Ruggenthaler et al. (Citation2015) analysed double-ring infiltrometers at different slopes of 0 (level), 7, 15 and 20% in in situ experiments to measure infiltration rate and Ks. They noted that infiltration rate and the estimated hydraulic properties from infiltration rates would not vary much between level and sloping lands. Similarly, the experimental points in our research were chosen on relatively gently slopes when the double-ring experiment was conducted. During our in situ experiments designed to measure Ks, steel rings were pushed into the soil concentrically and parallel to the measurement surface, to a depth of 5 cm, with minimum soil disturbance. The experimental procedure followed the standard procedure for operating a double-ring infiltrometer. A balance ruler was then used to measure the inner and outer rings horizontally to keep them as concentric as possible. The water level in the inner ring was maintained with the Markov bottle, and the outer ring was manually filled with water to ensure that the water levels inside and outside the ring were consistent throughout the experiment process. The amount of water supplied by the Markov bottle was measured using the outer wall scale (0–100 cm) to the sub-0.1 cm level to accurately calculate the infiltration of water.
In the experiment, a 3-min reading was performed once, 5-min readings were performed three times, and the remaining readings were at 10-min intervals. Water temperature was measured using a Celsius thermometer. If the 10-min infiltration capacity was consistent over a period of 30 min, the stabilization phase was reached, and the test was ended.
2.3 Infiltration process simulation
The initial infiltration rate of the soil was calculated by the cumulative infiltration amount for the first 3 min during the double-ring infiltrometer test. The soil infiltration rates at different water temperatures were transformed into soil infiltration rates at a water temperature of 10°C. The steady infiltration rate was the mean value for three consecutive periods after the soil had reached steady infiltration. A regression analysis was used to analyse the Kostiakov model and Philip infiltration model and to simulate the infiltration process.
The Kostiakov model used the following formula:
where i(t) is the infiltration rate (mm/min), t is the infiltration duration (min), and both a and n are model parameters.
The Philip infiltration model used the following formula:
where i(t) and t are as defined above, s is the hygroscopic water (mm/min0.5), and A is the steady infiltration rate (mm/min).
2.4 Calculation of Ks
The saturated soil hydraulic conductivity, Ks (mm/min), was calculated as follows:
where A is the steady infiltration rate (mm/min), H is the height of the water head (cm), L is the inner ring depth of the soil (cm), Di is the inner diameter, and C1 and C2 are constants of 0.316π and 0.814π, respectively. For most structured soils ranging from clays through loams, as well as unstructured medium and fine sands, the most frequently applicable value of a for agricultural soils is 0.12 (Dane and Topp Citation2002).
2.5 Determination of soil physical properties
The bulk density (BD) was determined using a cutting ring and the dry weighing method (dried at 105°C), and the total porosity (TP) was calculated as TP = 1 – (BD/PD) (Cerdà and Doerr Citation2010). The aeration porosity and capillary porosity were obtained by the gravity drainage method. The particle-size distribution was determined using the sieve and pipette method (Gee et al. Citation1986). Using the textural classification of the US Department of Agriculture, the results were expressed in terms of sandy loam, loam and other soil types (Dexter Citation2004). A SMS tension infiltrometer (diameter: 20 cm) was used to measure the soil macropores. First, we adjusted the water level of the constant pressure tube with a syringe and set the water level (ψ); in our experiments, ψ was set to −12, −6, −3, −1 and 0 cm of water column. Water was then added into the water storage pipe, and the air tightness of the disc permeameter was checked. After recording the water temperature and the initial water level in the water pipe, the infiltrometer was placed on the red soil layer, the valve was opened, and timing was performed immediately after the wet front passed through the soil. At the beginning, a 10-s reading was performed once, 0.5-min readings were performed three times, and the remaining readings were taken at 1-min intervals until stable infiltration. After that, the porosity was calculated based on the infiltration results (Minasny and Mcbratney Citation2000, Liu et al. Citation2008). The porosities in the red soil layer at the different slope sites for TC1 are shown in .
Table 3. Porosity in the red soil layer at different slope sites for TC1.
2.6 Statistical analysis
The statistical analyses were done using the SPSS 19.0 for Windows statistical software package (SPSS Inc., Chicago, IL, USA, 2001). The analysis of variance (ANOVA) method was applied to analyse the role of the two “treatments” (the scale and spatial variation of Ks) on the value of the geometric mean. A single-factor ANOVA was used to analyse the Ks of the three soil layers with different inner ring diameters (10–40 cm). A refinement of the analysis was then made through pairwise sample comparisons with a two-sample t-test (significance 0.05) to analyse the Ks of the three different slope sites.
3 Results and analysis
3.1 Soil physical properties
shows the porosities at different slope positions for TC1 measured using a disc permeameter. Pore size of >1 mm in the lower slope (3.52%), is greater than those in the middle (1.52%) and the upper slopes (1.46%). The macropores in the lower slope are obviously larger than those in the middle and upper slopes. As shown in and , the aeration porosity varies along the slope direction such that it is greater in the lower slope than in the middle slope and upper slope. In addition, the soil bulk density has no regular change with soil depth and along the slope. Comparison of the same soil layer at different slope positions shows that the texture is basically unchanged. However, with an increase in depth, the clay content gradually decreases as the soil texture transitions from clay loam to sandy loam.
3.2 Infiltration process and the steady infiltration rate
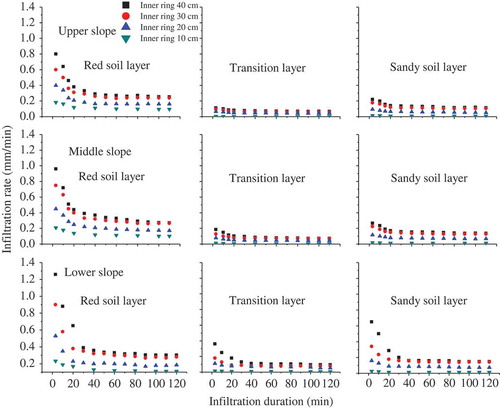
compares the infiltration rate at each soil layer and the different diameters of the inner ring size with time in the TC1 collapsing gully. The results of the TC2 experiment are similar to those of TC1; therefore, only the infiltration curve of TC1 is shown. shows that the infiltration rate experienced an initial steep decline for a short time and that it decreased over time. When the experiment lasted 90 min, the vast majority of the infiltration rates tended to be in a steady state, and the fluctuations exhibited a fixed value entering the stage of steady infiltration. This characteristic indicates that the Ks values of the soil measured via this test are reliable. As shown in , the initial infiltration rate and the steady infiltration rate increased with an increase in the inner diameter. However, the difference between 30 and 40 cm was small compared to the large difference between 10 and 20 cm. For example, on the upper slope of the TC1 red soil layer, the steady infiltration rates of the inner ring diameters of 40, 30, 20 and 10 cm were 0.25, 0.24, 0.16 and 0.10 mm/min, respectively. The measurement results for the inner ring diameter of 40 cm were approximately 1.0 times that for 30 cm, 1.6 times that for 20 cm and 2.5 times that for 10 cm. For the initial infiltration rate, that for inner ring diameter of 40 cm was approximately 1.3 times that for 30 cm, 2.0 times that for 20 cm and 4.3 times that for 10 cm.
Figure 2. Infiltration process at three sites (upper, middle and lower slopes) with different inner ring dimensions (10–40 cm) at different soil depths (red soil, transition and sandy soil layers) in TC1. The results of the TC2 experiment are similar to those of TC1.
and list the Kostiakov and Philip infiltration model parameters for TC1 and TC2, respectively. The correlation coefficients (R2) were high (R2 ≥ 0.728) for both models, the fitting results exhibited a significant correlation (p < 0.05), with most of them having very significant correlation (p < 0.01). The fitting effect for the different soil infiltration processes is in line with the Kostiakov and Philip models. From the simulation parameters of the regression equations, an increase in the inner ring diameter results in increases in the values of a, n, s and A.
Table 4. Infiltration simulation equations for different soil depths (red soil, transition and sandy soil layers) at the three slope sites with different inner ring sizes for TC1.
Table 5. Infiltration simulation equations for different soil depths (red soil, transition and sandy soil layers) at the three slope sites with different inner ring sizes for TC2.
For a given slope and a given inner ring diameter, the values of a, n, s and A were higher in the red soil layer than in the sandy soil layer and are lowest in the transition layer. Overall, for the three upper catchment areas of the collapsing gully test sites, the red soil layer featured the highest initial infiltration rate and steady infiltration rate, and the transition layer featured the infiltration curve that changed the least, with the lowest steady infiltration rate. With the increase in soil depth, the change in the whole infiltration process first decreased and then increased.
In addition to the depth of soil and the diameter of the inner ring, the initial infiltration rate and the steady infiltration rate also varied among the different slope positions. and show that a, n, s and A values on the lower slope were larger than those on the upper and middle slopes, which is consistent with the trend in the initial infiltration rate. Additionally, the initial infiltration rate and the infiltration rate for a given soil layer and a given inner ring diameter were significantly lower on the upper slope than on the middle and lower slopes.
3.3 Influence of inner ring diameter on Ks
shows the infiltration rates, the highest of which tended to correspond to the inner ring diameters of 30 and 40 cm. The overall trend was that the initial infiltration rate and the steady infiltration rate increased with increasing inner ring diameter from 10 cm to 40 cm. Changes in Ks values for different ring diameters, slopes and soil layers are shown in . The Ks values exhibited a single change with the diameter of the inner ring. The measured Ks values increased with increasing inner ring diameter, especially for the increase from 10 to 20 cm; at 30 cm, further increases were small; and at 40 cm, the curve was almost flat, with the results similar to those for 30 cm diameter.
Figure 3. Change in soil saturated hydraulic conductivity (Ks) with different inner ring diameters (10–40 cm) at different soil depths (red soil, transition and sandy soil layers) at different slope sites (upper, middle and lower slopes) in TC1 and TC2. The infiltration test with different inner ring diameters at the same site was performed at the same soil depth.
In , on the upper slope of TC1, the Ks values in the red soil layer were 0.21, 0.19, 0.11 and 0.06 mm/min for inner ring diameters of 40, 30, 20 and 10 cm, respectively. The result for the 40 cm diameter measurement was 3.5 times that for 10 cm, 1.9 times that for 20 cm and 1.1 times that for 30 cm. In the transition layer, the Ks values were 0.054, 0.041, 0.026 and 0.002 mm/min for 40, 30, 20 and 10 cm, respectively; the 40 cm diameter result was 27 times that for 10 cm, 2.1 times that for 20 cm, and 1.3 times that for 30 cm. In the sandy soil layer, the Ks values were 0.095, 0.083, 0.036 and 0.006 mm/min for 40, 30, 20 and 10 cm, respectively; the 40 cm diameter result was 15.8 times that for 10 cm, 2.6 times that for 20 cm, and 1.1 times that for 30 cm. Similarly, the other slope positions exhibited similar patterns in which Ks increased with increasing inner ring diameter from 10 to 40 cm.
The results of the single-factor ANOVA of Ks for the three soil layers with different inner diameters are shown in . The significance level was less than 0.05, indicating that significant differences existed among the saturated water conductivity results for different inner diameters. The significance values for different inner ring diameters in other analyses and comparisons are shown in . In and , for all soil layers, the measured Ks results differed significantly between the inner ring diameters of 10, 20 and 30 cm, whereas the difference between 30 and 40 cm was not significant. Additionally, the soil disturbance caused by the inner diameters of 30 and 40 cm exhibited no significant difference in terms of infiltration results, and the results obtained using these two diameters were basically the same.
Table 6. Effect of inner ring diameter at different soil depths on saturated hydraulic conductivity (Ks) using one-way ANOVA. The number of df (degrees of freedom) in the table is the number of values in the final calculation of a statistic that is free to vary. The value of F indicates whether the relationship between the explained variable and all the explanatory variables in the inferred model is overall significant or not.
Table 7. Intercomparison between inner ring diameter of 30 cm and diameters of 10–40 cm at different soil depths.
3.4 Variation in Ks with soil depth
Based on the accuracy of the Ks measurements, we selected the inner ring diameter of 30 cm to analyse the spatial variability. shows that the Ks values for the three soil layers (with increasing depth) on the upper slope of TC1 were 0.190, 0.041 and 0.083 mm/min. The Ks value in the red soil layer was 4.0 times that of the transition layer and 2.3 times that of the sandy soil layer. On the middle slope, the Ks value of the red soil layer was 0.211 mm/min, which was 3.9 times that of the transition layer and 2.0 times that of the sandy soil layer. On the lower slope, the Ks value of the red soil layer was 0.232 mm/min, which was 4.0 times that of the transition layer and 2.0 times that of the sandy soil layer. The Ks values were therefore larger in the red soil layer than in the sandy soil layer and were lowest in the transition layer. Similar results were obtained for TC2. The ratios of Ks among the different soil layers varied with the slope position. In addition, the Ks values not only changed with depth in the soil but also varied with the position on the slope.
3.5 Variation in Ks with position on the slope
The slope-related results are shown in . When we analysed the slope position, we compared the same soil layer with different slope positions. In TC1, the measured Ks values in the red soil layer of the lower slope were 1.1 times those of the middle slope and 1.2 times those of the upper slope. The values of the transition layer and sandy soil layer of the lower slope were both 1.1 times those of the middle slope and 1.4 times those of the upper slope. The Ks values in TC2 showed similar trends; the values on the lower slope were larger than those of the middle slope, and the values of the upper slope were the lowest. As listed in , the differences in Ks in the lower slope, middle slope and upper slope among the red soil layer, the transition layer and the sandy soil layer had significance values of less than 0.05, indicating that these differences were significant. As a whole, the differences among the Ks values increased while the actual Ks values decreased gradually with increasing distance from the collapsing wall. The Ks differed in different slope positions, and all the soil layers exhibited the same patterns.
Figure 4. Variation of saturated hydraulic conductivity (Ks) with slope (upper, middle and lower slope sites) at different soil depths; Ks was measured using an inner ring diameter of 30 cm.
Table 8. Results of t-test for Ks at different slope sites and soil depths.
4 Discussion
4.1 Influence of inner ring diameter on Ks
The 36 Ks measurements obtained in this study show that the diameter of the inner ring affected the Ks measurements. Combined with the actual operation, the conventional inner ring diameter and the common inner ring cutter sampling, we selected inner ring diameters of 10, 20, 30 and 40 cm to study the influence of the inner ring diameter change on Ks. The entire experimental process was not affected by the dead and decayed roots of grasses. Moreover, the soil was not very compacted, and hammering the double ring did not affect the soil. The Ks value is expected to increase with increasing inner ring diameter due to the existence of macropores in the soil. Our experimental results show that for both the initial infiltration rate and the steady infiltration rate, Ks increased considerably when the inner ring diameter was increased from 10 to 40 cm. However, this variation was significantly reduced for an inner ring diameter of 30 cm, which is now widely used (Bouwer Citation1986). Thus, a double-ring infiltrometer with an inner ring diameter of 30 cm can effectively reflect the actual infiltration process, and to obtain a reliable Ks, the inner ring diameter must be at least 30 cm on a granite hillslope in collapsing gullies in southern China. Previous studies have also shown that Ks increases as measurement scale or sampling volume increases, particularly for structured soils with macroporosity (Dikinya et al. Citation2008). Wu et al. (Citation1992) measured Ks in the laboratory using 7.5 and 30 cm soil columns and found that the values from the 30 cm cores were the greatest for all treatments and depths, which may be attributed to the role of continuous macropores in large core samples.
In general, the increase in inner ring diameter leads to an increase in the measured Ks value. The results for both a small inner ring diameter and a small soil column sample will be significantly lower. When using smaller samples, some of the smaller pores are squeezed and blocked during the sampling process, and some pore connectivity is blocked. Small samples are limited at the time of sampling, which may cause larger pores to be included in the sampling. Due to the limitations of the small sample size, some rules may not be followed. When the inner ring diameter is increased, the pore size in the soil sample will increase, which will cause the initial infiltration rate to increase and promote the infiltration of water, resulting in a sharp increase in the soil infiltration rate. Therefore, small sample volumes may fail to account for Ks and may include macropore or preferential flows (Mallants et al. Citation1997). Our results confirm these findings, in that, with the increase in inner ring diameter, the Ks value increased. That is, the diameter of the inner ring affects the measured value of Ks because the soil has macropores and the pore distribution is not uniform. Based on our investigation, due to the existence of macropores, we recommend that ring knives with diameters of 10 cm, which are commonly used in the laboratory, are far from optimal and are not suitable for soils containing larger pores. However, larger inner ring diameters may not be better because the field measurements will include additional error if the inner ring size is too large. Therefore, it is necessary to select the smallest required size for the inner ring when measuring Ks using a double-ring infiltrometer.
Existing studies have shown that the minimum inner diameter required for the experiment is related to the soil properties of the test site. In addition to being affected by macropores, Ks was affected by the texture, and the optimum inner diameter of the soil obtained from different textures was different. Lai and Ren (Citation2007) examined seven test sites and proposed that an inner ring diameter of at least 80 cm is needed to minimize the effects of lateral divergence. The average sand content at their test site was 37.8–76.9%, that of silt was 60.3–22.9%, and that for clay was approximately 1.9–0.2%. However, their research did not consider the effect of soil macropores. Nagare et al. (Citation2013) indicated that the saturated hydraulic conductivity (Ks) of peat is depth dependent and could increase or decrease with depth. The soil properties are also depth dependent: the physical and chemical properties are different at different soil depths, and this study was therefore conducted on different soil layers. Gregory et al. (Citation2005) performed constant head tests in a sandy soil common in northern and central Florida with a soil texture of 92% sand, 4.5% silt, and 3.1% clay. They concluded that a double-ring infiltrometer with an inner diameter of 15 cm and an outer diameter of 30 cm was suitable in their tests. As shown in , our research shows that the sand content in this experiment was between 40 and 60% and that silt and clay contents were both approximately 30%. Therefore, for soils with large amounts of sand, the minimum suitable size is relatively small because high sand contents are associated with less soil aggregate structure and simpler distribution of soil pores, leading to less heterogeneity in Ks. Thus, for sandy samples, the minimum sample size does not need to be large.
4.2 Influence of soil physical properties on Ks
Zimmermann and Elsenbeer (Citation2008) indicated that landslide processes affect the spatial structure of Ks in topsoils. Fu et al. (Citation2015) suggested that non-capillary porosity and BD might be the most important factors influencing surface soil Ks in karst areas. In terms of the collapsing gullies in our study, the physical properties of the soil near the collapsing wall are greatly affected by the collapsing gully. Our results show that the BD is not an important factor affecting Ks and that the TP values of the upper, middle and lower slopes are similar in the same soil layer. In contrast, as shown in , a pore size of >1 mm is 3.52% in the lower slope and greater than that in the middle slope (1.52%) and upper slope (1.46%). In addition, the pore sizes of the lower slope of >1, 0.5–1 and 0.2–0.5 mm are larger than those in the middle and upper slopes; the exception is the pore size of <0.2 mm. Macropores help the development of subsurface flow and make the rain infiltrate rapidly into the impermeable layer. As antecedent soil with the increase of moisture these pore networks become more connected. The subsurface flow is greater and more rapid (Luxmoore Citation1981, Tsuboyama et al. Citation1994). The equivalent pore size of a large pore is >1 mm. Warner et al. (Citation1989) used computed X-ray tomography to study macropores and defined pores as having larger apertures than aggregates or agglomerates. Therefore, our analysis of the impact of macropores on Ks mainly considered apertures of >1 mm. Our results indicate that pores of >1 mm are highest in the lower slope; the upper slope has a positive correlation with Ks. In addition, the macropores formed between the aggregates and the aeration pores are also largest in the lower slope and are smaller in the upper and middle slopes. In association to these collapsing gullies, the physical properties of the soil near the collapsing wall are greatly affected by the collapsing gully. In the direction along the slope and for the same soil layer, the texture has no difference, and the distribution of macropores therefore plays the dominant role. The macropores are high on the lower slope, and we stress that the macropores are not related solely to biological activity (e.g. animal burrows, root channels, and interpedal voids) but are also of mechanical origin. These macropores produce preferential flow paths (Beven and Germann Citation2013). Because a closer proximity to the collapsing wall is associated with decreased soil stability, the soil is subjected to a downward force, and it is easy to produce high porosities. Hence, the macropore porosity and aeration porosity are both higher on the lower slope near the collapsing wall. Consequently, Ks is greater on the lower slope than on the middle and upper slopes. But, in the vertical direction, the soil texture gradually increased with soil depth as the texture transitioned from clay loam to sandy loam. Therefore, in the vertical direction, the impact of the soil texture appears to have been much greater than that of macropore development. In summary, macropores had an obvious influence on Ks.
4.3 Influence of spatial variation in Ks on the slope
In addition to size effects, Ks changes with soil depth in the vertical direction and slope position in the horizontal direction. The magnitude and spatial variation of Ks have been described as the result of several independent processes operating at different spatial scales (Zeleke and Si Citation2005). Tian et al. (Citation2017) sampled 32 soil profiles with five layers within 0–70 cm under different land-cover types. Their findings suggest that Ks changes differently at different depths in different land-cover types. The Ks decreased with depth in forest, high-coverage grassland and barren land, but first increased then decreased under meadow and medium-coverage grassland. Our findings showed that Ks first decreases then increases with increasing soil depth. That is, the Ks values are higher in the red soil and sandy soil layers, but lower in the transition layer. The reason for this difference is the soil texture. The content of clay particles in the red soil layer is greater than that in the transition layer, but the Ks value of the red soil layer is obviously higher than that of the transition layer. In contrast, earlier studies on the vertical variation in Ks showed that it increases with soil depth and increases with increasing clay content, which gradually reduced potential (Carsel and Parrish Citation1988, Wösten et al. Citation1999, Marín-Castro et al. Citation2016). In our study area, the content of aggregates in the red soil layer is higher than those of the other soil layers, indicating that the red soil layer has a certain soil structure. In addition, plant roots can influence the soil structure and water content, and the pores of the red soil layer are larger. A greater number of pores can enhance the infiltration of water. For the upper catchment, Ks changes vertically. Lin et al. (Citation2013) obtained similar results; i.e. a weak permeable layer between the red soil layer and the sandy soil layer impedes water flow near saturation. Therefore, Ks does not always exhibit a decreasing trend with an increasing clay content, and the macropores in the soil structure contribute to the high Ks values, regardless of the effects of the clay content.
The Ks values vary not only with depth in the soil layer but also with distance from the collapsing wall. Hu et al. (Citation2013) studied the effects of scale and landscape features on Ks variability on the Chinese Loess Plateau. Their findings indicate that Ks values in collapsing gully areas were significantly lower than in sloping areas. The spatial pattern of Ks changed when the gully positions were included. The authors attributed the phenomenon to a greater proportion of fine particles (silt and clay) in the surface of the gullies. Furthermore, Lewis et al. (Citation2012) studied the spatial variability of the hydraulic conductivity along a blanket peatland hillslope. They found that Ks varies spatially and that the Ks values were higher in the bog interior than in the riparian zone. Some results show that the spatial variation in Ks is random, and Liu and Shao (Citation2009) found that Ks and its natural logarithm have no characteristic spatial variability across a distance of 360 m, indicating that both are purely random variables on the surface layer of a slope on the Loess Plateau. To study the Ks distribution of the collapsing gully along the slope, we selected three points on the upper, middle and lower slopes, with an average interval of 7 m – long enough to study the variation law of Ks in the direction along the upper catchment slope. Although three points are not enough for spatial variation, they are sufficient to analyse the direction along the slope. As shown in , Ks decreases with increasing distance from the collapsing wall. This phenomenon does not disappear with an increase in the soil depth. The Ks values were larger on the lower slope than those on the middle and upper slopes. There is no significant change in the soil texture of the same soil layer with different slope positions and, combined with the previous analysis, the dominant factor contributing to this phenomenon is the distribution of macropores. In addition, the reasons why there are more macropores on the lower slope are not related solely to biological activity but are also of mechanical origin. That is to say, this phenomenon is affected by the long-term gravity effect interaction with the collapsing gully.
We believe that the spatial variation in Ks with respect to changes in slope position is related to the formation and development of erosional collapsing gullies in a region underlain by granite. The characteristics of the infiltrating precipitation affect the soil hydrological processes and soil moisture status. Xia et al. (Citation2016) used a direct shear test to analyse the relationship and regularity of the shear strength variation with the soil moisture of collapsing granite gullies in different soil layers. The infiltration of water, especially via the relatively porous red soil layer, increases the mass of the soil body, resulting in an increase in sliding force acting on the soil mass. Their results show that the shear strength of the red soil layer, transition layer and sandy soil layer decreases with the increase in the water content. Moreover, the variation in the lateral flow on the slope causes horizontal spatial variation in Ks. The change in Ks is related to the presence of the collapsing gully, and the development of a collapsing gully affects Ks. Furthermore, this spatial Ks distribution affects the hydrological processes of the slope. In this sense, there is a positive feedback relationship between Ks and the development of a collapsing gully. Ks decreases with increasing distance from the collapsing walls, and the Ks values on the lower slope were larger than those on the middle and upper slopes. Therefore, with the infiltration of water, the weight of the soil on the lower slope increases greatly, resulting in an increase in the sliding force of the soil unit and a decrease in the stability of the slope. As a result, the lower slope of the upper catchment in a collapsing gully is the most vulnerable to erosion. We infer that the spatial variability occurs not only in the vicinity of the collapse gullies but also under other similar gravitational erosion conditions such as landslide slopes.
5 Conclusions
The double-ring infiltration process applied to different slope positions and soil depths in the upper catchment of a collapsing gully can be simulated by the Kostiakov and Philip equations. The Ks value increases with increases in the inner diameter. A diameter of 30 cm is the smallest required inner ring diameter for Ks measurements of the granite red soil. Furthermore, Ks exhibits obvious vertical spatial variation; the Ks values are high in the surface soil layer and deep sandy soil layer and low in the middle transition layer. The Ks values also vary with distance from the collapsing wall; the closer to the collapsing wall, the greater the Ks values. In summary, the macropores had an obvious influence on Ks along the slope, whereas in the vertical direction, the impact of soil texture appears to have been much greater than that of the macropores. The variability in Ks in the horizontal direction is related to the gravitational erosion associated with the collapsing wall.
Acknowledgements
We thank two reviewers and the editor for their useful comments.
Disclosure statement
No potential conflict of interest was reported by the authors.
Additional information
Funding
References
- Ajaykumar, Kanwar, R.S., and Hallberg, G.R., 1994. Modelling spatial variability of saturated hydraulic conductivity using fourier series analysis. Hydrological Sciences Journal, 39 (2), 143–156. doi:10.1080/02626669409492730
- Beven, K. and Germann, P., 2013. Macropores and water flow in soils revisited. Water Resources Research, 49 (6), 3071–3092. doi:10.1002/wrcr.20156
- Bogner, C., et al., 2014. Quantifying the morphology of flow patterns in landslide-affected and unaffected soils. Journal of Hydrology, 511 (7), 460–473. doi:10.1016/j.jhydrol.2014.01.063
- Bonsu, M., 2013. A study of a texture-based equation for estimating the saturated hydraulic conductivity of an alfisol in the sudan savannah ecological zone, ghana. Hydrological Sciences Journal/Journal Des Sciences Hydrologiques, 37 (6), 599–606. doi:10.1080/02626669209492626
- Bouwer, H., 1986. Intake rate: cylinder infiltrometer. In: A. Klute, ed. Methods of soil analysis. Part 1. 2nd ed. SSSA Book Ser. 5. Madison, WI: SSSA, 825–844.
- Buczko, U. and Gerke, H.H., 2005. Estimating spatial distributions of hydraulic parameters for a two-scale structured heterogeneous lignitic mine soil. Journal of Hydrology, 312 (1–4), 109–124. doi:10.1016/j.jhydrol.2005.02.040
- Buczko, U., Gerke, H.H., and Hüttl, R.F., 2001. Spatial distributions of lignite mine spoil properties for simulating 2-d variably saturated flow and transport. Ecological Engineering, 17 (2), 103–114. doi:10.1016/S0925-8574(00)00151-8
- Carsel, R.F. and Parrish, R.S., 1988. Developing joint probability distributions of soil water retention characteristics. Water Resources Research, 24 (5), 755–769. doi:10.1029/WR024i005p00755
- Cerdà, A. and Doerr, S.H., 2010. The effect of ant mounds on overland flow and soil erodibility following a wildfire in eastern spain. Ecohydrology, 3 (4), 392–401. doi:10.1002/eco.v3:4
- Dane, J.H. and Topp, G.C., 2002. SSSA book series: 5 Methods of soil analysis part4 – physical methods. Madision, WI: Soil Science Society of America.
- Davis, S.H., Vertessy, R.A., and Silberstein, R.P., 1999. The sensitivity of a catchment model to soil hydraulic properties obtained by using different measurement methods. Hydrological Processes, 13 (5), 677–688. doi:10.1002/(SICI)1099-1085(19990415)13:5<677::AID-HYP772>3.0.CO;2-N
- Deng, Y.S., et al., 2017a. Fractal features of soil particle size distribution under different land-use patterns in the alluvial fans of collapsing gullies in the hilly granitic region of southern China. Plos One, 12 (3), e0173555. doi:10.1371/journal.pone.0173555
- Deng, Y.S., et al., 2017b. Soil Atterberg limits of different weathering profiles of the collapsing gullies in the hilly granitic region of southern China. Solid Earth. doi:10.5194/se-8-1-2017
- Deng, Y.S., et al., 2017c. Soil erodibility and physicochemical properties of alluvial fan of collapsing gullies in South China. Pedosphere. doi:10.1016/S1002-0160(15)60105-9
- Dexter, A.R., 2004. Soil physical quality. Part I. Theory, effects of soil texture, density,and organic matter, and effects on root growth. Geoderma, 120 (3–4), 201–214. doi:10.1016/j.geoderma.2003.09.004
- Dikinya, O., Hinz, C., and Aylmore, G., 2008. Decrease in hydraulic conductivity and particle release associated with self-filtration in saturated columns. Geoderma, 146 (1–2), 192–200. doi:10.1016/j.geoderma.2008.05.014
- Fatehnia, M., Tawfiq, K., and Ye, M., 2016. Estimation of saturated hydraulic conductivity from double-ring infiltrometer measurements. European Journal of Soil Science, 67 (2), 135–147. doi:10.1111/ejss.2016.67.issue-2
- Fu, T., et al., 2015. Spatial variability of surface soil saturated hydraulic conductivity in a small karst catchment of southwest china. Environmental Earth Sciences, 74 (3), 2381–2391. doi:10.1007/s12665-015-4238-5
- Gee, G.W., Bauder, J.W., and Klute, A., 1986. Particle-size analysis, methods of soil analysis, part 1. Physical and mineralogical methods. Madison, WI: Soil since Society of America. Inc.
- Gregory, J.H., et al., 2005. Analysis of double-ring infiltration techniques and development of a simple automatic water delivery system. Applied Turfgrass Science, 2, 145–156. doi:10.1094/ATS-2005-0531-01-MG
- Guzzetti, F., et al., 2008. The rainfall intensity-duration control of shallow landslides and debris flows: an update. Landslides, 5 (1), 3–17. doi:10.1007/s10346-007-0112-1
- Gwak, Y. and Kim, S., 2013. Distribution characteristics of hydraulic properties on a mountainous hillslope. Geosciences Journal, 17 (3), 339–352. doi:10.1007/s12303-013-0022-2
- Gwenzi, W., et al., 2011. Field-scale spatial variability of saturated hydraulic conductivity on a recently constructed artificial ecosystem. Geoderma, 166 (1), 43–56. doi:10.1016/j.geoderma.2011.06.010
- Hu, W., Shao, M.A., and Wang, Q.J., 2013. Effects of measurement method, scale, and landscape features on variability of saturated hydraulic conductivity. Journal of Hydrologic Engineering, 18 (4), 378–386. doi:10.1061/(ASCE)HE.1943-5584.0000630
- Jiang, F., et al., 2014. Effects of rainfall intensity and slope gradient on steep colluvial deposit erosion in southeast China. Soil Science Society of America Journal, 78 (5), 1741. doi:10.2136/sssaj2014.04.0132
- Lai, J. and Ren, L., 2007. Assessing the size dependency of measured hydraulic conductivity using double-ring infiltrometers and numerical simulation. Soil Science Society of America Journal, 71, 1667–1675. doi:10.2136/sssaj2006.0227
- Lewis, C., Albertson, J., and Xu, X., 2012. Spatial variability of hydraulic conductivity and bulk density along a blanket peatland hillslope. Hydrological Processes, 26 (10), 1527–1537. doi:10.1002/hyp.8252
- Lin, J.L., Huang, Y.H., and Jiang, F.S., 2013. Study on the mechanism of difference soil layer’s permeability in Benggang. Journal of Soil and Water Conservation, 27 (2), 53–56. (In Chinese with English abstract).
- Liu, C. and Shao, M.A., 2009. Spatial variation of saturated hydraulic conductivity and soil water of the surface layer of a slope on the Loess Plateau. Science of Soil and Water Conservation, 7 (1), 13–18. (In Chinese with English abstract).
- Liu, J.W., Chen, H.S., and Zhang, W., 2008. Soil water infiltration measurement by disc permeameter in Karst depression. Journal of Soil and Water Conservation, 22 (6), 202–206. (In Chinese with English abstract).
- Luxmoore, R.J., 1981. Micro-, meso-, and macroporosity of soil. Soil Science Society of America Journal, 45 (6), 1246. doi:10.2136/sssaj1981.03615995004500030051x
- Mallants, D., et al., 1997. Spatial analysis of saturated hydraulic conductivity in a soil with macropores. Soil Technology, 10 (2), 115–131. doi:10.1016/S0933-3630(96)00093-1
- Marín-Castro, B.E., et al., 2016. Spatial distribution of hydraulic conductivity in soils of secondary tropical montane cloud forests and shade coffee agroecosystems. Geoderma, 283, 57–67. doi:10.1016/j.geoderma.2016.08.002
- Minasny, B. and Mcbratney, A.B., 2000. Estimation of sorptivity from disc-permeameter measurements. Geoderma, 95 (3), 305–324. doi:10.1016/S0016-7061(99)00096-8
- Mohanty, B.P. and Mousli, Z., 2000. Saturated hydraulic conductivity and soil water retention properties across a soil-slope transition. Water Resources Research, 36 (11), 3311–3324. doi:10.1029/2000WR900216
- Nagare, R.M., et al., 2013. Measuring saturated hydraulic conductivity and anisotropy of peat by a modified split-container method. Hydrogeology Journal, 21 (2), 515–520. doi:10.1007/s10040-012-0930-7
- Ren, Z.P., et al., 2012. Effects of double-ring diameter on soil infiltration rate. Journal of Soil and Water Conservation, 26 (4), 94–97. (In Chinese with English abstract).
- Rezaei, M., et al., 2016. The relevance of in-situ and laboratory characterization of sandy soil hydraulic properties for soil water simulations. Journal of Hydrology, 534 (1), 251–265. doi:10.1016/j.jhydrol.2015.12.062
- Ruggenthaler, R., et al., 2015. Investigating the impact of initial soil moisture conditions on total infiltration by using an adapted doublering infiltrometer. Hydrological Sciences Journal/Journal Des Sciences Hydrologiques. doi:10.1080/02626667.2015.1031758
- Schwen, A., Zimmermann, M., and Bodner, G., 2014. Vertical variations of soil hydraulic properties within two soil profiles and its relevance for soil water simulations. Journal of Hydrology, 516 (516), 169–181. doi:10.1016/j.jhydrol.2014.01.042
- Sobieraj, J.A., Elsenbeer, H., and Cameron, G., 2004. Scale dependency in spatial patterns of saturated hydraulic conductivity. Catena, 55 (1), 49–77. doi:10.1016/S0341-8162(03)00090-0
- Tian, J., et al., 2017. Variability in soil hydraulic conductivity and soil hydrological response under different land covers in the mountainous area of the Heihe river watershed, northwest china. Land Degradation and Development, 28, 1437–1449. doi:10.1002/ldr.2665
- Tsuboyama, Y., et al., 1994. Flow and solute transport through the soil matrix and macropores of a hillslope segment. Water Resources Research, 30 (4), 879–890. doi:10.1029/93WR03245
- Wang, Y.Q., et al., 2013. Regional-scale variation and distribution patterns of soil saturated hydraulic conductivities in surface and subsurface layers in the loessial soils of China. Journal of Hydrology, 487 (2), 13–23. doi:10.1016/j.jhydrol.2013.02.006
- Warner, G.S., Nieber, J.L., and More, I.D., 1989. Characerizing macropore in soil by computed tomography. Soil Science Society of America Journal, 53 (3), 653–660. doi:10.2136/sssaj1989.03615995005300030001x
- Wösten, J.H.M., et al., 1999. Development and use of a database of hydraulic properties of European soils. Geoderma, 90 (3–4), 169–185. doi:10.1016/S0016-7061(98)00132-3
- Wu, L., et al., 1992. Tillage effects on measured soil hydraulic properties. Soil and Tillage Research, 25 (1), 17–33. doi:10.1016/0167-1987(92)90059-K
- Xia, Z.G., et al., 2016. Relationship between soil shear strength and soil moisture of granite collapsing hill in southeast of Hubei Province. Science of Soil and Water Conservation, 14 (6), 26–34. (In Chinese with English abstract).
- Zeleke, T.B. and Si, B.C., 2005. Scaling relationships between saturated hydraulic conductivity and soil physical properties. Soil Science Society of America Journal, 69 (6), 1691–1702. doi:10.2136/sssaj2005.0072
- Zhong, B., et al., 2013. Using an ecological economics approach to support the restoration of collapsing gullies in southern China. Land Use Policy, 32, 119–124. doi:10.1016/j.landusepol.2012.10.005
- Zimmermann, B. and Elsenbeer, H., 2008. Spatial and temporal variability of soil saturated hydraulic conductivity in gradients of disturbance. Journal of Hydrology, 361 (1–2), 78–95. doi:10.1016/j.jhydrol.2008.07.027
Appendix
To better describe and more clearly show a collapsing gully, the collapsing gully of TC2 is shown in .
Figure A1. Photo of the collapsing gully of TC2.